Introduction
Depression and frailty are well identified, prevalent and related syndromes in older adults, although the exact relationship between them and with health outcomes is not clear (Feng et al., Reference Feng, Nyunt, Feng, Yap and Ng2014). The prevalence for depressive symptoms in older adults ranges from 10% to 15% (Kok and Reynolds, Reference Kok and Reynolds2017), and for frailty from 15% to 21% (O’Caoimh et al., Reference O’Caoimh2018). Although both conditions share some aspects (Lohman et al., Reference Lohman, Mezuk and Dumenci2017; Vaughan et al., Reference Vaughan, Corbin and Goveas2015) and present a bidirectional association (Collard et al., Reference Collard, Arts, Schene, Naarding, Oude Voschaar and Cornijs2017), they are two clear different entities (Mezuk et al., Reference Mezuk, Lohman, Dumenci and Lapane2013; Soysal et al., Reference Soysal2017). The pooled prevalence for depression in frail older adults is 38.6% and that for frailty in this population with depression is 40.4% (Soysal et al., Reference Soysal2017). Depression diagnosis must be made with the Diagnostic and Statistical Manual of Mental Disorders, Fifth Edition (American Psychiatric Association, 2013) criteria. However, depression risk is often measured as a surrogate of depression in older adults (Lohman et al., Reference Lohman, Mezuk and Dumenci2017), using validated scales like the 15-item Geriatric Depression Scale (GDS) from Yesavage. Scores of 5 and above have demonstrated high sensitivity (97%) and specificity (95%) in identifying cases of major depressive disorder from structured diagnostic interview using Structured Clinical Interview for depression (Feng et al., Reference Feng, Nyunt, Feng, Yap and Ng2014; Gana et al., Reference Gana, Bailly, Broc, Cazauvieilh and Boudouda2017; Nyunt et al., Reference Nyunt, Fones, Niti and Ng2009).
The European Union Joint Action ADVANTAGE defines frailty as a progressive age-related decline in physiological systems that results in decreased reserves of intrinsic capacity, which confers extreme vulnerability to stressors and increases the risk of a range of adverse health outcomes (Rodríguez-Laso et al., Reference Rodríguez-Laso2018). One of the most common ways to characterize this syndrome is the frailty phenotype, comprised by five criteria: unintentional weight loss, weakness, exhaustion, slow walking speed, and low level of physical activity (Fried et al., Reference Fried2001), although a deficit accumulation approach has also been described (Rockwood et al., Reference Rockwood2005).
Depression and frailty are both associated with negative consequences in older populations, including higher risk of disability, falls, functional impairment, mortality, institutionalization, hospitalization, poor quality of life, and increased healthcare costs (Almeida et al., Reference Almeida, Alfonso, Hankey and Flicker2010; Almeida et al., Reference Almeida, Hankey, Yeap, Golledge, Hill and Flicker2017; Bock et al., Reference Bock2016; Garcia-Nogueras et al., Reference Garcia-Nogueras, Aranda-Reneo, Peña-Longobardo, Oliva-Moreno and Abizanda2017; Rodda et al., Reference Rodda, Walker and Carter2011; Romero Rizos and Abizanda Soler, Reference Romero Rizos and Abizanda Soler2013; Soysal et al., Reference Soysal2017; Tomita and Burns, 2013; Vermeiren et al., Reference Vermeiren2016). Some studies have gone through the interaction between the presence of both frailty and depression with health outcomes in older ages. For instance, interactions regarding falls and institutionalization (Lohman et al., Reference Lohman, Mezuk and Dumenci2017) and length of stay and mortality among kidney transplant recipients (Konel et al., Reference Konel2018; Sy et al., Reference Sy, McCulloch and Johansen2019) have been described. However, the relationship between frailty and depression risk with mortality has only been assessed in some studies as secondary analyses (Bilotta et al., Reference Bilotta, Nicolini, Casè, Pina, Rossi and Vergani2012; Fried et al., Reference Fried2001), for selected groups of older adults like men (Almeida et al., Reference Almeida, Hankey, Yeap, Golledge, Norman and Flicker2015), or more recently using the deficit accumulations construct for frailty (Chang et al., Reference Chang2019). For this reason, the interaction between both entities is not well established in older adults. We analyzed this possible interaction using data from the Frailty and Dependence in Albacete (FRADEA) study.
Methods
Subjects, study design, and setting
This study presents data from the fourth wave of the FRADEA study, a population-based cohort study in Albacete city (Spain). The rationale, design, methodology, selection of subjects, and baseline characteristics have been previously described (Abizanda et al., Reference Abizanda2011). Briefly, from the census of health cardholders of Albacete aged ≥ 70 years (n = 18,137), 1172 participants were randomly selected. Finally, 993 participants (84.7%) agreed to participate. The baseline assessment was held between 2007 and 2009. These visits were conducted on-site by four trained nurses and were planned at our hospital. However, for those participants with mobility problems or living in facilities, the nurses collected the data at the participant’s home or at the facilities. We conducted a second-wave assessment by telephone between 2009 and 2011, a third-wave assessment on-site between 2011 and 2012, and finally a fourth-wave assessment on-site in 2017. Data from the first and fourth assessment were used in this paper. Supplementary Figure S1 presents the general flowchart of the study. A total of 800 participants with valid and complete data were included in the present study.
Frailty criteria
We used the frailty phenotype proposed by Fried et al. (Reference Fried2001). It is comprised by five criteria: unintentional weight loss, weakness, exhaustion, slow walking speed, and low level of physical activity. Unintentional weight loss was assessed using the same original cutoff points determined by Fried, low endurance with the two questions from the Center for Epidemiologic Studies Depression (CES-D) scale, weakness using a Jamar® digital Hand Dynamometer, and slow walking speed in 4 m. Physical activity was not determined with the Minnesota Leisure Time Physical Activity Questionnaire, instead we used the Calcumed® adopting the same original cutoff points. Subjects were classified as frail when three or more of the characteristics were present and prefrail when one or two were present. The subjects were classified as non-frail in the absence of criteria.
Depression risk
Depression risk was evaluated with the 15-item GDS from Yesavage. Depression risk was considered when as a score of 5 or more was achieved (Martí et al., Reference Martí2000; Yesavage et al., Reference Yesavage1983). This instrument includes questions regarding life satisfaction, mood, dropping in activities, emptiness, helpless, hopeless, energy, and boring feelings, being afraid of bad things, and memory problems, giving a final score between 0 (lowest scoring) and 15 (highest depressive symptoms scoring). Data were recorded by personal interview at baseline visit.
Depression risk and frailty
A new variable was created for analysis combining frailty status and depression risk. The new variable categorized participants in six independent groups (G) corresponding to every combination of the two categories for depression risk and three frailty criteria: G1: non-frail/no depression risk; G2: non-frail/depression risk; G3: prefrail/no depression risk; G4: prefrail/depression risk; G5: frail/no depression risk; and G6: frail/depression risk. The categories created are noncontinuous, and they are separate and independent.
Outcome variables
Mortality was noted along with the date it occurred. It was registered by telephone interview and medical chart review, but when it was impossible to find the information we consulted the dead registry of Albacete city.
Covariates
Age, sex, and institutionalization were recorded at the baseline visit. Chronic diseases were identified by medical records. Diseases were coded according to the ICD-10 and thereafter classified within large homogeneous groups for later analysis. The Charlson Comorbidity Index (Charlson et al., Reference Charlson, Pompei, Ales and MacKenzie1987) was used to analyze comorbidity. This index contemplates 17 categories of comorbidity (coronary disease, congestive heart failure, peripheral vascular disease, cerebrovascular disease, dementia, chronic pulmonary disease, connective tissue disease, peptic ulcer, mild liver disease, diabetes, hemiplegia, moderate–severe renal disease, diabetes with damage to target organs, any tumor-leukemia-lymphoma, moderate–severe liver disease, solid metastatic tumor, and acquired immunodeficiency syndrome), self-reported or by medical charts review. Each category has a weighting based on the risk of mortality within 1 year. The score for each patient was obtained by adding the weighting of each of the comorbid conditions contemplated in the index. High comorbidity was considered when Charlson index score was equal or greater than 3 points, using the cutoff points validated in previous studies (Sachdev et al., Reference Sachdev, Sun, Tsiatis, Nelson, Mark and Jollis2004; Singh et al., Reference Singh, Reeder, Jacobsen, Weston, Killian and Roger2002) and according to the design of the FRADEA study.
Polypharmacy was recorded at baseline visit based on medical records and personal interview. Number of drugs usually consumed was determined from the prescriptions that the participants took at home. Vitamins and mineral supplements were excluded as regular consumption drugs. Polypharmacy was defined as the use of five medications or more, as previous studies have considered (Bonaga et al., Reference Bonaga2018).
The methodology for application of all the assessment tools used as well as bibliographical references can be found in the original study.
Ethical aspects
The authors assert that all procedures contributing to this work comply with the ethical standards of the relevant national and institutional committees on human experimentation and with the Helsinki Declaration of 1975, as revised in 2008. All procedures involving human subjects/patients were approved by Ethics Review Committee of Albacete. All Participants provided signed an informed consent form prior to their inclusion in the study.
Statistical analysis
A descriptive analysis was performed, calculating the proportion of each subgroup based on depression risk and frailty status. We analyzed the association between combined depression risk and frailty, covariates and mortality using X 2 test or ANOVA when necessary. Thereafter, the association between frailty status combined with depression risk and mortality was analyzed crudely and adjusted for the clinically relevant study covariables (age, sex, institutionalization, high comorbidity, and polypharmacy) using logistic regression with 95% confidence interval (CI). The reference group was the no depression risk/non-frail (G1).
Second, we analyzed the probability of mortality during follow-up over 10 years by using Kaplan–Meier survival analysis, and the cumulative survival probability with Cox proportional hazard models adjusted for age, sex, institutionalization, high comorbidity, and polypharmacy.
Finally, we analyzed the presence of statistical interaction between frailty and depression risk regarding mortality risk. We constructed multivariate logistic regression models including the product “frailty × depression risk” and calculated the odds ratio (OR) for mortality with the 95% CI, for those frail and prefrail with or without depression risk.
All data were analyzed using the statistical program SPSS 23.0.
Results
A total of 800 participants from the FRADEA cohort were included with 470 (58.8%) women and a mean age of 78.5 years (SD 5.8 years; range 70–102). Table 1 presents the descriptive characteristics of the complete sample according to frailty groups. Frail participants regardless of depression risk tended to be older, and the percentage of women was higher as frailty increased. The number of non-frail participants was 196 (24.5%), 450 (56.3%) were prefrail, and 154 (19.3%) were frail. Then, 487 participants presented polypharmacy (60.9%) and 118 (14.8%) were in institutions. Mean Charlson index was 1.2 (SD 1.5; range 0–10), and mean number of frailty criteria was 1.4 (SD 1.2). Dementia was present in 71 (8.9%) participants, and ischemic cerebrovascular disease was in 67 (8.4%) participants. Participants in institutions were more frequently frail than those in the community, 36.4% and 16.3%, respectively (p < 0.001), and also presented more frequently depression risk, 51.7% and 30.4%, respectively (p < 0.001).
Baseline characteristics of the sample and health outcomes

Data are expressed as mean values (standard deviation) or frequencies (percentage). Depression risk was considered when Yesavage GDS was ≥ 5 points. High comorbidity was considered a Charlson index ≥ 3 points; polypharmacy was defined as the use of five or more usual medications.
ICVD, ischemic cerebrovascular disease; GDS, Geriatric Depression Scale.
* p < 0.001.
** p < 0.01.
The average score of GDS reported in our population was 3.7 (SD 3.2 points; range 0–15), increasing with the number of frailty criteria (p < 0.001). A total of 268 (33.5%) participants reported 5 or more points in the GDS, being at depression risk. The percentage of participants who met depression risk criteria was 15.3% in non-frail, 33.3% in prefrail, and 57.1% in frail ones. Depression risk was also associated with older age, female sex, high comorbidity, dementia, stroke, previous basic activities of daily living (BADL) disability, and polypharmacy (p < 0.001).
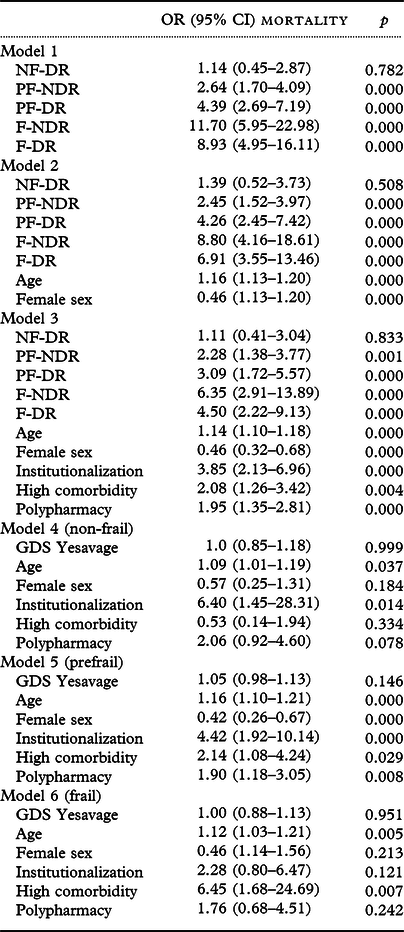
Mortality rate was 44.9% for a mean follow-up period of 2542 days (SD 1006; range 42–3788). Mortality for frailty groups was 21.4% for the non-frail, 45.6% for the prefrail, and 72.7% for the frail participants (p < 0.001). Mortality for those with depression risk was 56%, and for those without depression risk was 39.3% (p < 0.001). Mean GDS for those who died during follow-up was 4.4 points (SD 3.3) and for those who remained alive was 3.2 points (SD 3.0), mean of differences 1.2 points (95% CI 0.8–1.7; p < 0.001). Table 1 also presents the association between frailty groups and mortality that increased with higher frailty status. In multivariate analysis (Table 2), the combined construct of depression risk and frailty was associated with mortality. The final model explained 75.1% of the variability of mortality.
Adjusted association between depression risk, frailty, and mortality

Multivariate logistic regression analysis. Data are expressed by OR with 95% CI. Group 1 (non-frail without depression risk) is the reference group. Model 1: non-adjusted association with mortality by categories of frailty and depression risk. Model 2: age and female sex-adjusted association by categories of frailty and depression risk. Model 3: full-adjusted model by age, female sex, institutionalization, high comorbidity, and polypharmacy by categories of frailty and depression risk. Models 4–6 present full-adjusted associations including GDS from Yesavage as a continuous variable. High comorbidity: ≥ 3 points in Charlson index. Polypharmacy was defined as the use of five medications or more.
NF-DR, non-frail with depression risk; PF-NDR, prefrail without depression risk; PF-DR, prefrail with depression risk; F-NDR, frail without depression risk; F-DR, frail with depression risk.
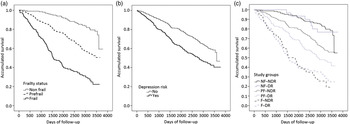
Figure 1 shows the results of the Kaplan–Meier analysis for frailty, depression risk, and the combined variable. Mean survival time for those with depression risk was 2491 days and for those without depression risk was 2961 days (log-rank X 2 25.9; p < 0.001) (Figure 1a). Mean survival time for non-frail, prefrail, and frail participants was, respectively, 3413, 2787, and 1925 days (log-rank X 2 135.4; p < 0.001) (Figure 1b). Mean survival time for the different groups (G1–G6) of the combined variable was, respectively, 3390, 3437, 2897, 2554, 1887, and 1931 days (log-rank X 2 144.1; p < 0.001) (Figure 1c).
Kaplan–Meier analysis between frailty status, depression risk, and mortality. (a) Depression risk. (b) Frailty status. (c) Combined variable of frailty and depression risk.

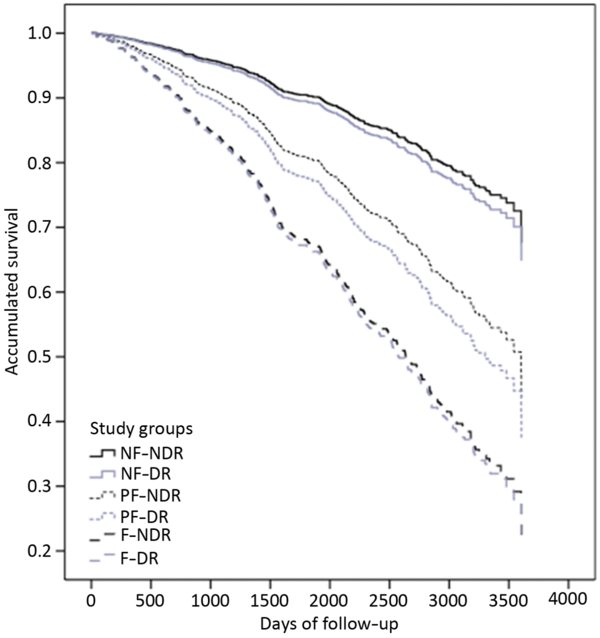
Figure 2 presents the association between depression risk combined with frailty and mortality using Cox proportional hazard models adjusted by age, sex, high comorbidity, institutionalization, and polypharmacy. In groups G3, G4, G5, and G6, the adjusted mortality risk was HR 2.1 (95% CI 1.4–3.1), HR 2.5 (95% CI 1.7–3.8), HR 3.8 (95% CI 2.4–6.1), and HR 4.0 (95% CI 2.6–6.2), respectively, compared with G1 (p < 0.001). No association was detected with G2 (HR 1.1; 95% CI 0.5–2.5).
Cox proportional hazard analysis between frailty status, depression risk, and mortality. Adjusted by age, sex, institutionalization, high comorbidity, and polypharmacy.

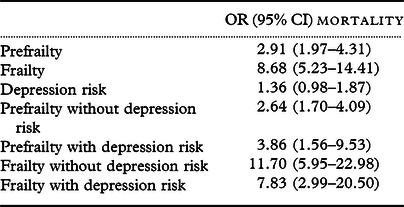
Finally, Table 3 presents the interaction models between frailty status and depression risk. It can be appreciated that the mortality risk changes in frail and prefrail older adults, depending whether they have or they not have depression risk. The interaction factor was nonsignificant (p = 0.458 and p = 0.504 for prefrailty and frailty, respectively), but the coefficients were other than 0 (B = 0.380 and B = −0.401 for prefrailty and frailty, respectively), suggesting interaction. The mortality risk increased in prefrail older adults with depression risk (3.86) compared to those without depression risk (2.64) but was attenuated in frail ones with depression risk (OR 7.83) compared to those without depression risk (OR 11.70).
Interaction models between depression risk, frailty, and mortality

Data are expressed by OR with 95% CI. Prefrailty, frailty, and depression risk were first analyzed individually by multivariate logistic regression analysis (three upper rows). Prefrailty and frailty with or without depression risk were further analyzed with multivariate logistic regression analysis adding interaction between both variables (frailty × depression) (rows 4–6). It can be seen how adding depression risk to prefrailty modifies the intensity of the association between these two conditions, that is, higher in those with depression risk. The addition of depression risk to frailty also modifies the association, not only in intensity but also in direction, because those without depression risk exhibit higher mortality than those with depression risk. However, the interaction term was nonsignificant (p = 0.458 for prefrailty and p = 0.504 for frailty), and for this reason it has not to be included in the final models of association.
Discussion
This study shows that frailty status and depression risk are co-related, and that their interaction determines the frequency of mortality, mainly in prefrail older adults. Only in the prefrail population, depression increases mortality risk.
In our population, we found high rates of frailty and depression risk of 19.3% and 33.5%, respectively, in agreement with previous studies. A recent systematic review described a pooled frailty prevalence of 18% (95% CI 15–21) in population cohorts using the frailty phenotype (O’Caoimh et al., Reference O’Caoimh2018), and population studies in older adults have found depression risk prevalence between 23.6% and 38.2% (Kronfly Rubiano et al., Reference Kronfly Rubiano2015; Li et al., Reference Li, Zhang, Shao, Qi and Tian2014; Luppa et al., Reference Luppa2012; Sarró-Maluquer et al., Reference Sarró-Maluquer, Ferrer-Feliu, Rando-Matos, Formiga and Rojas-Farreras2013) using the GDS or the CES-D tools.
Different cross-sectional studies have analyzed the relationship between frailty and depression risk in old ages (Almeida et al., Reference Almeida, Hankey, Yeap, Golledge, Norman and Flicker2015; Buigues et al., Reference Buigues, Padilla-Sánchez, Garrido, Navarro-Martínez, Ruiz-Ros and Cauli2015; Chang et al., Reference Chang2019; Collard et al., Reference Collard, Comijs, Naarding and Oude Voshaar2014; Lohman et al., Reference Lohman, Dumenci and Mezuk2016; Mezuk et al., Reference Mezuk, Lohman, Dumenci and Lapane2013; Sarró-Maluquer et al., Reference Sarró-Maluquer, Ferrer-Feliu, Rando-Matos, Formiga and Rojas-Farreras2013; Soysal et al., Reference Soysal2017; Vaughan et al., Reference Vaughan, Corbin and Goveas2015), including centenarians (Ribeiro et al., Reference Ribeiro, Duarte, Teixeira and Paúl2018), showing a positive association. Recently, a systematic review and meta-analysis found an overall prevalence of depression in frail older adults of 38.6% (95% CI 30.1–47.1) and a prevalence of frailty in those with depression of 40.4% (95% CI 27.0–53.3) (Soysal et al., Reference Soysal2017). Our study shows higher figures for depression risk in frail older adults, 57.1%, and similar for frailty in those with depression risk, 32.4%. Our cohort is composed of adults older than 69 years and included institutionalized subjects. These cohort characteristics could explain the differences in the figures between frailty and depression risk with other studies, although factors like depression diagnosis, inclusion or exclusion of participants with dementia or stroke could also be important. Few longitudinal studies have analyzed this relationship presenting confounding data. Some of them have found a relationship between frailty and incident depression (Collard et al., Reference Collard2015; Feng et al., Reference Feng, Nyunt, Feng, Yap and Ng2014; Makizako et al., Reference Makizako2014; Soysal et al., Reference Soysal2017) or depression course (Collard et al., Reference Collard2015; Collard et al., Reference Collard, Arts, Schene, Naarding, Oude Voschaar and Cornijs2017), while others have not (Makizako et al., Reference Makizako2014; Veronese et al., Reference Veronese2017), although changes in frailty status could account for depression risk (De Rui et al., Reference De Rui2017). Recently, Chang et al. described that frail older adults, determined with the accumulation of deficits construct, with depressive symptoms, had a lower chance of recovery and a higher chance of dying than individuals with frailty who did not have depressive symptoms (Chang et al., Reference Chang2019).
Late-life depression and frailty share several physiologic mechanisms, including subclinical cerebrovascular disease, cardiovascular disease, low-grade chronic inflammation, hypothalamic–pituitary–adrenal axis dysregulation, impaired mitochondrial biogenesis, dopaminergic neurotransmission impairment, or accelerated aging biology (Vaughan et al., Reference Vaughan, Corbin and Goveas2015). With this causative background and the knowledge of a high-risk morbidity and mortality of both associated conditions, a model for confluence between depression and frailty, the so-called “depressed frail phenotype,” has been proposed. This model sustains that frailty and depression in older adults, when together, represent the end clinical manifestation of greater biological aging (Brown et al., Reference Brown2016a). However, our data do not support this theory. Although we found a relationship between frailty and depression, and an interaction between both conditions in multivariate analysis, they were independently associated with mortality suggesting that there must be other factors modulating the associations that should be explored in future studies. In our analysis, we controlled for comorbidity, polypharmacy, and institutionalization as major confounders, but we cannot exclude that other factors like social support, specific life-threatening diseases not included in the Charlson index, or specific treatments, could also modify this association.
Frailty (Hoogendijk et al., Reference Hoogendijk2019; Kojima et al., Reference Kojima, Iliffe and Walters2018) and depression risk (Almeida et al., Reference Almeida, Alfonso, Hankey and Flicker2010; Rodda et al., Reference Rodda, Walker and Carter2011) are well-known conditions associated with high mortality rates in older adults when considered as separate entities. However, Brown et al. (Reference Brown2014), using data from the Nordic Research on Ageing Study, described that the confluence of certain frailty criteria, mainly fatigue and slow gait speed, with depression risk measured with the CES-D instrument, resulted in an increased mortality risk in older adults. More in depth, the presence of depression in older women nearly doubled the effect of both frailty criteria on mortality rates. In a second study using data from the Health Aging and Body Composition Study, Brown et al. (Reference Brown2016b) described that older adults with worse depression, inflammation, and gait speed trajectories all together as a group had an adjusted morality rate of 85.2%, greater than the rest of study participants. The authors identified a high mortality risk phenotype, including inflammation, depression, and slow gait speed that should be identified in older adults using comprehensive geriatric assessment, in order to develop intervention and prevention strategies. Although follow-up times were very long in both studies, prefrailty was not analyzed as an independent category, participants did not represent the complete population spectrum of old age, and missing data yielded low frailty prevalence rates.
Previous data from our group have shown that frailty is a state of very high mortality risk, very close to that of older adults with low disability and dependency in BADL. For this reason, the addition of other well-known risk factors like depression risk in this population may not increase the intensity of the association between frailty and mortality (Hoogendijk et al., Reference Hoogendijk2019). Depression risk and frailty status in old populations may share some physiologic and clinical aspects that could produce a competitive mortality risk bias. However, prefrail older adults are a broad and heterogeneous risk population that needs further phenotypation and classification in order to better categorize those at real high risk of adverse events. In this prefrail population, accounting for 40% and 50% of older adults, the characterization of depression risk could be of great interest not only for epidemiological and stratification purposes, but also for interventions, because both frailty and depression are reversible conditions with appropriate treatments, like lifestyle interventions, exercise, nutrition, antidepressants, or psychiatric approaches (Ng et al., Reference Ng2017).
The main strengths of our study are that frailty was assessed with the frailty phenotype in order to compare our results with other studies that we included both institutionalized and community-dwelling participants adding heterogeneity to the sample and that we included a long follow-up period. The rate of missings and abandons was low, and the study team remained stable all across the study. All the results were adjusted for comorbidity and polypharmacy because they are highly prevalent in frailty and depressed subjects.
One of the main weaknesses is that we could not demonstrate the pathogenic rationale between frailty and depression risk, and that the risk of depression was not assessed by clinical diagnosis based on DSM-5 criteria. Another limitation could be the selection of the GDS-15 to determine depression risk. However, this has been the most extensively used scale for this purpose in older adults (Ribeiro et al., Reference Ribeiro, Duarte, Teixeira and Paúl2018; Veronese et al., Reference Veronese2017). It has been described that scores reflect a relatively stable and enduring depressive trait explaining between-person differences in depressivity (Gana et al., Reference Gana, Bailly, Broc, Cazauvieilh and Boudouda2017). Furthermore, it is a reliable and valid screening for major depressive disorder in older adults across different chronic illness status with an overall sensitivity of 0.97 and specificity of 0.95 (area under the curve 0.98) (Nyunt et al., Reference Nyunt, Fones, Niti and Ng2009).
The results of our study suggest that in prefrail older adults, depression risk could be of interest in order to identify a special group presenting a high mortality risk. However, further research is needed to investigate which is the physiologic and clinic relationship between frailty and depression, to determine the exact prefrail phenotype at increased risk of adverse events and to define effective interventions in this population, taking into account new possible variables like nutritional status, specific diseases, cognition and affect, social support, and specific drug characteristics.
Conflicts of interest
All authors declare that there are no conflicts of interest.
Source of funding
This work was supported by CIBERFES (CB16/10/00408), Instituto de Salud Carlos III, Ministerio de Economía y Competitividad, España. Ayuda cofinanciada por el Fondo Europeo de Desarrollo Regional FEDER Una Manera de hacer Europa.
Description of authors’ roles
Marta Carolina Ruiz-Grao: manuscript elaboration and statistics.
Pedro Manuel Sánchez-Jurado: manuscript elaboration and data acquisition.
Milagros Molina-Alarcón: manuscript review.
Antonio Hernández-Martínez: statistics.
Almudena Avendaño Céspedes: data acquisition and manuscript elaboration.
Pedro Abizanda: principal investigator.
Supplementary material
To view supplementary material for this article, please visit https://doi.org/10.1017/S1041610220003506