

I
In their article ‘A happy choice: wellbeing as the goal of government’, Paul Frijters, Andrew E. Clark, Cristian Krekel and Richard Layard (hereafter Frijters et al.) provide a short but comprehensive historical perspective on the notion of ‘happiness’, from its roots in the Aristotelian concept of eudemonia, to John Locke and the US Declaration of Independence, to its modern applications in psychological and social research. The field of ‘happiness research’ has experienced an exponential rise in recent years, not only in terms of academic papers, but also in statistical practice. Concerning the latter, developments have in large part been inspired by the Commission on the Measurement of Economic Performance and Social Progress (a.k.a. Stiglitz, Sen and Fitoussi, from the names of its Co-Chairs), which recommended that ‘Statistical offices should incorporate questions to capture people's life-evaluations, hedonic experiences and priorities in their own surveys’ (Stiglitz et al., Reference Stiglitz, Sen and Fitoussi2010).
The OECD has contributed to this expansion in the statistical field in quite a significant way, in particular through the release in 2013 of a set of Guidelines on Measuring Subjective Well-Being (OECD, 2013). Taking stock of what was known at the time about the reliability and validity of existing measures, the Guidelines’ conclusions were identical to the ones summarized in the ‘Measurement and validity of wellbeing’ section of Frijters et al.: we knew enough about the statistical properties of existing measures of subjective wellbeingFootnote 1 to conclude that, while affected by ‘noise’ (as are all self-reported measures), these measures also provide a meaningful ‘signal’. The OECD Guidelines suggested that national statistical offices should include a ‘primary measure’ of people's life satisfactionFootnote 2 in their household surveys, as well as a limited set of ‘core measures’ about people's sense of meaning and purpose in life and of their emotional experiences. While the OECD Guidelines also included a broader range of questions and survey modules, the ‘primary and core’ questions were put forward as the minimal set of questions on subjective wellbeing that statistical offices should include in their surveys. Many OECD national statistical offices have included the OECD ‘primary measure’ of life evaluation in at least one of their household surveys, and a number have also implemented modules to measure experienced wellbeing in their time-use surveys (O'Donnell et al., Reference O'Donnell, Deaton, Durand, Halpern and Layard2014).
II
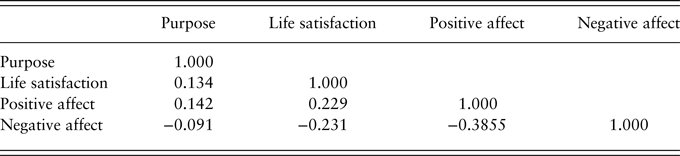
An important difference between the OECD approach to subjective wellbeing and that of Frijters et al., however, is that, in the former, the notion of subjective wellbeing is subsumed into life satisfaction only. Rather, subjective wellbeing encompasses three conceptually different aspects (i.e., life satisfaction, emotional experiences and people's sense of meaning and purpose with their lives). Distinguishing between these three aspects is important for both research and policy, as they respond to different drivers (e.g., patterns of time use in the case of emotional experiences, a broader range of life circumstances such as income, health status and connections with others in the case of life satisfaction) and have different consequences for the person considered. The low correlations between these three aspects of subjective wellbeing, when measured at the individual level across all of the countries covered in the Gallup World Poll (Table 1), provides solid empirical support to the view that the three aspects of subjective wellbeing should be kept separate rather than conflated in a single notion of ‘happiness’ (Stone & Mackie, Reference Stone and Mackie2013).
Correlation coefficients among life satisfaction, sense of purpose and positive and negative affect among people across the world.

Note: The precise measures used are the so-called ‘Cantril ladder’ for life satisfaction, an ‘important purpose’ in life for purpose and the sum of ‘yes’ responses to smiled yesterday, experienced joy yesterday and was well rested yesterday for positive affect and an equivalent index based on experience of sadness, worry and depression for negative affect.
Source: Gallup World Poll. Reproduced from OECD (2013).
Frijters et al. consider the difference between these three concepts as mainly one of ‘language’: ‘We will thus use the words of “happiness”, “life satisfaction” and “wellbeing” interchangeably,’ while also adding ‘we will be more precise in how they subtly differ when we talk about measurement and cost–effectiveness’ (emphasis added). However, evidence from new research accumulated since 2013, as summarized by Stone and Krueger (Reference Stone, Krueger, Stiglitz, Fitoussi and Durand2018) in the report of the OECD-hosted High Level Expert Group on the Measurement of Economic Performance and Social Progress -- the group that pursued the work of the Stiglitz–Sen–Fitoussi Commission (Stiglitz et al., Reference Stiglitz, Fitoussi, Durand, Stiglitz, Fitoussi and Durand2018) – shows that the distinction between ‘happiness’ and ‘life satisfaction’ is much more fundamental than is acknowledged by Frijters et al.
III
This (lack of) distinction between happiness and life satisfaction is, however, not central to the scope of the article by Frijters et al. Rather, their ambition is to propose a general approach where subjective wellbeing metrics should play the central role in policy decisions. The key elements of Frijters et al.’s approach to policy are described in fourth, fifth and sixth sections of their article. The first step consists in identifying ‘wellbeing policy priorities’ (i.e., the factors that account for most of the difference between a country's average life satisfaction score relative to other countries).Footnote 3 The second step brings together the best evidence from research on the ‘believed effects of various policies and circumstances on its chosen metric of wellbeing’ (‘Estimates of key effects’ section). Table 1 in Frijters et al. (based on research findings gathered by the What Work Centre for Wellbeing in the UK) provides examples of the types of effects to be considered – ranging from the effects on average life satisfaction of a doubling of fear of crime in the neighbourhood, of the transition from being single to being married or of an increase in green space within 1 km from where people live. The third and final step is to assess the cost–effectiveness of policy proposals (‘Cost–effectiveness’ section), which the authors define as the ‘units of happiness’ delivered by each monetary unit of government spending. This is the most critical step, and the article describes it in more detail. In a nutshell (abstracting from complicating factors discussed by the authors), alternative policy proposals should first be ranked in terms of their effectiveness ‘in units of happiness’; budgetary funding (taken as given in the authors’ more simplified model) should then be allocated to those proposals with the highest ‘cost–effective’ score. Frijters et al. also discuss how this basic approach might be adjusted to account for differences in the impacts of various policies on the happiness of different population groups (which requires attributing wellbeing ‘weights’ to different individuals); for differences in the timing of the policy impacts that would materialize (here, the authors suggest that, in most applications, using ‘the pure time discount rate [of 1.5%] may suffice’); and for policy effects that also impact on both the length of life of those currently living and on changes in birth rates.
I have three main reservations regarding this approach, which puts policy decisions in an almost ‘automatic pilot mode’. First, while Frijters et al. describe (life satisfaction) effects as referring to ‘various policies and circumstances,’ all of the measured coefficients in their table 1 pertain to actual circumstances (e.g., being unemployed) rather than to different policies actually changing these circumstances. In other words, the approach only tells us that, for example, moving people from unemployment (or inactivity) to employment will increase their life satisfaction. It tells us nothing about how different sets of policies will differ in effectively achieving this objective, nor whether a particular set of policies may have undesired effects on other aspects of people's lives (e.g., work–life balance). The proposed ‘intervention logic’ is therefore limited when it comes to providing concrete guidance for policy decisions. It is not enough to focus on the size of subjective wellbeing effects; what is lacking in this approach is mapping out the precise ways in which different policies and programmes impact on the ‘circumstances’ targeted by policies. While we may have some knowledge of how policies can change some circumstances of people's lives included in the authors’ table 1 (e.g., unemployment), that knowledge is much more limited in the case of other circumstances (e.g., personal relations, or even health status). This is compounded by the fact that, in most cases, we lack the research and intermediate metrics needed to cope with the challenge of attribution (i.e., how to distinguish between a change in, say, people's health status due to a change in policies rather than in broader societal conditions).
My second reservation is of a methodological nature. The ‘various policies and circumstances’ included in their table 1 do not represent the full range of possible drivers affecting life satisfaction: they are de facto limited to the variables included in existing surveys. For example, the reason given by Frijters et al. for the very different ‘policy conclusions’ in their figure 2 and figure 3 is all about national versus international variation. While this may be a factor, another critically important factor is that the source for their figure 2 is the British Household Panel Survey and the source for their figure 3 is the Gallup World Poll. These two surveys include very different covariates of very different quality for very different samples. So, the reason why diagnosed depression does not feature in their figure 3, for instance, is not because it turns out to be insignificant in the analysis of the Gallup World Poll: it is simply because it is absent from that survey, and thus from the analysis. In other words, you cannot compare coefficients from different analyses that include wildly different covariates. In addition, coefficients from a regression where the independent variables are strongly correlated (e.g., income, employment, health, education) can produce misleading results. The small effect of higher compulsory education in increasing people's life satisfaction reported in their table 1 is a case in point. Taken at face value, a small coefficient on education would, according to the approach proposed by Frijters et al., imply that little or no public money should be spent to fund compulsory education, when in fact the positive effects of education on life satisfaction are typically mediated by other factors such as employment, income and health (which are all strongly contingent on education). Including them all into the same regression model may yield some counterintuitive results.
My third reservation regarding the ‘happiness approach’ to policy proposed by Frijters et al. relates to the longstanding opposition between ‘utilitarians’ and other philosophical approaches to social justice and the ‘good life’. While I agree with Frijters et al.’s assessment that subjective wellbeing data bring information on people's lives that goes beyond that provided by more conventional measures, the reverse is also true (i.e., objective measures, such as income, health, skills, housing, safety, etc., can provide valuable information on aspects that are intrinsically important to people in ways that subjective wellbeing measures do not). This is most obvious when considering conditions that affect the sustainability of wellbeing outcomes. Take the case of greenhouse gas emissions, whose effects will play out over many years. Greenhouse gas emissions are not included in their table 1 and are therefore excluded from the ranking exercise proposed in Frijters et al. Should we therefore conclude that climate change does not matter to people? Similarly, assuming that the small coefficient on education is not biased, compulsory education is typically considered by policy-makers of all political leanings as a ‘merit good’ that societies should provide whether or not being in school increases one's subjective wellbeing.
The same consideration also applies to inequalities. One approach suggested by Frijters et al. is ‘to ask the population what they think about the weights’ to be attributed to people in different circumstances, possibly complemented with ‘sensitivity analysis to see what difference (if any) is made when comparing mutually exclusive project options.’ But what if the majority of the population decided to give no weight to the wellbeing of the worst-off (or to those living in poor countries)? Again, we confront normative judgements where utilitarian calculus and ‘happiness accounting’ do not bring much light.
IV
My experience with policy practice is that no OECD country has used life satisfaction in a way that resembles the approach put forward by Frijters et al. Indeed, policy-makers do not set ‘wellbeing policy priorities’ on the basis of subjective wellbeing regressions, and the main tool to support their decisions is not a regularly updated ‘list of believed effects of various policies and circumstances on its chosen metric of wellbeing.’ Relying on regression analysis such as the one proposed by Frijters et al. for policy decision-making will not be very attractive to ministers or the public. The approach is too opaque and technical, and not sufficiently anchored into a public debate about what matters for people and society.
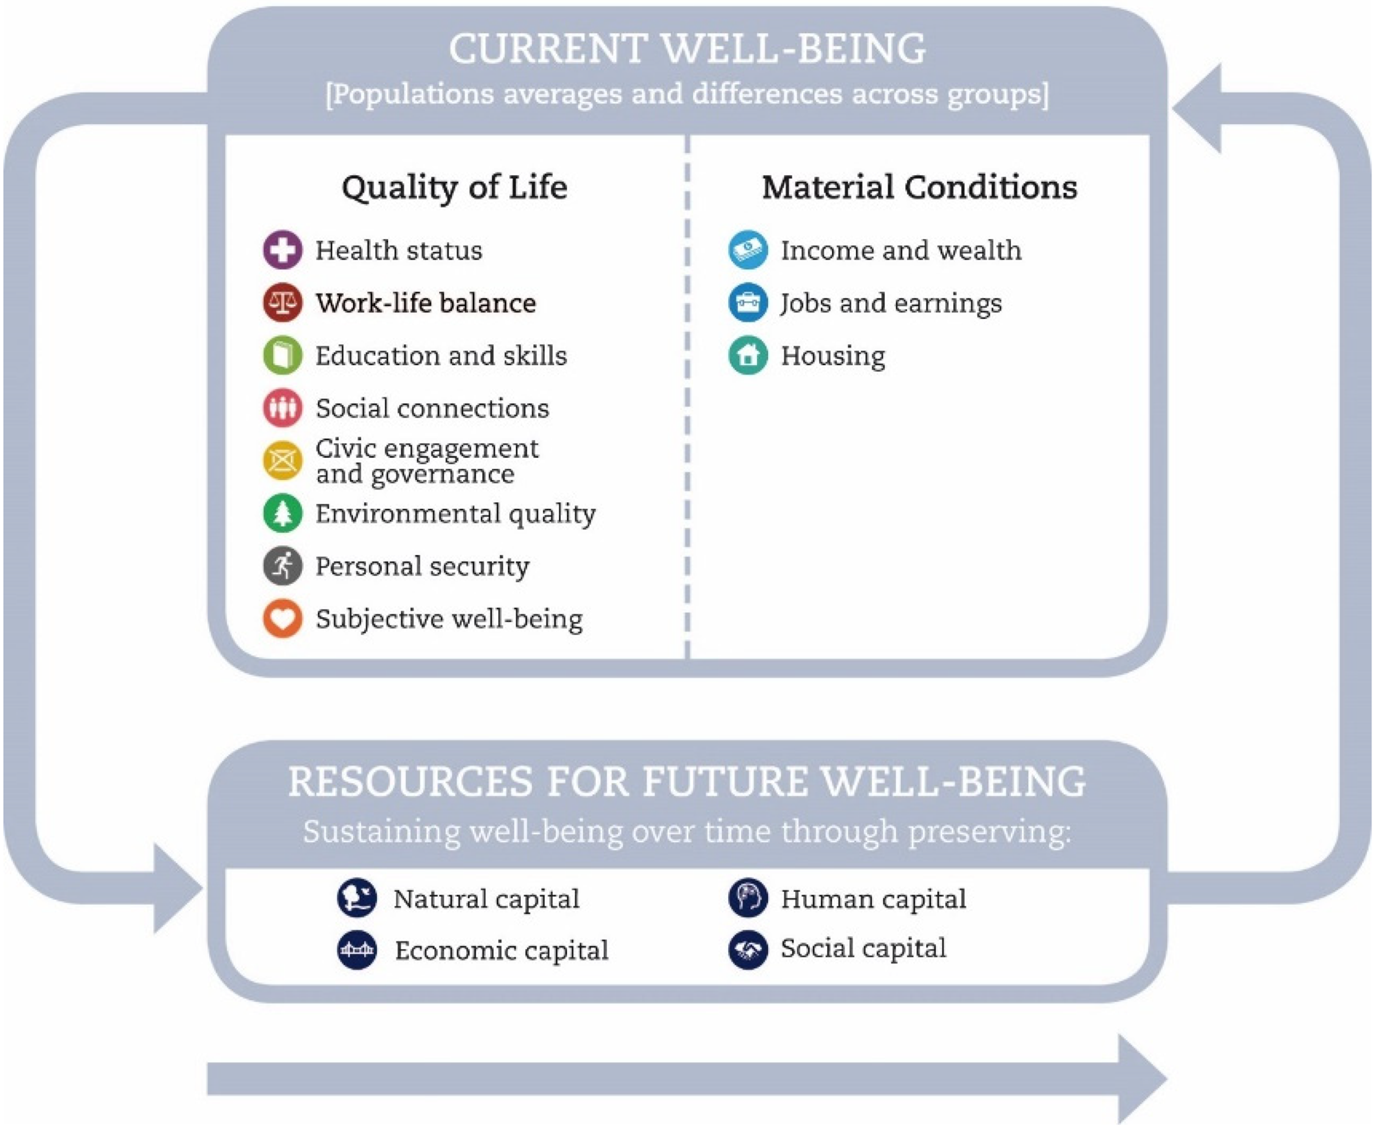
What I have observed instead are discussions in OECD countries on the many ingredients of a good life and on the characteristics of a well-functioning society, which have often taken the form of wide public consultations in order to reach agreement on what aspects of life matter most to people (Exton & Shinwell, Reference Exton and Shinwell2018). Inspired by these national initiatives as well as by the recommendations in the 2009 Stiglitz–Sen–Fitoussi report (Stiglitz et al., Reference Stiglitz, Sen and Fitoussi2010), the OECD has developed a multi-dimensional wellbeing ‘framework’ (Figure 1), and it has been reporting on countries’ wellbeing performance according to this framework since 2011 (OECD, 2017). Subjective wellbeing features as one dimension among other objective dimensions of people's lives in the OECD framework. The underlying logic is that while subjective wellbeing is affected by a range of circumstances (such as health status, skills, freedom to make choices or political voice), it does not follow that the intrinsic importance of these aspects can be derived simply by looking at the size of coefficients from a subjective wellbeing regression (the argument made by Frijters et al. in ‘Measurement and validity of wellbeing’ section).
The OECD wellbeing framework.

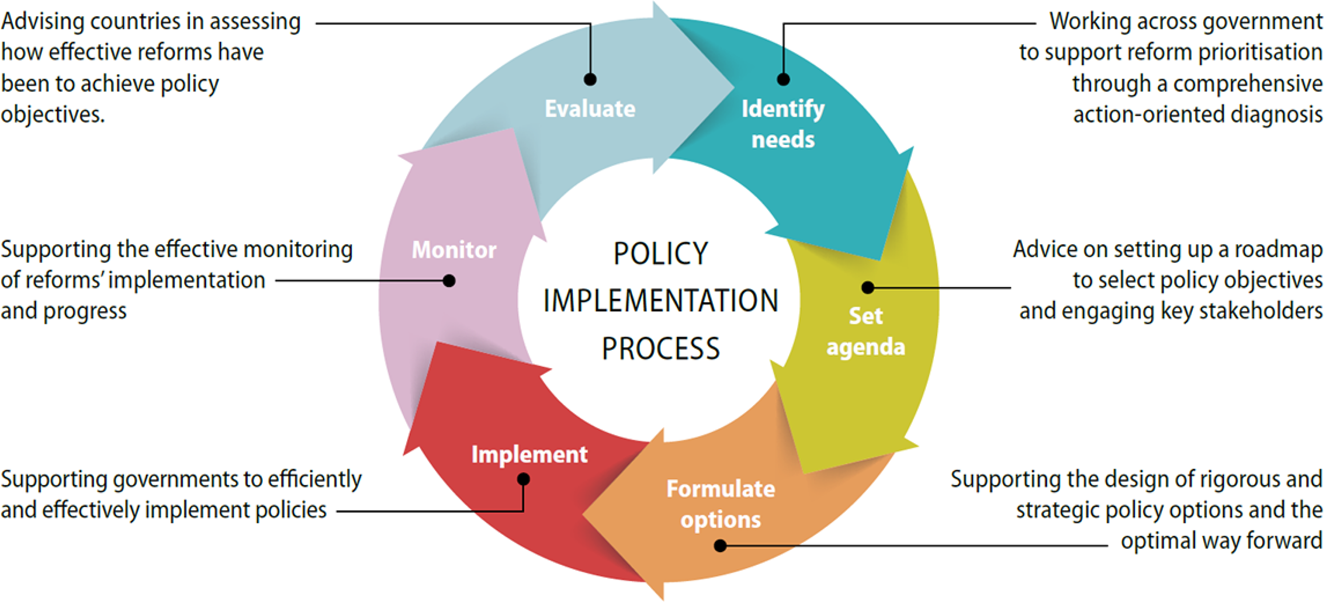
Several countries, within the OECD and beyond, have been using a dashboard of mostly objective wellbeing metrics at different stages of their policy cycles. Experiences range from identifying cross-cutting priorities for government actions (within the horizon of a given legislature or beyond) using an indicator set-based assessment of countries’ strengths and weaknesses; to defining a roadmap and setting milestones for government initiatives; to assessing the benefits and costs of various policy options and strategies to achieve these objectives; to assisting in the implementation of these policies as they are implemented; to monitoring progress and adjusting actions accordingly; and, finally, to assessing ex post the effects of government actions so as to inform future initiatives (Figure 2). While subjective wellbeing measures may play a role in each of these stages of the policy cycle, no country has used them as the single yardstick, as Frijters et al. seem to argue, and in any event none have done so according to their proposed methodology.
Use of dashboards of wellbeing indicators in the policy cycle.

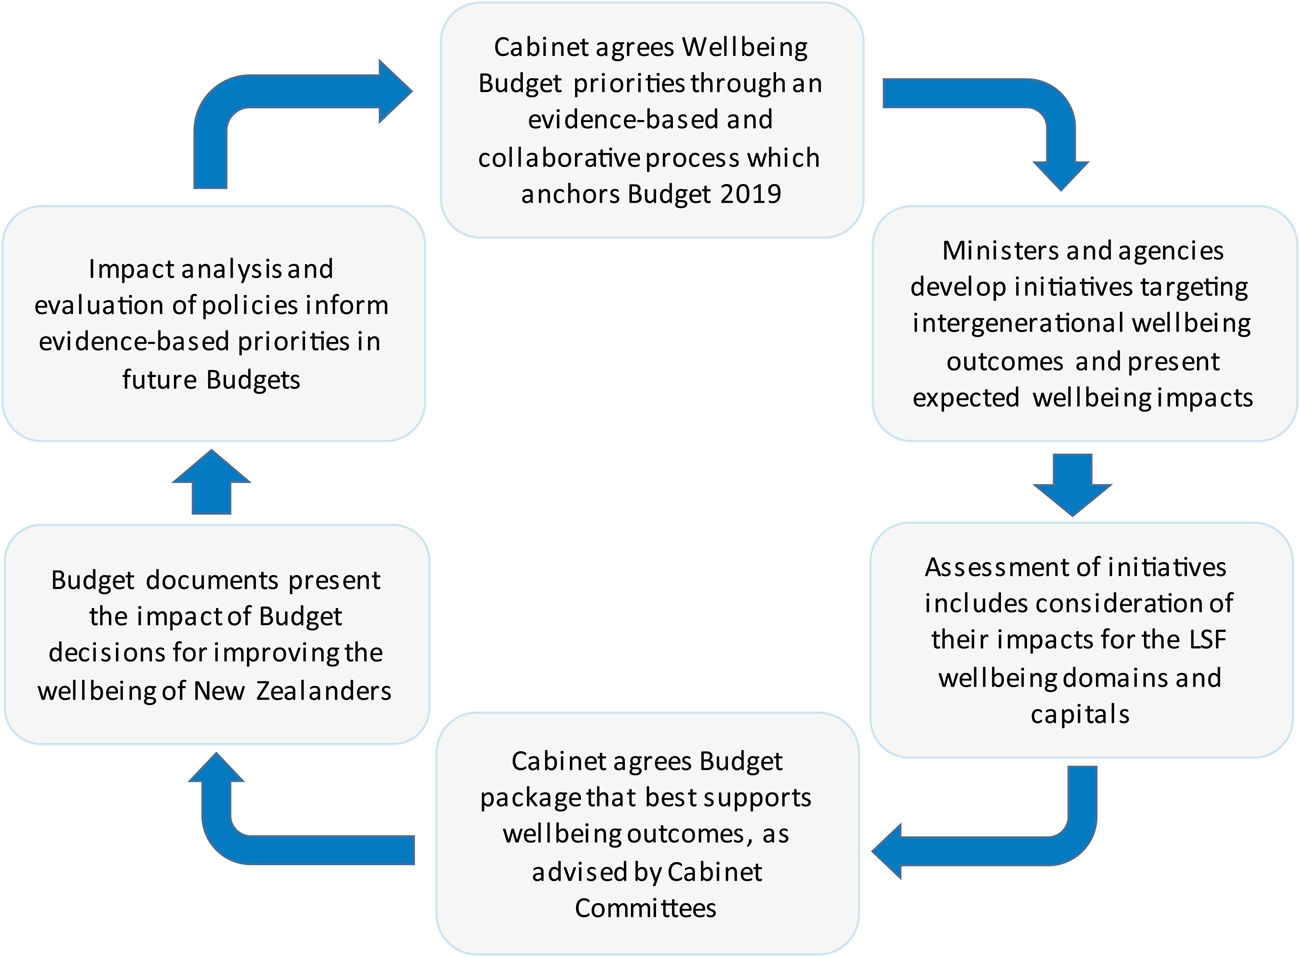
One recent prominent example of the use of a dashboard of indicators in policy is New Zealand. The New Zealand government used the evidence embedded in the Treasury's new Living Standards Framework Dashboard to identify five whole-of-government priorities for its 2019 ‘Wellbeing Budget’ (Figure 3), while also adapting its cost–benefit analysis template for departmental submissions of spending proposals to explicitly include wellbeing considerations (OECD, 2019).Footnote 4 New Zealand's and a few other countries’ experiences in policy uses of wellbeing metrics are relatively new, and not all of them have been equally successful. They illustrate that it is possible to use a dashboard of (mainly objective) wellbeing measures in policies, but in ways that differ from the one envisaged by Frijters et al.
New Zealand's 2019 Wellbeing Budget process.

V
Overall, while agreeing with Frijters et al. on many points, I do not agree with the idea that subjective wellbeing (whether defined as happiness or life satisfaction) should be the sole criterion on which to base policies. This is both because many other aspects are intrinsically important to people (beyond their instrumental value in improving people's life satisfaction) and because issues bearing on the functioning of societies, such as inequalities and sustainability, raise normative issues that utilitarian calculus does not help to address. While these considerations imply that we should not pursue the ambition of having a single metric (subjective wellbeing or other) to design policies, dashboards of wellbeing indicators (both objective and subjective) can usefully be used to inform decisions at different stages of the policy cycle. While we are still far from knowing ‘what works best’ in wellbeing policies, countries can and should learn from each other. The OECD is well placed to act as the hub for sharing these experiences.