


Introduction
The White-naped Crane Antigone vipio is globally and regionally classified as ‘Vulnerable’ by the International Union for Conservation of Nature (IUCN) (Birdlife International 2018; Gombobaatar and Monks Reference Gombobaatar, Monks, Seidler, Sumiya, Tseveenmyadag and Bayarkhuu2011), with global populations estimated to be between 6,250 and 6,750 (BirdLife International 2022).
There are two separate biogeographical populations of this species (Meine and Archibald Reference Meine and Archibald1996): the western and eastern populations. The western population breeds predominantly in eastern Mongolia, north-eastern China, and the Daurian regions of south-eastern Russia, and winters at Poyang Lake, China (Fujita et al. Reference Fujita, Hong‐Liang, Ueta, Goroshko, Krever and Ozaki2004; Lang et al. Reference Lang, Gankhuyag, Oyunchimeg, Dashdorj, Baasansuren and Amarkhuu2020; Nyambayar et al. Reference Nyambayar, Kunpeng, Zh, Tseveenmyadag, Iderbat and Lei2021, Yifei et al. Reference Yifei, Yunzhu, Jiao, Jia, Cai and Zh2021). The eastern population breeds in Russia along the Amur, Argun, and Ussuri rivers, as well as the Muraviovka, Khinganski, and Khankaiski state nature reserves and winters on the Korean Peninsula, Izumi, and Kyushu, Japan (Higuchi et al. Reference Higuchi, Ozaki, Fijita, Minton, Ueta and Soma1996, Reference Higuchi, Pierre, Krever, Andronov, Fujita and Ozaki2004). The eastern population is currently thought to be increasing, whereas the western population is declining (Haraguchi Reference Haraguchi2014a, Reference Haraguchi and Conservancyb, Reference Haraguchi2022; Harris and Mirande Reference Harris and Mirande2013; Lee Reference Lee2022). The western population has decreased sharply from 3,000–4,000 individuals in 2001–2002 to 1,000–1,500 individuals in 2005–2014 (BirdLife International 2022; Li et al. Reference Li, Wu, Harris and Burnham2012).
The changes in the western and eastern populations may be related to rainfall patterns on the breeding grounds, which are distinctly different in the western and eastern parts of the range (Simonov and Dahmer Reference Simonov and Dahmer2008). East Asia exhibits a strong gradient of declining rainfall from east to west (Simonov et al. Reference Simonov, Goroshko, Egidarev, Kiriliuk, Kiriliuk and Kochneva2013). The western regions have erratic rainfall and tend to experience cycles of drought and wet conditions, with cycles spanning approximately 25–40 years, particularly in the Daurian steppe where the borders of Mongolia, Russia, and China meet (Simonov et al. Reference Simonov, Goroshko, Egidarev, Kiriliuk, Kiriliuk and Kochneva2013).
Mongolia provides a suitable habitat for the western population of this species (Meine and Archibald Reference Meine and Archibald1996; Mirande and Harris Reference Mirande and Harris2019). Mongolia, including the Ulz River in the north-eastern part of the country, is an important breeding, moulting, and summering area for this species (Bradter et al. Reference Bradter, Gombobaatar, Uuganbayar, Grazia and Exo2005, Reference Bradter, Gombobaatar, Uuganbayar, Grazia and Exo2007; Fujita et al. Reference Fujita, Harris, Bold, Tseveenmyadag, Chuluunbaatar, Higuchi and Minton1994; Gilbert et al. Reference Gilbert, Bayarbaatar, Fine, Jambal and Strindberg2016; Gombobaatar Reference Gombobaatar, Pegdal and Enkh-Amgalan2002a, Reference Gombobaatarb; Goroshko and Tseveenmyadag Reference Goroshko, Tseveenmyadag, Kurochkin and Rakchimov2001, Reference Goroshko and Tseveenmyadag2002).
Bradter et al. (Reference Bradter, Gombobaatar, Uuganbayar, Grazia and Exo2005, Reference Bradter, Gombobaatar, Uuganbayar, Grazia and Exo2007) and Gilbert et al. (Reference Gilbert, Bayarbaatar, Fine, Jambal and Strindberg2016) conducted surveys on the White-naped Crane population in the Ulz River basin. In addition, Bradter et al. (Reference Bradter, Gombobaatar, Uuganbayar, Grazia and Exo2005, Reference Bradter, Gombobaatar, Uuganbayar, Grazia and Exo2007) studied habitat and nest-site selection, reproduction, and home ranges while Gilbert et al. (Reference Gilbert, Bayarbaatar, Fine, Jambal and Strindberg2016) studied White-naped Crane detectability and distribution in relation to villages and habitat quality. A large number of White-naped Crane (42 pairs) was recorded at high densities within the Ulz River basin in the Daurian region during the surveys conducted in 2001 (Bradter et al. Reference Bradter, Gombobaatar, Uuganbayar, Grazia and Exo2005). The same surveys were conducted along the river a decade later (2010 and 2011) and showed a decline in the number of pairs (Gilbert et al. Reference Gilbert, Bayarbaatar, Fine, Jambal and Strindberg2016). These survey results indicated the importance of monitoring the factors that could affect populations of White-naped Crane.
This study provides a 20-year update since the first survey of White-naped Cranes along the Ulz River using monitoring data from three years. Specifically, (1) we report the number of territorial pairs and the number of pairs successfully raising young close to fledging for the years 2019–2021, (2) in line with Gilbert et al. (Reference Gilbert, Bayarbaatar, Fine, Jambal and Strindberg2016), we used the Normalised Difference Vegetation Index (NDVI) as a proxy for White-naped Crane habitat quality and analysed NDVI change between the years 2019 and 2021, and (3) we repeated the analysis by Gilbert et al. (Reference Gilbert, Bayarbaatar, Fine, Jambal and Strindberg2016) on White-naped Crane detectability and distribution in relation to NDVI and villages.
Methods
Study area
The study area covered 300 km of the Ulz River and the nearby lakes between the Khentii and Dornod provinces in north-eastern Mongolia (Figure 1). The Ulz River is a key breeding area for White-naped Cranes (Meine and Archibald Reference Meine and Archibald1996). It originates from the Ikh and Baga Burd springs in the Norovlin village territory of Khentii Province and travels through Khentii and Dornod provinces to the north-east, reaching the Barun Torey of Torey Lake in Russia (Ulz River Basin IWRM Plan 2013). The Ulz River basin is mostly open with willow Salix spp. shrub and wetland vegetation (Bradter et al. Reference Bradter, Gombobaatar, Uuganbayar, Grazia and Exo2005; Gilbert et al. Reference Gilbert, Bayarbaatar, Fine, Jambal and Strindberg2016).
The study area along the Ulz River, covering part B of the Mongol Daguur Strictly Protected Area (SPA) and parts of the Ugtam Nature Reserve.

Figure 1. Long description
A topographical map with a coordinate grid from 112 degrees East to 116 degrees East and 48 degrees North to 50 degrees North.
Legend in the top-left:
- Purple triangles: T P s in 2021.
- Green squares: T P s in 2020.
- Red circles: T P s in 2019.
- Black pentagons: Soum center.
- Blue line: River.
- Light blue area: Lake.
- Blue diagonal hatching: Strictly Protected Area.
- Brown diagonal hatching: Nature Reserve.
- Grey line: Province Boundary.
Spatial Features:
The Ulz River flows from the Southwest at the Head of Ulz River nature reserve toward the Northeast. A dashed rectangular boundary labeled Study area encloses the river's path. Along this path, TP data points are clustered near Soum centers including Norovlin, Bayan-Uul, and Dashbalbar. In the Northeast, the river passes through the Ugtam nature reserve and the Mongol daguur /B/ Strictly Protected Area. The map is divided between Khentii province in the West and Dornod province in the East.
Inset Map:
A small map in the bottom-right shows Mongolia's position between Russia to the North and China to the South, with a red box highlighting the study area in the Northeastern corner of the country. A scale bar at the bottom-left indicates 0 to 100 kilometers.
The Ulz River passes through Part B of the Mongol Daguur Strictly Protected Area (SPA) and parts of the Ugtam Nature Reserve. The Mongol Daguur is also designated as an Important Bird and Biodiversity Area (IBA) (Nyambayar and Tseveenmyadag Reference Nyambayar and Tseveenmyadag2009), north-east Asian Crane Network Site, UNESCO World Heritage Site, Biosphere Reserve, and Daurian International Protected Area (Buuveibaatar et al. Reference Buuveibaatar, Smith, Edwards and Ochirkhuyag2014).
Field observation along the Ulz River
The surveys were conducted for a period of 10 days: 2–12 July 2019; 3–13 August 2020, and 18–28 July 2021. During this time, the chicks were tall enough to be relatively easily detectable in tall grass and reeds. Similarly to Bradter et al. (Reference Bradter, Gombobaatar, Uuganbayar, Grazia and Exo2005) and Gilbert et al. (Reference Gilbert, Bayarbaatar, Fine, Jambal and Strindberg2016), we used point-transect methodology and located observation points at 5 km intervals along the Ulz River basin to ensure full comparability with these earlier studies. At each point, we recorded all White-naped Crane detected and classified them as territorial pairs, successful breeding pairs (SBP) or non-paired cranes.
Cranes were classified as a territorial pair if evidence of breeding activity was found (incubation or the presence of one or more chicks) or they were recorded in the same location as the previous year (Erdenechimeg et al. Reference Erdenechimeg, Purev-Ochir, Gungaa, Terbish, Zhao and Guo2023; Haase et al. Reference Haase, Höltje, Blahy, Bridge, Henne and Johansson2019). Although systematic point-transect surveys along the Ulz River began in 2019, we also have observational records from 2018 collected during fieldwork in the same area. These earlier observations were not collected systematically, but they were sufficient to confirm the locations of several territorial pairs that reoccupied the same sites in 2019. Therefore, the criterion ‘recorded in the same location as last year’ could still be applied in 2019, and the number of territorial pairs for that year is unlikely to be underestimated. SBP are a subset of the territorial pair, consisting of those cranes for which we found evidence of breeding activity. In contrast to our shorter surveys during the late breeding season of White-naped Cranes, the earlier surveys by Bradter et al. (Reference Bradter, Gombobaatar, Uuganbayar, Grazia and Exo2005) and Gilbert et al. (Reference Gilbert, Bayarbaatar, Fine, Jambal and Strindberg2016) covered a longer period from the early to the late breeding season (May–July/August). Thus, their number of breeding pairs includes pairs that may have lost their eggs or chicks earlier in the season. By contrast, we report only those pairs that still had chicks late in the season (SBP). Late season surveys also carry the potential risk that unsuccessful pairs may already have left their territories, and hence the number of territorial pairs may be underestimated. For example, Bradter et al. (Reference Bradter, Gombobaatar, Uuganbayar, Grazia and Exo2005) reported that pairs in some drier areas abandoned their territories without a breeding attempt. Our own observations indicated that after a failed breeding attempt, White-naped Crane regularly remained in their territory.
Observations, using binoculars (10×42 mm) and telescopes (20×60 mm), were conducted from the nearest elevated places, within a maximum of approximately 800 m of the pre-selected points along the Ulz River basin.
Two or more observers used binoculars and telescopes to scan for cranes at each observation point and recorded the bearing and estimated distance of each crane observed. Observation periods per point were approximately 10–40 minutes.
A small number of observation points were excluded due to unsuitable habitat and absence of observation data. Specifically, four transect points along a 20 km stretch in the western part of Dashbalbar village and two points near Bayan-Uul village were avoided because these areas lacked suitable crane habitat. In addition, in the western part of Dashbalbar village and within 5 km of Bayan-Uul village along the river, observation points were not recorded; therefore, NDVI values were omitted for these areas.
Data analysis
Recruitment
‘Recruitment’ was estimated as described by Bradter et al. (Reference Bradter, Gombobaatar, Uuganbayar, Grazia and Exo2005) and Gilbert et al. (Reference Gilbert, Bayarbaatar, Fine, Jambal and Strindberg2016). This was determined by the following formula:

where R denotes recruitment, FJ denotes the number of juveniles fledged, and TP denotes territorial pairs including breeding pairs.
Factors influencing the distribution of White-naped Crane along the Ulz River
Gilbert et al. (Reference Gilbert, Bayarbaatar, Fine, Jambal and Strindberg2016) developed a habitat model along the Ulz River transecting the approximately 270 km long area of interest into 5×5 km blocks. Due to our point-transect length, the habitat model was based on 59 blocks (300 km). The NDVI data acquired by the Moderate Resolution Imaging Spectro-radiometer (MODIS) on board the TERRA satellite (Weier and Herring Reference Weier and Herring2000) were used to estimate a proxy habitat quality or wetness. Similar methods used in Gilbert et al. (Reference Gilbert, Bayarbaatar, Fine, Jambal and Strindberg2016) studies were pursued whereby data were collected for 16 days (25 May to 9 June) from 2019 to 2021. We used NDVI composites at 250 m resolution from Level-1 and Atmosphere Archive & Distribution System Distributed Active Archive Center (https://ladsweb.modaps.eosdis.nasa.gov) and re-projected the data to Transverse Mercator (UTM zone 49 N). The mean scaled NDVI value for each 5×5 km block was calculated using the spatial analysis tool in ArcMap 10.8. Following the standard MODIS product format, NDVI values were provided as scaled integers, with true NDVI value (ranging from -1 to +1) multiplied by 10,000 to facilitate efficient data storage and processing. All analyses were therefore conducted using these scaled NDVI values, which ranged from approximately 2,000 to 4,200 in our study area (corresponding to true NDVI values between 0.2 and 0.42). NDVI values in this scaled format were considered to ensure comparability with the results of Gilbert et al. (Reference Gilbert, Bayarbaatar, Fine, Jambal and Strindberg2016).
Analysis of Variance (ANOVA) was used to compare differences in habitat quality or wetness (indexed as NDVI) between 2019, 2020, and 2021 in R (R Core Team 2020).
To investigate factors influencing White-naped Crane distribution, a Generalised Linear Model (GLM) with a binomial error distribution was applied using the lme4 package in R. The response variable was the presence or absence of territorial pairs within each block. Explanatory variables included the mean NDVI and distance to the nearest village (Norovlin, Bayan-Uul or Dashbalbar). The year (2019, 2020, 2021) was included as a fixed factor to account for potential interannual differences in habitat quality and White-naped Crane occurrence.
To evaluate whether the spatial distribution of White-naped Cranes was random, clustered or dispersed, we calculated Moran’s I using presence–absence data for each year. Moran’s I values range from -1 (perfect dispersion) to +1 (perfect clustering), with values near zero indicating a random distribution (Cliff and Ord Reference Cliff and Ord1981). After fitting the GLM, we also calculated Moran’s I on the residuals to assess potential residual spatial autocorrelation, which could indicate unaccounted-for spatial structure and an increased risk of Type I error (Dormann et al. Reference Dormann, McPherson, Araújo, Bivand, Bolliger and Carl2007).
The Area Under the Curve (AUC) was calculated by comparing the fitted values from the final model to the observed White-naped Crane presence–absence data within the same data set. No independent validation data were withheld; thus, AUC values in this study reflect the model’s ability to classify presences and absences within the sampled locations, rather than predictive performance. Given that our fixed effects explained limited variation, AUC values should be interpreted with caution, as high AUC values in this context are more likely driven by spatial clustering and site fidelity of White-naped Cranes rather than model explanatory power alone (Fielding and Bell Reference Fielding and Bell1997).
Weather data
Daily meteorological measurements from May to August for the period 2000–2021 were obtained from two open-access data sources: NASA’s Prediction of Worldwide Energy Resources (https://power.larc.nasa.gov) and Climate Engine (https://app.climateengine.com). For each data set, monthly precipitation values (mm/month) were extracted from eight locations along the Ulz River. Monthly values for May–August were then summed to generate a seasonal precipitation total (mm) for each year. Seasonal totals from the two data sources were plotted together for comparison. To visualise long-term trends and interannual variability, we fitted both a linear regression trendline and a Locally Weighted Scatterplot Smoothing (LOESS) curve (span = 0.4) to the seasonal precipitation data.
Results
Population of White-naped Crane along the Ulz River
During our surveys from 2019 to 2021, we recorded White-naped Cranes from 53 transect points along the Ulz River and nearby lakes, including Tsagaan, Kholboo, Turgenii tsagaan, and Chukh.
In 270 km along the Ulz River (in the same area as the 2001 and 2011 surveys), we recorded 16 territorial pairs (including 4 SBP) in 2019, 22 territorial pairs (including 8 SBP) in 2020, and 21 territorial pairs (including 12 SBP) in 2021, respectively.
In 2019, 27 territorial pairs were recorded in 300 km along the river basin, of which 22.2% (n = 6) were confirmed to be SBP (Table 1). A single late breeding pair was recorded in 2019, however no late breeding pairs were observed along the Ulz River from 2020 to 2021. The recruitment rate was 11.4%. The mean density of territorial pairs was 0.9/10 km; the highest density of territorial pairs was 5/10 km in the western part of the survey area (northern part of the village centre and Nangi mountain, Norovlin village). The highest density of SBP was 2/10 km in Kholboo Lake, Bayan-Uul village, and Chukh Lake, Dashbalbar village.
Summary of Ulz River point-transect surveys

Table 1. Long description
The table is organized into seven columns of data under three main study headers.
1. Bradter et al. 2005 (Two columns for 2001):
- Territorial pair: 36 and 42.
- Breeding pair: 31 and not recorded.
- Successful breeding pair: 14–16 and not recorded.
- Number of chicks from breeding pairs: 18–22 and not recorded.
- Recruitment percent: 20–23 and 18–22.
- Fledging success percent: 45–52 and not recorded.
2. Gilbert et al. 2016 (Years 2010 and 2011):
- Territorial pair: 10 and 17.
- Breeding pair: 7 and 3.
- Late breeding pair: 1 and 0.
- Successful breeding pair: 7 and 3.
- Number of chicks from breeding pairs: 12 and 4.
- Number of chicks from late breeding pairs: 2 and 0.
- Recruitment percent: 37.5 and 10.5.
- Fledging success percent: 100 and 100.
3. Our study (Years 2019, 2020, and 2021):
- Territorial pair: 27, 28, and 30.
- Late breeding pair: 1, 0, and 0.
- Successful breeding pair: 6, 11, and 18.
- Number of chicks from breeding pairs: 6, 17, and 28.
- Number of chicks from late breeding pairs: 1, 0, and 0.
- Recruitment percent: 11.4, 23.2, and 31.8.
- Total individuals: 64, 113, and 132.
Rows for Breeding pair and Fledging success percent were not recorded in the current study.
Bradter et al. (Reference Bradter, Gombobaatar, Uuganbayar, Grazia and Exo2005) provided the number of territorial pairs and recruitment for the whole study area of 270 km of river basin plus the Galuut Lake (right column) and additional results for a subset of the study area, the eastern 255 km of river basin plus the Galuut Lake (left column). Maximum numbers for breeding success are based on all young alive at the end of the study period. Minimum numbers for breeding success are based only on young that had fledged at the end of the study period, thus excluding unfledged young. Fledged and unfledged young at the end of the study period were not recorded separately in our study, hence estimates of breeding success correspond to the maximum numbers of Bradter et al. (Reference Bradter, Gombobaatar, Uuganbayar, Grazia and Exo2005).
-: Not recorded.
In 2020, 28 territorial pairs were detected in 300 km, of which 39.2% (n = 11) were SBP. The recruitment rate was 23.2%. The mean density of territorial pairs was 0.93/10 km, and the highest density of territorial pairs was 5/10 km. The highest density of SBP was 3/10 km in Kholboo Lake, Bayan-Uul village.
In 2021, 30 territorial pairs were detected, 60% (n = 18) of which were confirmed to be SBP. The recruitment rate was 31.8%. The mean density of territorial pairs was 1/10 km unit area, and the highest density of territorial pairs was 6/10 km unit area. In addition, the highest density of SBP was 4/10 km in the western (Nangi mountain, Norovlin village) and eastern (near Chukh Lake, Dashbalbar village) survey areas. The mean densities of SBP were 0.23–0.6/10 km from 2019 to 2021 along the Ulz River. During our 2020 and 2021 surveys, the number of SBP, sub-adult groups, and total number of White-naped Cranes was higher than that in the 2019 survey. The Ulz River, particularly the wetlands near Norovlin village, Kholboo Lake, Bayan-Uul village, and the Chukh Lake, Dashbalbar village were the most important breeding areas for White-naped Cranes.
The total number of individual White-naped Cranes recorded from the transects was approximately 64 in 2019, 113 in 2020, and 132 in 2021.
Based on the results of Bradter et al. (Reference Bradter, Gombobaatar, Uuganbayar, Grazia and Exo2005), Gilbert et al. (Reference Gilbert, Bayarbaatar, Fine, Jambal and Strindberg2016), and our three-year studies, the average number of territorial pairs of White-naped Crane was 25 and the average number of breeding pairs was 12.
Factors affecting the distribution of White-naped Cranes
Overall, White-naped Cranes were present in 26.4% of the surveyed blocks (14 of 53 sampled blocks) in 2019, 22.6% (12 of 53 sampled blocks) in 2020, and 32% (17 of 53 sampled blocks) in 2021 (Figure 2).
Number of White-naped Crane pairs (dark grey bars) and average scaled Normalised Difference Vegetation Index (NDVI) values (black line) per 25 km2 block along the Ulz River survey transects in 2019 (a), 2020 (b), and 2021 (c) in north-eastern Mongolia. Light grey bars indicate the location of villages along the survey transects and dashed bars indicate that near the two villages observation points were not collected thus NDVI values were omitted.

Figure 2. Long description
Three panels labeled a, b, and c arranged in a triangular layout. Each panel shares the same axes: the horizontal x-axis represents Position along transect (block number) from 0 to 300. The primary vertical y-axis on the left represents Number of crane pair from 0 to 5. The secondary vertical y-axis on the right represents N D V I value (non-normalized) from 0 to 7000.
* Panel a (2019): Dark grey bars showing crane pairs are concentrated between blocks 0 to 50, 80 to 100, 125 to 150, and 260 to 280. The black line for N D V I shows a slight upward trend from 3000 to 4000 before block 75, then a gradual decline from 4000 to 2000 across the remaining transect. Light grey vertical bars indicate villages near blocks 75 and 210. Dashed bars indicating missing data are located around blocks 200 to 230.
* Panel b (2020): Crane pair bars are sparse, with peaks at blocks 10, 25, 85, and 240. The N D V I line remains relatively stable between 3000 and 4000, showing more frequent small fluctuations compared to 2019. Data gaps exist at the same village and dashed-bar locations.
* Panel c (2021): Crane pair bars show a high peak of 5 at block 85 and a cluster between blocks 240 and 280. The N D V I line is the most stable of the three years, hovering consistently around the 4000 mark with a slight dip near block 130 and a final decline after block 280.
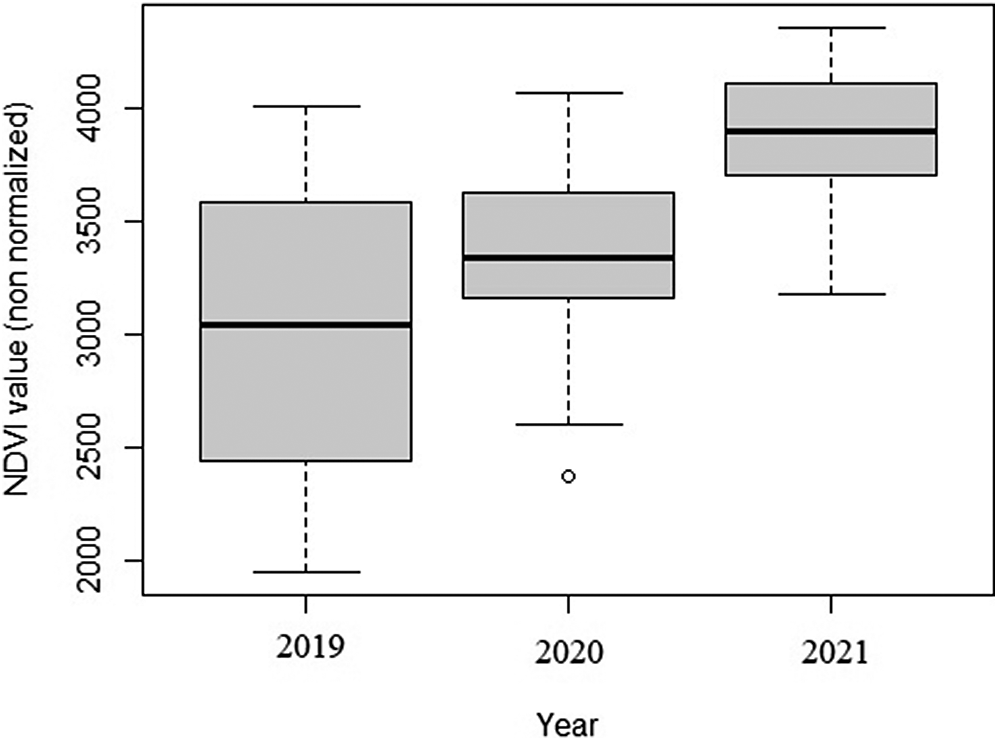
The average (± SD) NDVI values per survey block in 2019 (3,006 ± 636), 2020 (3,367 ± 371), and 2021 (3,886.29 ± 290) were significantly different (P <0.05) (Figure 3). The NDVI values for 2021 were significantly greater than for 2019 and 2020, indicating improved vegetation productivity in the most recent year.
Comparison of average Normalised Difference Vegetation Index (NDVI) values per 25 km2 survey block along the Ulz River in north-eastern Mongolia from 2019 to 2021.

Figure 3. Long description
The vertical y-axis is labeled N D V I value non normalized and ranges from 2000 to 4000 in increments of 500. The horizontal x-axis is labeled Year and includes three categories: 2019, 2020, and 2021.
* For 2019, the median N D V I is approximately 3100. The box extends from roughly 2400 to 3600, with whiskers reaching down to 1900 and up to 4000.
* For 2020, the median increases to approximately 3300. The box is narrower, ranging from 3200 to 3600. The upper whisker reaches 4100, while the lower whisker reaches 2600. A single outlier point is visible below the lower whisker at approximately 2400.
* For 2021, the median rises further to approximately 3900. The box ranges from 3700 to 4100, with whiskers extending from 3200 to 4300.
The overall trend shows a year-over-year increase in both the median and the minimum/maximum ranges of the vegetation index.
For the three years of pooled data, the GLM showed that the NDVI and distance to the nearest village location had no significant influence on White-naped Crane distribution (Table 2).
Parameter estimates of the Generalised Linear Model (GLM) for the distribution of White-naped Cranes along the Ulz River during 2019, 2020, and 2021 in north-eastern Mongolia

Table 2. Long description
The table contains seven columns: Coefficients, Estimate, S E, Z, P value, 95% C I (Lower), and 95% C I (Upper).
* Intercept: Estimate -3.1909, S E 0.9548, Z 3.3419, P value 0.0008, C I -5.4140 to 1.6045.
* Normalised Difference Vegetation Index (N D V I): Estimate 0.0007, S E 0.0003, Z 2.4677, P value 0.0136, C I 0.0002 to 0.0014.
* Distance to nearest village: Estimate 0.0004, S E 0.0032, Z -0.1395, P value 0.8891, C I -0.0069 to 0.0059.
* Year 2020: Estimate -0.4232, S E 0.4634, Z -0.9134, P value 0.3611, C I -1.3478 to 0.4816.
* Year 2021: Estimate -0.2790, S E 0.6138, Z -0.4545, P value 0.6494, C I -1.5307 to 0.8955.
Year 2019 serves as the baseline category for the temporal coefficients.
Year 2019 is the baseline category.
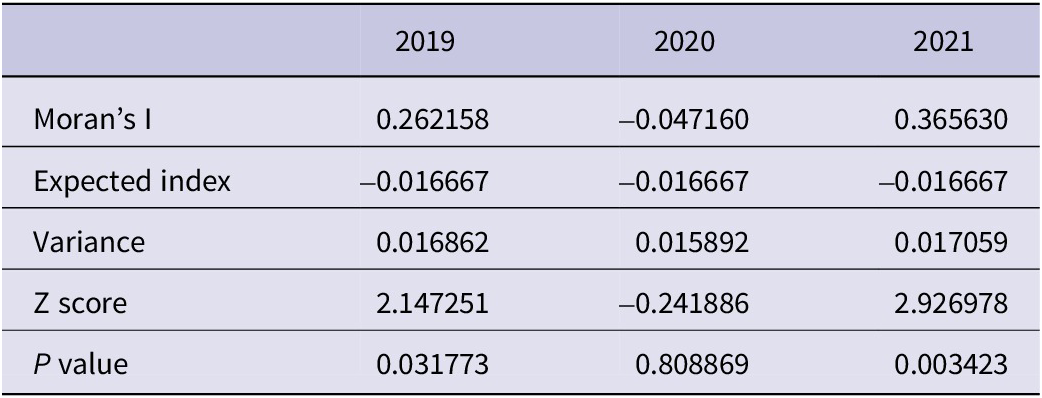
There was no indication of significant residual spatial autocorrelation in 2020. In contrast, the residuals of the final GLM for both 2019 and 2021 showed significant positive spatial autocorrelation, consistent with the clustered spatial distribution of White-naped Cranes observed in those years, as indicated by Moran’s I values (Table 3). The AUC for the final model was 0.71 in 2019, 0.96 in 2020, and 1.00 in 2021, suggesting that the model had good discriminatory ability despite the low explanatory power of the environmental predictors.
Moran’s I spatial autocorrelation of White-naped Cranes presence–absence data (2019–2021)
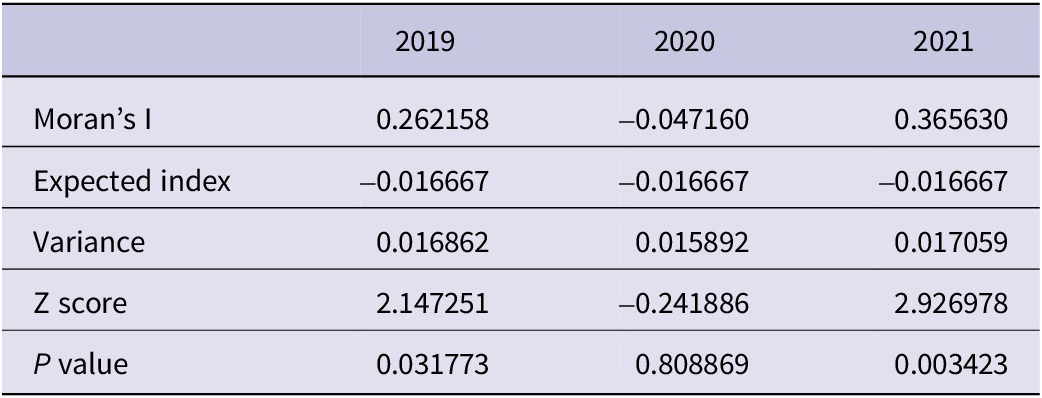
Table 3. Long description
The table consists of four columns: a label column and three year columns (2019, 2020, and 2021).
* Moran's I: 0.262158 in 2019, -0.047160 in 2020, and 0.365630 in 2021.
* Expected index: -0.016667 for all three years.
* Variance: 0.016862 in 2019, 0.015892 in 2020, and 0.017059 in 2021.
* Z score: 2.147251 in 2019, -0.241886 in 2020, and 2.926978 in 2021.
* P value: 0.031773 in 2019, 0.808869 in 2020, and 0.003423 in 2021.
Discussion
Along the Ulz River, Bradter et al. (Reference Bradter, Gombobaatar, Uuganbayar, Grazia and Exo2005) recorded a total of 42 territorial pairs in 2001, and Gilbert et al. (Reference Gilbert, Bayarbaatar, Fine, Jambal and Strindberg2016) recorded 17 territorial pairs.
The number of SBP recorded along the Ulz River during our 2019–2021 surveys was higher than the number of SBP recorded in the 2011 surveys.
The conservative number of 30 territorial pairs recorded along the Ulz River in 2021 was greater than the territorial pairs (17) recorded in 2011. However, it was lower than the 42 territorial pairs recorded in 2001. Thus, the number of territorial pairs recorded in 2011 was lower than that in the 2001 and 2021 surveys.
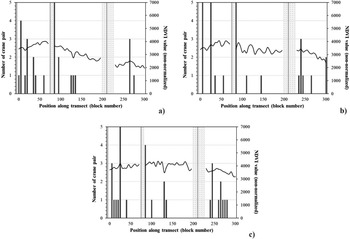
In addition, the distribution of breeding White-naped Cranes in 2010–2011 along the Ulz River was different from that in the 2001 and 2019–2021 surveys. During the 2001 survey, Bradter et al. (Reference Bradter, Gombobaatar, Uuganbayar, Grazia and Exo2005) found White-naped Crane breeding pairs in the eastern part of the Ulz River, including most of the Mongol Daguur SPA. However, Gilbert et al. (Reference Gilbert, Bayarbaatar, Fine, Jambal and Strindberg2016) did not find any breeding pairs in the Mongol Daguur SPA region between the Chukh and Duruu lakes. They observed poor habitat suitability along the Ulz River in 2011 as a result of the drought period (Figure 4). The drought period continued until 2018 along the Ulz River in north-eastern Mongolia (Tugjamba et al. Reference Tugjamba, Walkerden and Miller2021). During the 2019–2021 surveys, we observed that the distribution of breeding pairs with chicks in the Mongol Daguur SPA were similar to that in the 2001 survey.
Number of White-naped Crane pairs (dark grey bars) and average Normalised Difference Vegetation Index (NDVI) values (black line) per 25 km2 block along the Ulz River survey transects in 2001 (a), 2011 (b), and 2021 (c) in north-eastern Mongolia. Light grey bars indicate the location of nearby villages (villages) along the survey transects and dashed bars indicate that two villages were not observed thus NDVI values were not collected. Figures a and b are reproduced from Gilbert et al. (Reference Gilbert, Bayarbaatar, Fine, Jambal and Strindberg2016) in Bird Conservation International.

Figure 4. Long description
Three panels labeled a, b, and c arranged in two rows. Each panel shares the same axes: the x-axis represents Position along transect (block number) from 0 to 300. The primary y-axis on the left represents Number of crane pairs from 0 to 5. The secondary y-axis on the right represents N D V I value (non-normalized) from 0 to 7000.
* Panel a (2001): A black line showing N D V I values starts high at approximately 5000 and shows a gradual downward trend with fluctuations toward 4000. Dark grey bars representing crane pairs are scattered across the transect, with a notable cluster of 4 pairs near block 250. Three solid light grey vertical bars indicate village locations near blocks 60, 120, and 200.
* Panel b (2011): The N D V I line is lower than in 2001, fluctuating mostly between 3000 and 4000, with a sharp drop at the end of the transect. Dark grey bars are significantly fewer and shorter, with most values at 1 or 2 pairs. Village locations remain consistent with panel a.
* Panel c (2021): The N D V I line is relatively flat around 4000 but contains gaps. Dark grey bars show a slight recovery in density compared to 2011, including a peak of 5 pairs near block 25. This panel includes two dashed vertical bars near blocks 210 and 225 indicating missing data for villages, alongside one solid light grey bar near block 75.
Gilbert et al. (Reference Gilbert, Bayarbaatar, Fine, Jambal and Strindberg2016) estimated that the probability of White-naped Crane presence increased as vegetation productivity and distance from the villages increased. The White-naped Crane preferred to stay in areas with more vegetation and avoided areas close to villages. This result is directly related to the significant improvement of the habitats along the Ulz River. As the NDVI value increased in 2021 compared with the values in 2019 and 2020, this indicates that the crane habitat is improving due to increased rainfall and habitat conditions. The large area of wetlands located in the river near the villages created suitable habitats for White-naped Cranes, thereby contributing to the high density of cranes around the villages.
To formally investigate these relationships, we fitted a GLM using NDVI, distance to the nearest village, and year as predictors of White-naped Crane presence. Although the model showed positive associations with NDVI and negative associations with proximity to villages – consistent with patterns reported by Gilbert et al. (Reference Gilbert, Bayarbaatar, Fine, Jambal and Strindberg2016) – these effects were not statistically significant. This is likely due to limited statistical power, especially because areas nearest to villages were not sampled. The model’s limited explanatory power also reflects the complexity of White-naped Crane distribution, which is strongly influenced by long-term climate variability and habitat quality rather than single-season environmental conditions alone.
Bradter et al. (Reference Bradter, Gombobaatar, Uuganbayar, Grazia and Exo2005) described how in 2000 and 2001, the amount and extent of water-bodies in the eastern part of the study area was reduced compared with 1999. Gilbert et al. (Reference Gilbert, Bayarbaatar, Fine, Jambal and Strindberg2016) described exceptionally dry conditions in the eastern third of the study area with no water present in the river channel and several lakes. Also, according to our observation, Duruu Lake which is in the eastern part of the study area, was completely dry in 2017 and 2018. However, the wetland started recovering and Duruu Lake had water in 2019.
The variations in the territorial pairs of the White-naped Crane along the Ulz River might be dependent on the rainfall pattern as the low numbers of territorial pairs in 2010 and 2011 coincided with reduced rainfall and a period of drought (Figure 5). However, when the rainfall pattern commenced the number of territorial pairs along the river started to increase in 2019.
Seasonal precipitation (mm) from May to August along the Ulz River in north-eastern Mongolia 2000–2021, based on data from NASA (blue) and Climate Engine (yellow). Monthly precipitation (mm/month) values from both sources were summed to obtain seasonal totals. Dashed lines indicate linear trends and solid lines represent Locally Weighted Scatterplot Smoothing (LOESS) (span = 0.4).

Figure 5. Long description
The X-axis represents the Year from 2000 to 2021. The Y-axis represents Total seasonal precipitation in millimeters, ranging from 5.0 to 12.5.
Two data sources are plotted:
* NASA (teal): Shows higher variability and higher overall values. It starts near 5.0 in 2000, peaks significantly around 2012 (above 10.0) and 2020 (above 12.5), with a sharp trough in 2016 (near 4.0).
* Climate Engine (orange): Shows lower overall values and less volatility. It remains relatively flat between 4.0 and 5.0 until 2017, after which it rises sharply to nearly 11.0 by 2020.
Trend lines for both sources:
* Dashed lines indicate a linear increase for both datasets over the 21-year period.
* Solid lines represent L O E S S smoothing, showing a gradual upward curve that becomes more pronounced after 2015 for both sources.
Although Bradter et al. (Reference Bradter, Gombobaatar, Uuganbayar, Grazia and Exo2005) described 2001 as a dry year, the number of breeding pairs and territorial pairs was higher than in 2010 and 2011. Goroshko (Reference Goroshko and Harris2010) showed that 1990–1999 was a rainy period, thus 2000 and 2001 were the end of the rainy period and the beginning of the dry period, thereby explaining Bradter et al. (Reference Bradter, Gombobaatar, Uuganbayar, Grazia and Exo2005) observations. Thus, at the time of Bradter’s study in 2001, the number of breeding and territorial pairs in the Ulz River basin may have already been affected by drought (since numbers may have been even higher pre-2000), but not as severely as they would be subsequently.
According to studies by Goroshko (Reference Goroshko and Harris2010, Reference Goroshko2015), 100 breeding pairs of White-naped Crane were recorded in the Daurian region (south-east Transbaikalia) during the wet seasons of 1990–1999, while between 2000 and 2015 numbers decreased to 15 breeding pairs over the dry seasons, with the cranes concentrated in eastern areas. At this site, between 2019 and 2020 (wet years), 90 pairs were recorded, which is a significant increase from 2015 (Goroshko Reference Goroshko2021).
In addition, the Chinese wintering population of White-naped Crane is largely confined to Poyang Lake, where fluctuating numbers have declined from the mean maximum count of 2,278 between 1996 and 2004 to 1,167 in 2005–2012, and 600 in 2014 (Harris and Mirande Reference Harris and Mirande2013; Li et al. Reference Li, Wu, Harris and Burnham2012; Mirande and Harris Reference Mirande and Harris2019; Shao et al. Reference Shao, Jiang, Dai and Liao2014).
During the 2016–2020 censuses, 1,588–2,310 White-naped Crane wintered in Poyang Lake (Haifeng Reference Haifeng2018; Yuxi Reference Yuxi2021), confirming that the western population is increasing, as also found in some breeding areas such as those reported by Goroshko (Reference Goroshko2021) and in our study. The above population changes of White-naped Crane in the breeding area in the Daurian region and winter site in southern China show the sensitivity of the population to climatic changes.
In conclusion, the Daurian ecosystems (south-eastern Russia, north-eastern Mongolia, and China) are greatly affected by long-term climatic cycles (approximately 30 years) with intermittent wet and dry periods (Goroshko and Tseveenmyadag Reference Goroshko and Tseveenmyadag2002; Obyazov et al. Reference Obyazov, Kirilyuk and Kirilyuk2021). These cycles greatly affect the quantity of precipitation, condition of wetlands, and population characteristics of cranes and other waterbirds, including their numbers and distribution, mortality, and breeding success. During our surveys in mid-May 2019, one pair near our research camp at Chukh Lake did not nest until 16 May as the lake was dry due to a lack of rain. As soon as it rained, the lake filled with water, and the pair started to incubate. This observation clearly indicated that water is important for breeding pairs to nest. Bradter et al. (Reference Bradter, Gombobaatar, Uuganbayar, Grazia and Exo2005) also showed the importance of the presence of water for nesting.
We hypothesise that the number of nesting pairs will increase along the Ulz River basin if the rainy period continues for the next few years, and more than 40 pairs can be reached. The population changes of breeding White-naped Crane along the Ulz River basin can also be cyclical, following the cyclical climate system in the Daurian region.
In the context of estimated detection probabilities, the areas surveyed in this study are likely to support a large proportion of the western breeding population of White-naped Cranes. The repeated surveys over 20 years confirm the importance of rainfall in areas with shallow wetlands as breeding habitats for White-naped Cranes. Maintaining the productivity of breeding White-naped Cranes will depend heavily on the Ulz River basin wetland systems being managed properly, especially during the dry years. This challenge is compounded by herder families summering in the river valleys with large numbers of livestock during the dry years, which can slow the recovery of wetlands during rainy years and lead to the long-term deterioration of the ecosystem.
Acknowledgements
We would like to express our thanks to all contributing organisations, students, and colleagues for their help and support in conducting our field surveys along the Ulz River, including our field research team members and rangers, Batkhuu B, Ulziikhutag G, and Byambabatjil N from the Eastern Mongolian Protected Areas Administration (EMPAA), and driver Baljinnyam B from EMPAA; students Dulguun G and Enerel S from the National University of Mongolia; students Adiya O and Tergel A from the Mongolian State University of Education (MSUE), and our driver Amarbayasgalan A. Special thanks to Director Dashdorj Kh (EMPAA) for fieldwork. Author contributions: Baasansuren Erdenechimeg: conceptualisation (equal), data conceptualisation (equal), formal analysis (equal), investigation (lead), visualisation (equal), writing – original draft (lead), writing – review and editing (lead); Bulgan Odmaa: conceptualisation (equal), formal analysis (equal), investigation (equal), visualisation (equal), writing – review and editing (equal); Gankhuyag Purew-Ochir: conceptualisation (equal), curation (equal), data conceptualisation (equal), writing – review and editing (equal); Amarkhuu Gungaa: conceptualisation (equal), curation (equal), data conceptualisation (equal); Guo Yumin: data conceptualisation (supporting), curation (equal), writing – review and editing (equal); Bayarsaikhan Uudus: curation (equal), writing – review and editing (equal); Oyunchimeg Terbish: investigation (equal); Tsoggerel Baldandugar: investigation (equal); Altangerel Tsogtmagnai: investigation (equal).





 Open access

