American democracy is founded on the premise of citizens' participation, and likewise, citizenship entails full expression of the rights and responsibilities inherent in societal membership (Walzer Reference Walzer, Ball, Farr and Hanson1989). Unfortunately, social class differences in political participation and community engagement in the United States persist (Verba, Burns, and Lehman Reference Verba, Burns and Lehman2003), and these inequalities seriously undermine the representativeness of democracy. From a developmental perspective, historical shifts in the nature of the transition from adolescence to adulthood, along with other social changes affecting youth, indicate that social inequalities in civic engagement among young people have increased in recent years (Finlay, Wray-Lake, and Flanagan Reference Finlay, Wray-Lake, Flanagan, Sherrod, Torney-Purta and Flanagan2010). Building on recent empirical findings among youth (Center for Information & Research on Civic Learning and Engagement (CIRCLE) 2011; Syvertsen, Wray-Lake, Flanagan, Briddell, and Osgood Reference Syvertsen, Wray-Lake, Flanagan, Briddell and Osgood2011), this study used data from the National Election Study collected during the past 50 years to determine whether social class differences in civic engagement are increasing.
SOCIAL INEQUALITY IN CIVIC ENGAGEMENT
Social inequality is an obstacle for civic engagement because educational and economic resources confer advantages in the civic domain. Associations between socioeconomic disparities and civic engagement have been widely documented among adults as well as youth, at the neighborhood level, and for a range of behaviors including voting, other political activities, and volunteering (Hart and Atkins Reference Hart and Atkins2002; Kinder and Sears Reference Kinder, Sears, Lindzey and Aronson1985; McFarland and Thomas Reference McFarland and Thomas2006; Verba, Schlozman, and Brady Reference Verba, Schlozman and Brady1995). Social inequalities in civic engagement are also evident among youth around the world (Amadeo, Torney-Purta, Lehmann, Husfeldt, and Nikolova Reference Amadeo, Torney-Purta, Lehmann, Husfeldt and Nikolova2002). The social class divide in civic engagement can be partly attributed to disadvantages that accumulate during childhood and adolescence as well as the lack of institutional opportunities for civic participation available to individuals who do not attend college (Flanagan and Levine Reference Flanagan and Levine2010). Beyond participatory behaviors, socioeconomic disparities also extend to civic knowledge, skills, and feelings of empowerment (Levinson Reference Levinson, Sherrod, Torney-Purta and Flanagan2010). Verba and colleagues (Reference Verba, Burns and Lehman2003) argued that class differences in political participation are largely the result of educational disparities, with education being the “single most substantial and most multi-faceted influence on political activity” (47). Thus, investigations of socioeconomic inequalities in civic engagement typically operationalize socioeconomic status in terms of education (CIRCLE 2011; Syvertsen et al. Reference Syvertsen, Wray-Lake, Flanagan, Briddell and Osgood2011).
Here we ask an important, unanswered, question: have social inequalities in civic engagement grown in recent years? Evidence from a national study of high school seniors from 1976 to 2005 suggested that social class disparities (measured by adolescents' college aspirations) in voting intentions and volunteering have expanded since the early 1990s (Syvertsen et al. Reference Syvertsen, Wray-Lake, Flanagan, Briddell and Osgood2011). Persistent, yet stable, class differences were found for political behaviors, trust in government, and public hope. However, other evidence has not found increasing social inequalities in civic trends. For example, data from the Census Current Population Survey showed a large but stable gap in the voting rates of 18 to 29 year olds from 1972 to 2008 when comparing youth based on college experience versus no college experience (CIRCLE 2011). These conflicting results may be due to differences in civic engagement measures (i.e., voting intentions versus reported voting behavior) or in population (high school seniors versus 18–29 year olds). To better understand whether disparities are growing and for whom further exploration is needed.
UNIQUE TRENDS FOR YOUTH?
These previous analyses of educational disparities in civic engagement over time have exclusively examined youth (i.e., 18 to 29 year olds). Thus, an implicit assumption is that social inequalities may be growing for young people in particular; indeed, theory and some research suggest that this assumption is plausible for at least three reasons.
First, changes to the education system, such as cuts to funding and institution of the No Child Left Behind Act, have forced secondary education to focus on basic subjects and deemphasize civic education (Kahne and Middaugh Reference Kahne and Middaugh2008). Therefore, youth of varying backgrounds are less likely to gain equal exposure in school to civic education and preparation for civic life than in previous decades. Second, the transition to adulthood has become more protracted in recent decades, with youth taking longer to settle into adult roles and establish residential stability (Arnett Reference Arnett2000; Settersten, Furstenberg, and Rumbaut Reference Settersten, Fursternberg and Rumbaut2005). Delays in establishing adult roles and community ties parallel documented delays in civic participation such as voting (Flanagan and Levine Reference Flanagan and Levine2010). This delay suggests that historical trends for youth as compared to older adults exhibit more variability in civic engagement over time. The uncertainty of this developmental transition may compromise the optimal development of more vulnerable youth (Osgood, Foster, Flanagan, and Ruth Reference Osgood, Foster, Flanagan, Ruth, Osgood, Foster, Flanagan and Ruth2006). Third, fewer institutional opportunities now exist for youth to become involved in politics and community life after high school (Finlay, Wray-Lake, and Flanagan Reference Finlay, Wray-Lake, Flanagan, Sherrod, Torney-Purta and Flanagan2010; Flanagan and Levine Reference Flanagan and Levine2010; Jennings and Stoker, Reference Jennings and Stoker2004). For example, members of the World War II generation were offered a range of institutionalized civic opportunities from the New Deal, Civilian Conservation Corps, and G.I. Bill; yet, since the 1970s, these types of government support programs have eroded (Finlay et al. Reference Finlay, Wray-Lake, Flanagan, Sherrod, Torney-Purta and Flanagan2010). For youth who are exposed to less civic education in high school and who do not plan to attend college, institutional opportunities for civic engagement may be increasingly important.
Our study more rigorously tested the idea that social inequalities in civic engagement are growing among youth by using data from the National Election Study (NES), in which participants span the entire range of adulthood, and compared trends for youth with trends for older adults. In line with previous studies (CIRCLE 2011; Syvertsen et al. Reference Syvertsen, Wray-Lake, Flanagan, Briddell and Osgood2011; Verba et al. Reference Verba, Burns and Lehman2003), we operationalized social class in terms of education. Based on the measures available, our analyses focused on voting and other political activities. Specifically, given that previous studies examined evidence for the social class divide exclusively among young people (CIRCLE 2011; Syvertsen et al. Reference Syvertsen, Wray-Lake, Flanagan, Briddell and Osgood2011), we considered whether a growing educational disparity in voting and political behaviors would be more evident, or only evident, among 18 to 29 year olds. In other words, we hypothesized an education × survey year × age interaction such that rates of political participation for less-educated young people would decline more steeply over time compared to more-educated youth and older adults of any education level.
METHOD
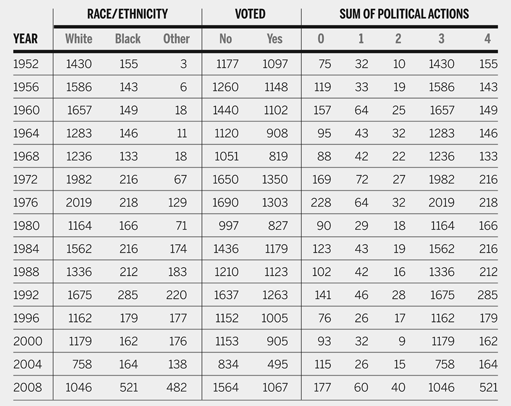
Data came from the National Election Study, a cross-sectional time series study designed to understand Americans' voting and public opinion. Face-to-face interviews primarily have been used to survey a nationally representative sample of US adults ages 17 to 99 (M = 45.76, SD = 17.15) biennially since 1952. A multistage probability sampling design was used to sample individuals of voting age from US Census regions, Census blocks, and housing units that are stratified by geography, size, and median per capita income. Our study used postelection interview data from the 1952 to 2008 presidential election years (i.e., 15 data points across 56 years) and from individuals at least 18 years old. Sample size ranged from 1,060 to 2,366 across years, with approximately 26,000 individuals participating overall (56% female). See table 1 for ethnicity of sample across survey years. Data weights were used in all analyses to ensure representativeness of the sample.
Frequencies of Race/Ethnicity, Voting in Presidential Election, and Sum of Political Actions by Year

Measures
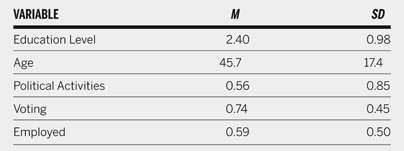
Voting was measured by asking individuals whether they voted in the most recent presidential election (yes = 1, no = 0). Participants were also asked whether or not they attended political meetings or rallies, worked for a party or candidate, displayed a candidate button or sticker, and donated money to a party or candidate during the campaign (yes = 1, no = 0). Political activities were measured as the sum of these four behaviors. Frequencies of voting and political activities across years are shown in table 1 and means for study variables are displayed in table 2.
Means and Standard Deviations of Study Variables

Respondents reported highest level of education completed on a four-point scale: 8th grade or less (1), high school (2), some college (3), and college or advanced degree (4). Age was calculated from respondents' reports of their birthdates and measured in years (i.e., 18 to 99). Year of survey was entered as a linear continuous variable. Sex (female = 2, male = 1), ethnicity (dummy coded into Black and Other with White as the reference group), and employment (employed = 1, unemployed = 0) were included in models as control variables.
RESULTS
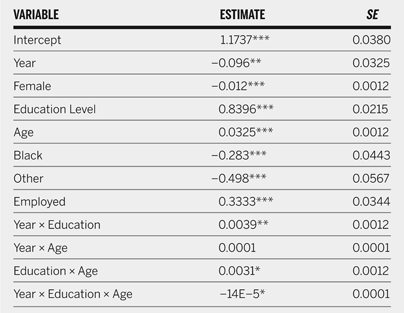
Two regression models were examined to test the theory-driven hypothesis of an education × year × age interaction. A logistic regression model was conducted to examine the binary outcome of voting; negative binomial regression was used to examine political activities, given that this distribution is appropriate for modeling a count variable. Independent variables were entered simultaneously to examine unique effects. Presentation of results focuses on interpretation of the highest level interaction effect for parsimony and based on a priori predictions.
Voting
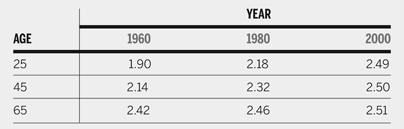
The results of regressing voting on demographic control variables, year of survey, education, age, and interactions between survey year, education, and age are presented in table 3. Results indicated that female individuals, individuals of Black and other ethnicities, and unemployed individuals had lower odds of voting in presidential elections. More educated individuals had higher odds of voting, and there was also an age × education interaction. Table 4 illustrates effect sizes by showing odds ratios for individuals ages 25, 45, and 65 and across 1960, 1980, and 2000. A one-unit increase in educational attainment related to 1.9 to 2.5 higher odds of voting in presidential elections across years and ages. Odds ratios increased in relation to year and age.
Logistic Regression of Voting on Predictors

* p < .05;
** p < .01;
*** p < .001
Estimated Odds Ratios for Voting for a One-Increment Increase on the Educational Attainment Scale for 3 Years and 3 Ages

The main effects and two-way interactions between survey year, age, and education were qualified by a significant three-way interaction (see table 3 and figure 1). To facilitate presentation of the interaction, education was coded into higher (some college or more) versus lower (high school education or less) levels, and age was coded into younger (18–34) and older (55 and older) groups. A small but stable difference was noted in voting rates for older adults by education (favoring the more educated), whereas trends diverged for younger individuals depending on education levels. In support of our hypothesis, a substantial decline in voting rates was evident across 1952 to 2008 for younger and less-educated individuals only.
Voting Rates by Election Year, Education Level, and Age
Note. Figure illustrates significant education × age × year interaction in predicting voting. Education is coded as high (some college or more) versus low (high school education or less). Age is coded as young (18–34) versus old (55 and older).

Political Activities
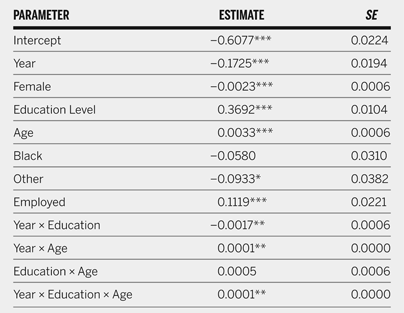
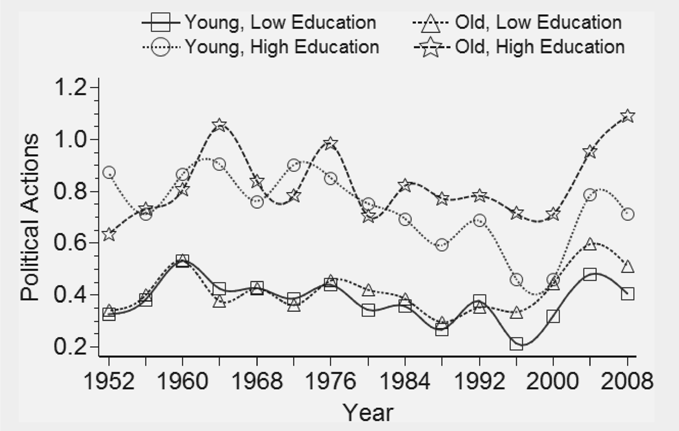
A regression model examined the same set of main effects and interactions in relation to political activities (see table 5). As with voting, women and individuals reporting an ethnicity other than Black or White reported lower levels of political activity participation. Also similar to voting, employed individuals were more engaged in political activities. Again, main effects and two-way interactions for survey year, education level, and age were qualified by a significant three-way interaction. Education and age were dichotomized as described earlier for displaying the interaction. As seen in figure 2, patterns were not consistent with our expectations. A sizeable education disparity in political participation rates was evident among older adults across the study period, and political activity rates for younger and older individuals with a high school education or less were similarly low across the six decades. However, the interaction revealed that more educated young people demonstrated a decline in political activities over time, with participation rates converging with, rather than diverging from, the rates of their less-educated, same-age counterparts. As figure 2 suggests, this convergence began in the 1970s and gradually continued through the early 2000s. Interestingly, political participation across groups increased during the 2004 presidential election and showed relatively high rates during the 2008 election.
Poisson Regression of Sum of Political Activities on Predictors

* p < .05;
** p < .01;
*** p < .001
Political Activity Participation by Election Year, Education Level, and Age
Note. Figure illustrates significant education × age × year interaction in predicting political activities. Education is coded as high (some college or more) versus low (high school education or less). Age is coded as young (18–34) versus old (55 and older).

DISCUSSION
Using a nationally representative sample, our results partially supported the hypothesis that social inequality in civic engagement has grown for youth in the United States in recent years. A pattern of growing social inequality among youth was clearly evident for voting, as declines in voting rates were steeper for less-educated youth compared to older adults or more-educated youth. Results for political activities did not support our hypothesis, but we found declining rates in participation for more-educated youth coupled with low but stable rates for less-educated youth.
Voting
Our findings suggest that, for young people, national election decisions are being increasingly left to the more educated. The same pattern of growing social inequality in voting was found by Syvertsen and colleagues (Reference Syvertsen, Wray-Lake, Flanagan, Briddell and Osgood2011), who examined historical trends in voting intentions among a nationally representative sample of high school seniors. Thus, our study essentially replicates their previous findings for voting, yet also builds on their work by using self-reports of actual voting behavior, empirically comparing youth to adults to clarify that the social inequalities are specific to youth, and examining a longer historical time span. Given that data reported by CIRCLE (2011) from the Census Current Population Survey are also nationally representative, it is perplexing that their reported trends in voting for 18 to 29 year olds did not show the pattern of increasing social inequality.
Despite the inconsistent results reported by CIRCLE, we believe that our results, as well as those of Syvertsen et al. (Reference Syvertsen, Wray-Lake, Flanagan, Briddell and Osgood2011), call for increased attention to educational disparities in voting among young people. Although college enrollment has steadily increased over the past few decades, many individuals do not graduate; for example, only 32% of individuals aged 25 to 34 held a bachelor's degree or higher in 2009 (US Census Bureau 2010). Thus, a large proportion of the youth population does not complete college and is at risk for underrepresentation in national election decisions. From political science research, we know that voting habits tend to be established during youth and persist across adulthood (Plutzer Reference Plutzer2002). Thus, redressing social inequalities in youth civic engagement is not only important for current generations of youth but perhaps also for future generations of older adults.
Political Activities
In examining political activities other than voting, results indicated an unexpected pattern: more-educated youth showed the steepest declines in participation rates over time. These results may be partly explained by a floor effect in the political activities of less-educated youth: their rates were quite low across the study period (averaging around .4 on a 0 to 4 scale), and thus could not show much more decline over time. In addition, perhaps activities with traditional political parties—such as attending meetings, campaigning, and donating money to campaigns or parties—are falling out of favor with educated youth. Some scholars suggest that traditional engagement is being replaced by new forms such as online activities, consumer politics, and other more informal types of civic engagement (e.g., Keeter, Zukin, Andolina, and Jenkins Reference Keeter, Zukin, Andolina and Jenkins2002). Insofar as more-educated youth have more economic and social resources, they may have more opportunities to replace conventional politics with novel ways to engage in social issues. An alternative explanation is that more-educated youth in the United States may be becoming more satisfied with only voting and simply less engaged in other domains of civic life. The social changes for youth described earlier—which portend decreased emphasis on civic education in schools, delayed acquisition of adult roles, and fewer institutional opportunities—could be suppressing the political engagement of youth regardless of education levels. Notably, however, high participation in the political activities measured here was rare across our entire sample, which is not surprising given previously documented declines in many traditional types of civic indicators across historical time (Putnam Reference Putnam2000).
In this study, differing findings for political activities and voting suggest that the type of civic participation may be important for understanding historical patterns of social inequality in youth civic engagement. In addition to interaction effects, our results support the well-documented social class gap in civic engagement. As other research has implied, inequalities are stubbornly persistent for certain types of civic engagement, whereas educational disparities are increasing for other types such as voting (Syvertsen et al. Reference Syvertsen, Wray-Lake, Flanagan, Briddell and Osgood2011). A limitation of our study is that we could not assess nonpolitical or newly emerging types of civic engagement; future research should explore a broader array of civic behaviors to better understand youth participation and the extent of growing versus stable or decreasing social inequalities across various forms. Another limitation is that our analyses did not account for potential changes in voting ages by states over historical time; civic behavior is a not a direct reflection of age, education, and historical cohort, but is also a product of culture, political issues, societal norms, and laws. Studying a broader age range of youth would be beneficial; our study was limited to youth aged 18 and older, yet adolescents can engage in politics and community life in meaningful ways prior to eligibility to vote.
Implications
Evidence for growing social inequalities in youth voting is now accumulating, and educational disparities persist. Our results also revealed civic inequalities in other social groups, joining previous research in documenting that ethnic minorities, female, and unemployed individuals are less politically involved (e.g., Putnam Reference Putnam2000; Verba et al. Reference Verba, Schlozman and Brady1995). Research is sorely needed that suggests effective ways to engage underrepresented groups in the political process. For example, political parties could interface more directly with young people and issues concerning youth; there was some anecdotal evidence of increases in these kinds of efforts during the 2004 and 2008 presidential elections (e.g., Schifferes Reference Schifferes2008), and as our results indicated, participatory behaviors for youth likewise showed some gains in these years. Educational reform could encourage a renewed focus on civic education that empowers all youth and particularly those in disenfranchised groups (Levinson Reference Levinson, Sherrod, Torney-Purta and Flanagan2010). Postsecondary institutional supports, such as the AmeriCorps national service program, may be a promising avenue for establishing voting habits and increasing civic commitments in diverse groups of youth as they transition to adulthood (Finlay, Flanagan, and Wray-Lake Reference Finlay, Flanagan and Wray-Lake2011). Whatever the set of solutions, researchers, policy makers, and everyday citizens need to work toward redressing these persistent and growing threats to democracy.