Introduction
Actias Leach, 1815 is a relatively small genus (the ‘moon moths’) of giant silk moths (Lepidoptera: Saturniidae) that comprises beautiful moths whose adults have long swallowtails on the hindwings (Nässig and Peigler, Reference Nässig and Peigler1984; Hodges, Reference Hodges, Triplehorn and Johnson2005; Wu and Naumann, Reference Wu and Naumann2006; Zborowski and Edwards, Reference Zborowski and Edwards2007). This genus has been recorded in Asia, America, and Europe, and has potential significance in silk production (Collins and Weast, Reference Collins and Weast1961), food consumption (Wagner, Reference Wagner2005), and as special pets due to the lovely and colourful larvae (Albertoni and Duarte, Reference Albertoni and Duarte2015).
The classification of Actias species is confusing and challenging because many species are morphologically highly similar. Hence, morphology-based species may be subject to a high risk of overlooking cryptic species (De Biaggi et al., Reference De Biaggi, Leccia, Kroupa and Monje2010; Ichter et al., Reference Ichter, Leccia, Touroult, Blandin, Aberlenc, Holtof, Foret, Bonet, Pascal, Dusoulier, Gargominy and Poncet2010). Consequently, the number of species in the genus Actias varies greatly, ranging from 41 to 46 (Ratnasingham and Hebert, Reference Ratnasingham and Hebert2007; Kitching et al., Reference Kitching, Rougerie, Zwick, Hamilton, St Laurent, Naumann, Ballesteros Mejia and Kawahara2018; Beccaloni et al., Reference Beccaloni, Scoble, Kitching, Simonsen, Robinson, Pitkin, Hine, Lyal, Ollerenshaw, Wing, Hobern, Bánki, Roskov, Döring, Ower, Hernández Robles, Plata Corredor, Stjernegaard Jeppesen, Örn, Pape, Hobern, Garnett, Little, DeWalt, Ma, Miller, Orrell, Aalbu, Abbott and Aedo2024), and even up to 55 in Wikipedia (accessed on 4 March 2025). Although only two nuclear genomes (Triant and Pirro, Reference Triant and Pirro2023; Markee et al., Reference Markee, Godfrey, Frandsen, Weng, Triant and Kawahara2024) and six mitochondrial genomes of Actias species have been sequenced (Liu et al., Reference Liu, Zhu, Dai, Wei and Liu2012; Park et al., Reference Park, Kim and Kim2016; Zhao et al., Reference Zhao, Su, He, Jiang, Zuo, Lin and Huang2021; García-Souto et al., Reference García-Souto, Zumalave, Martínez-Romero, Marí-Mena, Vizcaíno and Vila2025), there are many cytochrome oxidase subunit I (COI) sequences of Actias species available in the BOLD (https://portal.boldsystems.org/; Ratnasingham and Hebert, Reference Ratnasingham and Hebert2007) and NCBI databases (https://www.ncbi.nlm.nih.gov/) that may be helpful to establish the taxonomic classification of this genus.
For several decades, DNA sequence data have been used extensively to resolve taxonomic debates and test cryptic species. DNA barcoding based on COI sequences is an efficient tool to delineate taxa and link adult morphs with their developmental life stages in various insects (Hebert et al., Reference Hebert, Cywinska, Ball and deWaard2003; Alex Smith et al., Reference Alex Smith, Fernández-Triana, Eveleigh, Gómez, Guclu, Hallwachs, Hebert, Hrcek, Huber, Janzen, Mason, Miller, Quicke, Rodriguez, Rougerie, Shaw, Várkonyi, Ward, Whitfield and Zaldívar-Riverón2013; Tsai et al., Reference Tsai, Wan and Yeh2014). As such, DNA barcoding has also been used in the study of Lepidoptera species (e.g. Aguila et al., Reference Aguila, Plasencia, Maravi and Wahlberg2012; Núñez et al., Reference Núñez, Genaro, Pérez-Asso, Murillo-Ramos, Janzen, Hallwachs, Wahlberg and Hausmann2020; Zhang et al., Reference Zhang, Cong, Shen, Opler and Grishin2021, Reference Zhang, Fang and Jiang2022). More generally, by integrating phenotypic characteristics, geographic distribution, DNA barcodes, and phylogenetic analysis, a thorough classification approach has been proposed to re-examine classification problems (Sheth and Thaker, Reference Sheth and Thaker2017).
To resolve taxonomic uncertainties within the genus Actias, we present in this study a global phylogenetic framework for this genus by integrating all available COI sequences from both the NCBI and BOLD databases. Building upon this foundation, we systematically evaluate species boundaries and establish a DNA data-driven, genus-specific genetic distance threshold to provide a more precise tool for species identification in the genus Actias. Furthermore, we seek to elucidate the phylogeographic patterns of Actias species by connecting phylogenetic relationships with geographical distributions, thereby offering new insights into the origin, dispersal, and speciation history of the genus.
Materials and methods
Research rationale and dataset assembly
This study was designed to establish a comprehensive global phylogenetic framework for the genus Actias in order to resolve several longstanding taxonomic uncertainties. Within this framework, we addressed specific taxonomic challenges in Liaoning Province, China, where the high morphological similarity between species complicates their identification. The overarching strategy was to construct a robust global reference dataset and then use it to validate existing public sequences from Liaoning and definitively identify newly collected specimens from Benxi, Liaoning Province.
To this end, all public COI sequences for the genus Actias were retrieved from the BOLD and NCBI databases (accessed on 4 March 2025) using the search strategy (e.g. ‘Actias’ AND (‘COI’ OR ‘cytochrome c oxidase subunit I’)). Following a quality control pipeline (Schmidt et al., Reference Schmidt, Schmid-Egger, Morinière, Haszprunar and Hebert2015; Schattanek-Wiesmair et al., Reference Schattanek-Wiesmair, Huemer, Wieser, Stark, Hausmann, Koblmüller and Sefc2024), the resulting curated public dataset was integrated with four new sequences from Benxi (generated for this study). This combined final dataset represents the global diversity of the genus and served as a reference for all subsequent phylogenetic and taxonomic analyses in this study (table S1).
Specimen collection and laboratory procedures
To assess the classification of Actias species from Liaoning Province, China, four adults of Actias specimens collected from Benxi, Liaoning Province, on 28 July 2023, were used (fig. S1). The femurs of the specimens were immersed in trace DNA extraction buffer (10 mmol/l Tris-HCl (pH 8.0), 10 mmol/l EDTA (pH 8.0), 100 mmol/l NaCl, 2% SDS, 0.039 mol/l DTT, and 100 mg/l proteinase K) (Wang et al., Reference Wang, Zhou, Lu, Xiang, Yang and Zeng1997), incubated at 50℃ for 2 h and then treated via the traditional phenol/chloroform method. A 658 base pair (bp) COI sequence was amplified using the primer set C1-J1483 (5'-GGTCAACAAATCATAAAGATATTGG-3') and C1-N2194 (5'-TAAACTTCAGGGTGACCAAAAAATCA-3') (Simon et al., Reference Simon, Buckley, Frati, Stewart and Beckenbach2006). PCR amplification was conducted under the following conditions: initial denaturation at 90℃ for 3 min, followed by 35 cycles at 90℃ for 30 s, 55℃ for 30 s, and a final extension at 72℃ for 45 s. The PCR products were purified and directly sequenced with the PCR primers. Chromas 2.6.5 Software (Technelysium Pty Ltd, South Brisbane, Queensland, Australia) was used to read and confirm the sequencing read data. These four COI sequences were then used for species identification through DNA barcode analysis.
Preliminary data screening and alignment
Sequences retrieved from the BOLD and NCBI databases with lengths <500 bp were excluded for further analyses (Schmidt et al., Reference Schmidt, Schmid-Egger, Morinière, Haszprunar and Hebert2015; Schattanek-Wiesmair et al., Reference Schattanek-Wiesmair, Huemer, Wieser, Stark, Hausmann, Koblmüller and Sefc2024). The dataset was deduplicated, with taxonomic precedence given to BOLD records in cases of conflict. Sequences that were confirmed to be non-COI fragments via MAFFT analysis were also removed (Katoh et al., Reference Katoh, Rozewicki and Yamada2017). The remaining sequences were aligned using the MAFFT online service (https://mafft.cbrc.jp/alignment/server/) (Katoh et al., Reference Katoh, Rozewicki and Yamada2017). This initial alignment was then used to construct a preliminary neighbour-joining (NJ) tree to screen for sequences that behaved as phylogenetic outliers (e.g. those exhibiting exceptionally long branches or unstable positions that distorted the tree topology). A minimal number of such outlier sequences were identified and excluded to ensure the robustness of the dataset for further analyses. The final, curated alignment was used for all subsequent analyses. MEGA 11 (Tamura et al., Reference Tamura, Stecher and Kumar2021) was used to infer the numbers of invariable sites, polymorphic sites, parsimony informative sites, and singleton sites.
Species delimitation and K2P genetic distance analysis
To estimate the number of molecular operational taxonomic units (MOTUs), three methods were employed: Automatic Barcode Gap Discovery (ABGD), Assemble Species by Automatic Partitioning (ASAP), and Bayesian Poisson Tree Processes (bPTP). The ABGD analysis was conducted online (https://bioinfo.mnhn.fr/abi/public/abgd/abgdweb.html) with the default settings, using a relative gap width (X = 1.1) and intraspecific divergence (P) values between 0.001 and 0.1 with the Kimura-2-Parameter (K2P) model (Puillandre et al., Reference Puillandre, Lambert, Brouillet and Achaz2012). The ASAP analysis was performed using a web browser (https://bioinfo.mnhn.fr/abi/public/asap/) with the Jukes–Cantor (JC69) model and default settings (Puillandre et al., Reference Puillandre, Brouillet and Achaz2021). The bPTP analysis was run on the web server (http://species.h-its.org/ptp) with 100,000 Markov Chain Monte Carlo Method (MCMC) generations and default parameters (Zhang et al., Reference Zhang, Kapli, Pavlidis and Stamatakis2013). Intra- and interspecific K2P distances among Actias COI sequences were calculated using MEGA 11 (Tamura et al., Reference Tamura, Stecher and Kumar2021).
To quantify the genetic differentiation between evolutionarily ambiguous lineages identified in our global phylogenetic tree, we computed Fst values. These ‘populations’ for Fst analysis were defined as specific MOTUs or subclades with ambiguous taxonomic status (e.g. allopatric lineages with shallow genetic divergence, or parapatric lineages with deep splits) derived from the global dataset. Fst values between populations with ambiguous taxonomic status were computed using DnaSP 6 (Rozas et al., Reference Rozas, Ferrer-Mata, Sánchez-delbarrio, Guirao-Rico, Librado, Ramos-Onsins and Sánchez-Gracia2017) and Arlequin suite v. 3.5 (Excoffier and Lischer, Reference Excoffier and Lischer2010).
Geographic phylogeny
An NJ tree was constructed with MEGA 11 (Tamura et al., Reference Tamura, Stecher and Kumar2021), with the following settings: bootstrap method (1000 replications), model (maximum composite likelihood), substitutions (transitions + transversions), and missing data treatment (pairwise deletion). The Chinese oak silkmoth (Saturniidae) Antheraea pernyi (Guérin-Méneville, 1855) (GenBank ID: OQ272864) and the domestic silkmoth (Bombycidae) Bombyx mori (Linnaeus, 1758) (GenBank ID: JF700137) were used as outgroup taxa. ArcMap 10.8.1 (ESRI, Reference ESRI2020) was used to map the geographic location of the COI sequences of Actias species, according to the geographic information retrieved from the BOLD database (table S2).
Results
Sequence information
The final dataset of 741 COI sequences from the genus Actias was assembled for analysis. This was achieved by merging an initial set of 848 public sequences from BOLD (736) and NCBI (112), which involved removing 105 duplicate records (prioritizing BOLD taxonomy) and 6 problematic sequences (4 non-COI (KT026042, KX302402, SATWG001-18, and GBGLS178-19; fig. S2), and 2 short outliers (SAUPA121-09 and SAUPA122-09; fig. S3)), resulting in 737 curated public sequences (table S1) (Pu et al., Reference Pu, Wu, Huo, Wang, Xia, Li, Wang, Luo and Liu2008; Hebert et al., Reference Hebert, Dewaard and Landry2010; Zhong, Reference Zhong2016; García-Souto et al., Reference García-Souto, Zumalave, Martínez-Romero, Marí-Mena, Vizcaíno and Vila2025). These were combined with the four new sequences (PV628723, PV628724, PV628729, and PV628734; fig. S1) from Benxi, Liaoning Province (this study) to form the final dataset representing 46 morphospecies (table S2).
A total of 707 sequences with length >600 bp were selected for sequence comparison. In the alignment of 658 bp, there were 403 invariable sites (61.25%), 227 parsimony informative sites (34.50%), 28 singleton sites (4.25%), and 255 polymorphic sites (38.75%).
DNA barcoding-based species delimitation of the genus Actias
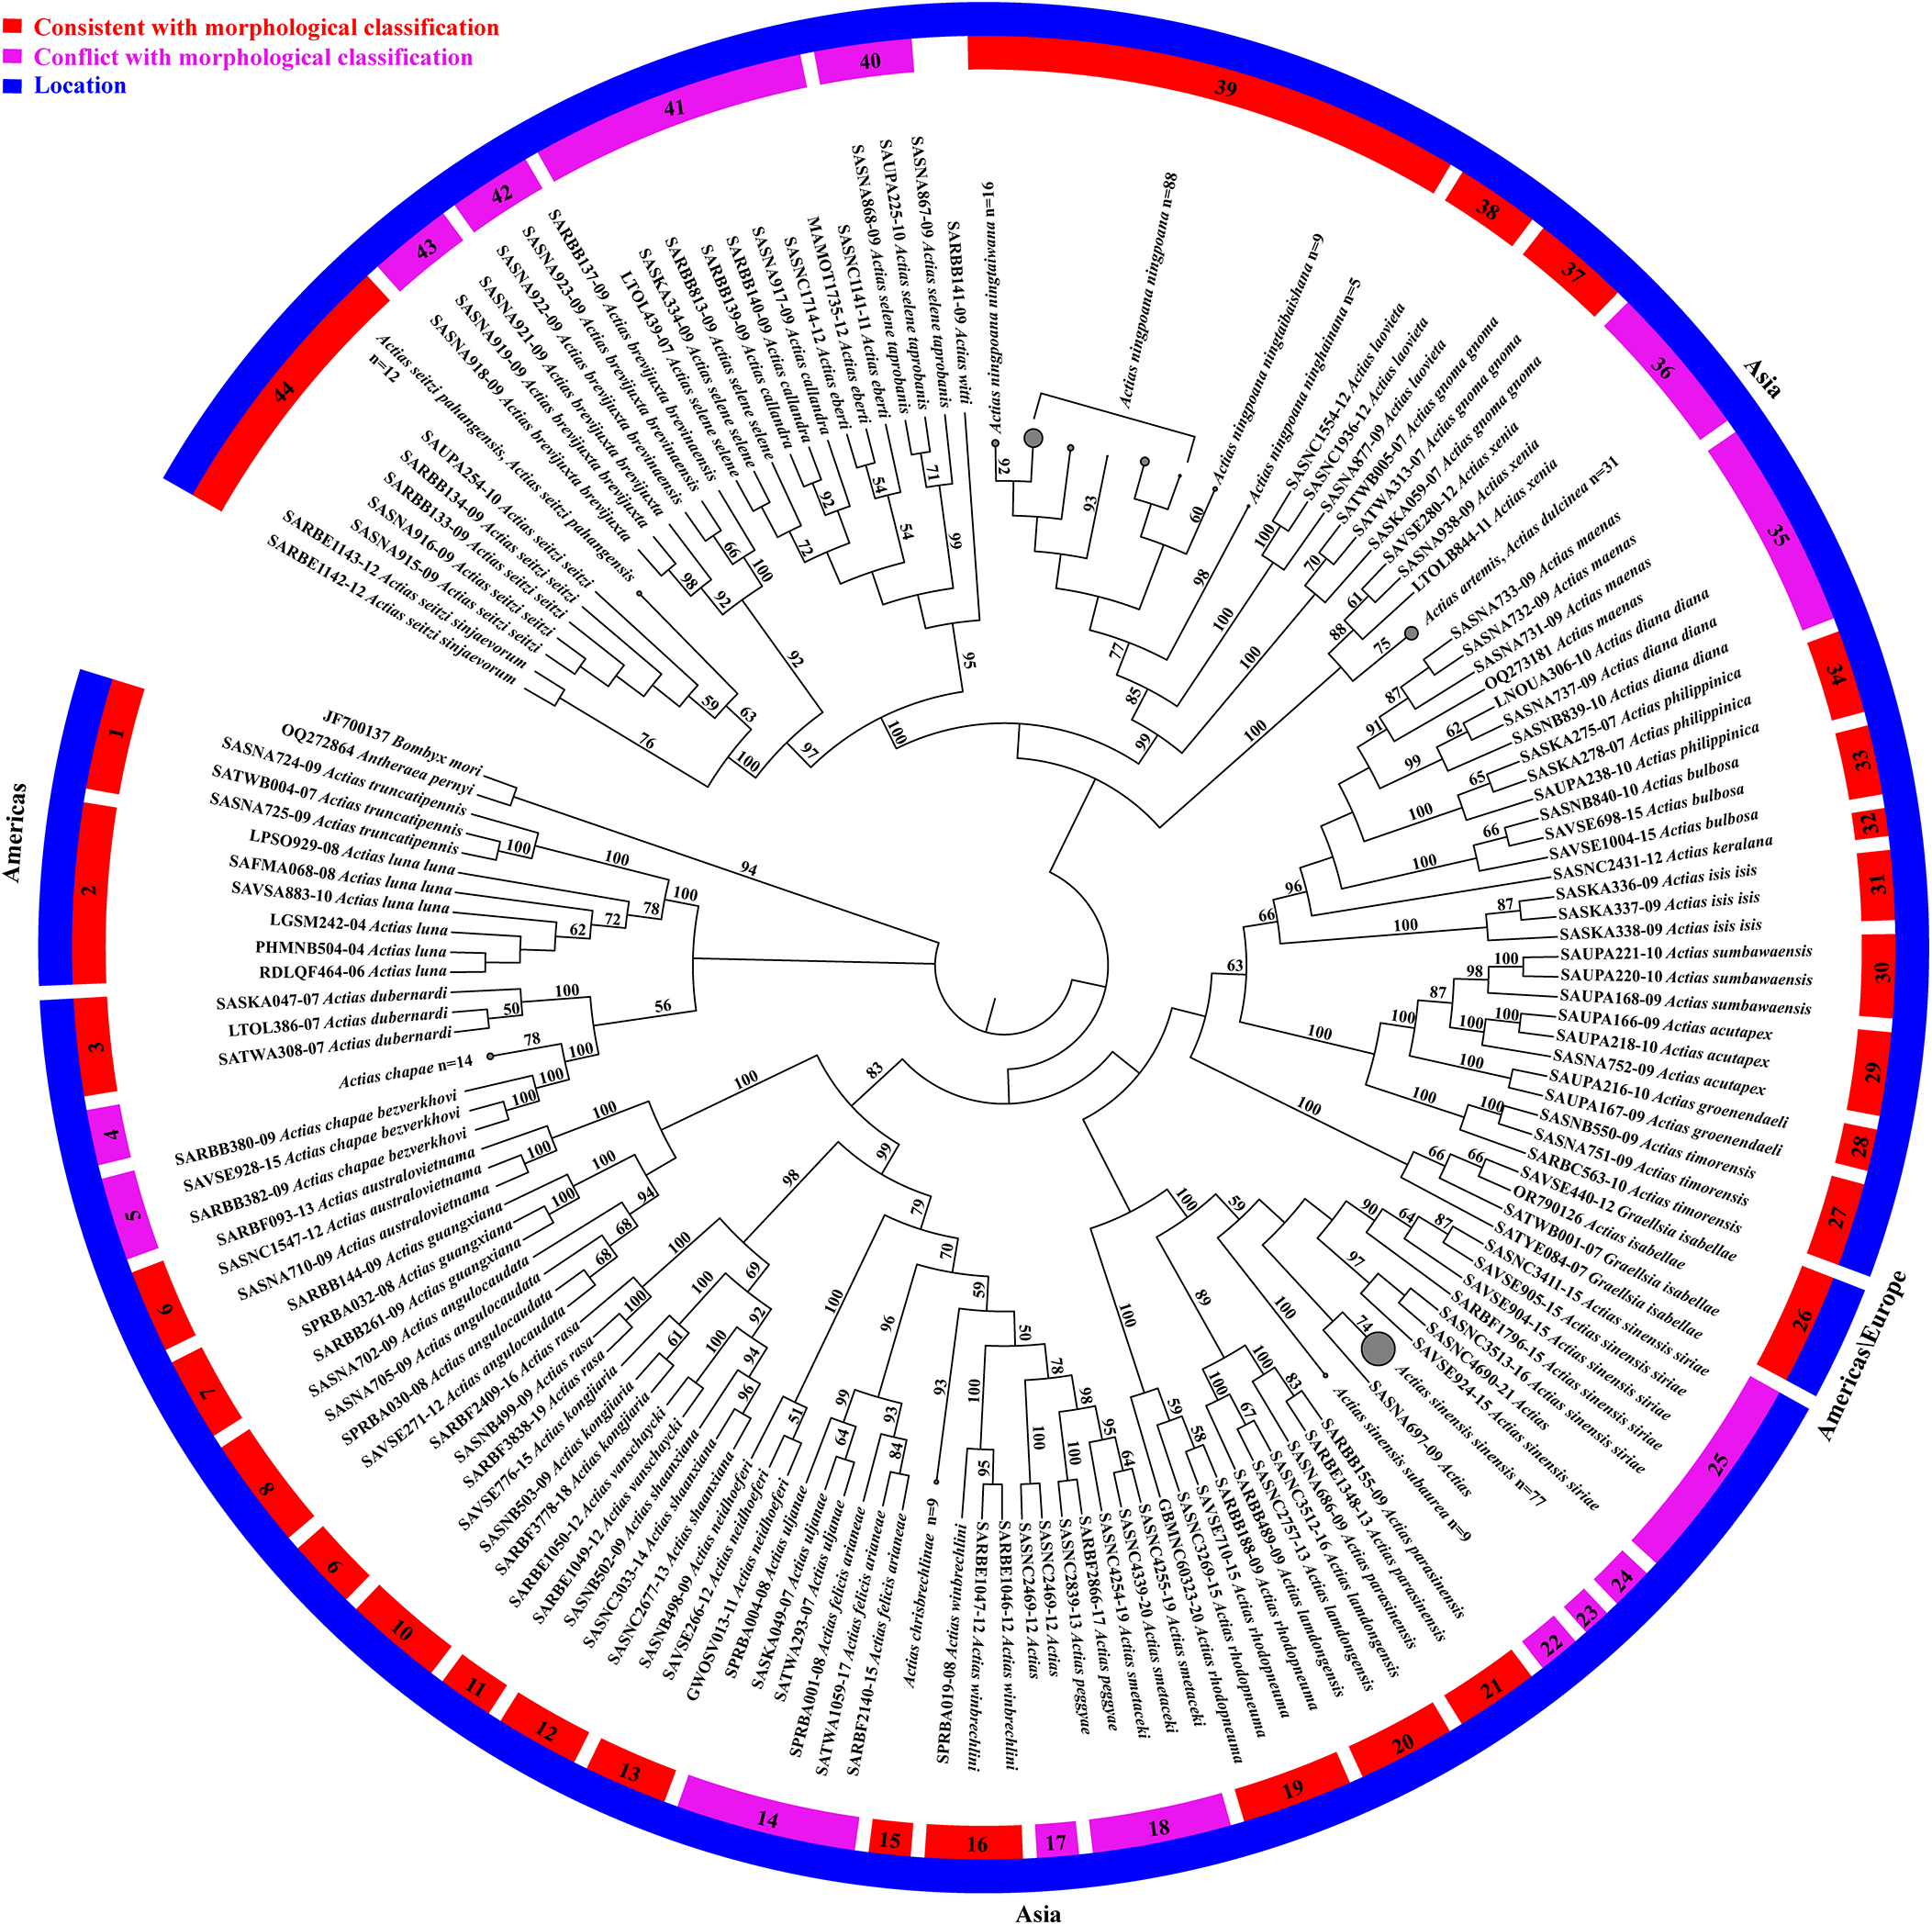
While ABGD and ASAP yielded largely congruent and stable results, the bPTP analysis produced inconsistent and poorly supported groupings that conflicted with both the morphological evidence and the phylogenetic structure. Similar instabilities with bPTP analysis have been reported in other lepidopteran groups (Tsai et al., Reference Tsai, Wan and Yeh2014; Guo et al., Reference Guo, An, Fang, Wei, Shen, Chen and He2024; Schattanek-Wiesmair et al., Reference Schattanek-Wiesmair, Huemer, Wieser, Stark, Hausmann, Koblmüller and Sefc2024). Therefore, we did not rely on the bPTP results, but based our final MOTU delineation on the consensus of ABGD, ASAP, phylogenetic monophyly, and genetic distances. Using this comprehensive dataset, we delineated 44 MOTUs for the genus Actias (fig. 1, table S2). Of these, 29 MOTUs showed complete concordance with well-established morphospecies and formed distinct, well-supported clades (bootstrap > 77%) (fig. 1, table S3). We used this set of 29 robust and consistent taxa as a baseline to estimate the first genus-specific genetic distance threshold for Actias species. The full range of interspecific K2P COI distances within this baseline dataset was 2.05–14.56% (table S3). We therefore defined this minimal value (2.05%) as the empirical COI-sequence-based genetic distance threshold for species delimitation in the genus. This threshold was subsequently applied to evaluate the taxonomic status of the remaining MOTUs that conflicted with initial morphological classifications, helping to identify potential cryptic diversity or misidentifications in relation to our proposed classification for Actias as summarized in table S4.
Phylogenetic relationships of 44 MOTUs based on COI sequences of the genus Actias inferred by neighbour-joining of K2P distances. Red blocks, MOTUs that are consistent with morphological classification; purple blocks, MOTUs that are in conflict with morphological classification; and blue blocks, geographic areas. For 29 MOTUs that agree well with morphological classification, 1–3 representative sequences are selected for each species. Numbers 1–44 indicate the numbering of MOTUs; n = sample size.

Figure 1 Long description
The image displays a circular phylogenetic tree illustrating the relationships of 44 MOTUs based on COI sequences. The tree is organized in a radial layout with branches extending outward from a central point. Each branch represents a MOTU, numbered from 1 to 44. The outermost ring is color-coded: red blocks indicate MOTUs consistent with morphological classification, purple blocks show MOTUs in conflict with morphological classification and blue blocks represent geographic areas. The tree is divided into sections labeled 'Asia', 'Australasia' and 'Indo-Australia', indicating the geographic distribution of the MOTUs. The labels on the branches include species names and bootstrap values, which provide support for the phylogenetic relationships depicted. The tree visually represents the genetic distances and evolutionary relationships among the MOTUs, with the color coding highlighting areas of agreement or conflict with morphological data.
DNA barcoding-based assessment of subspecies delimitation in the genus Actias
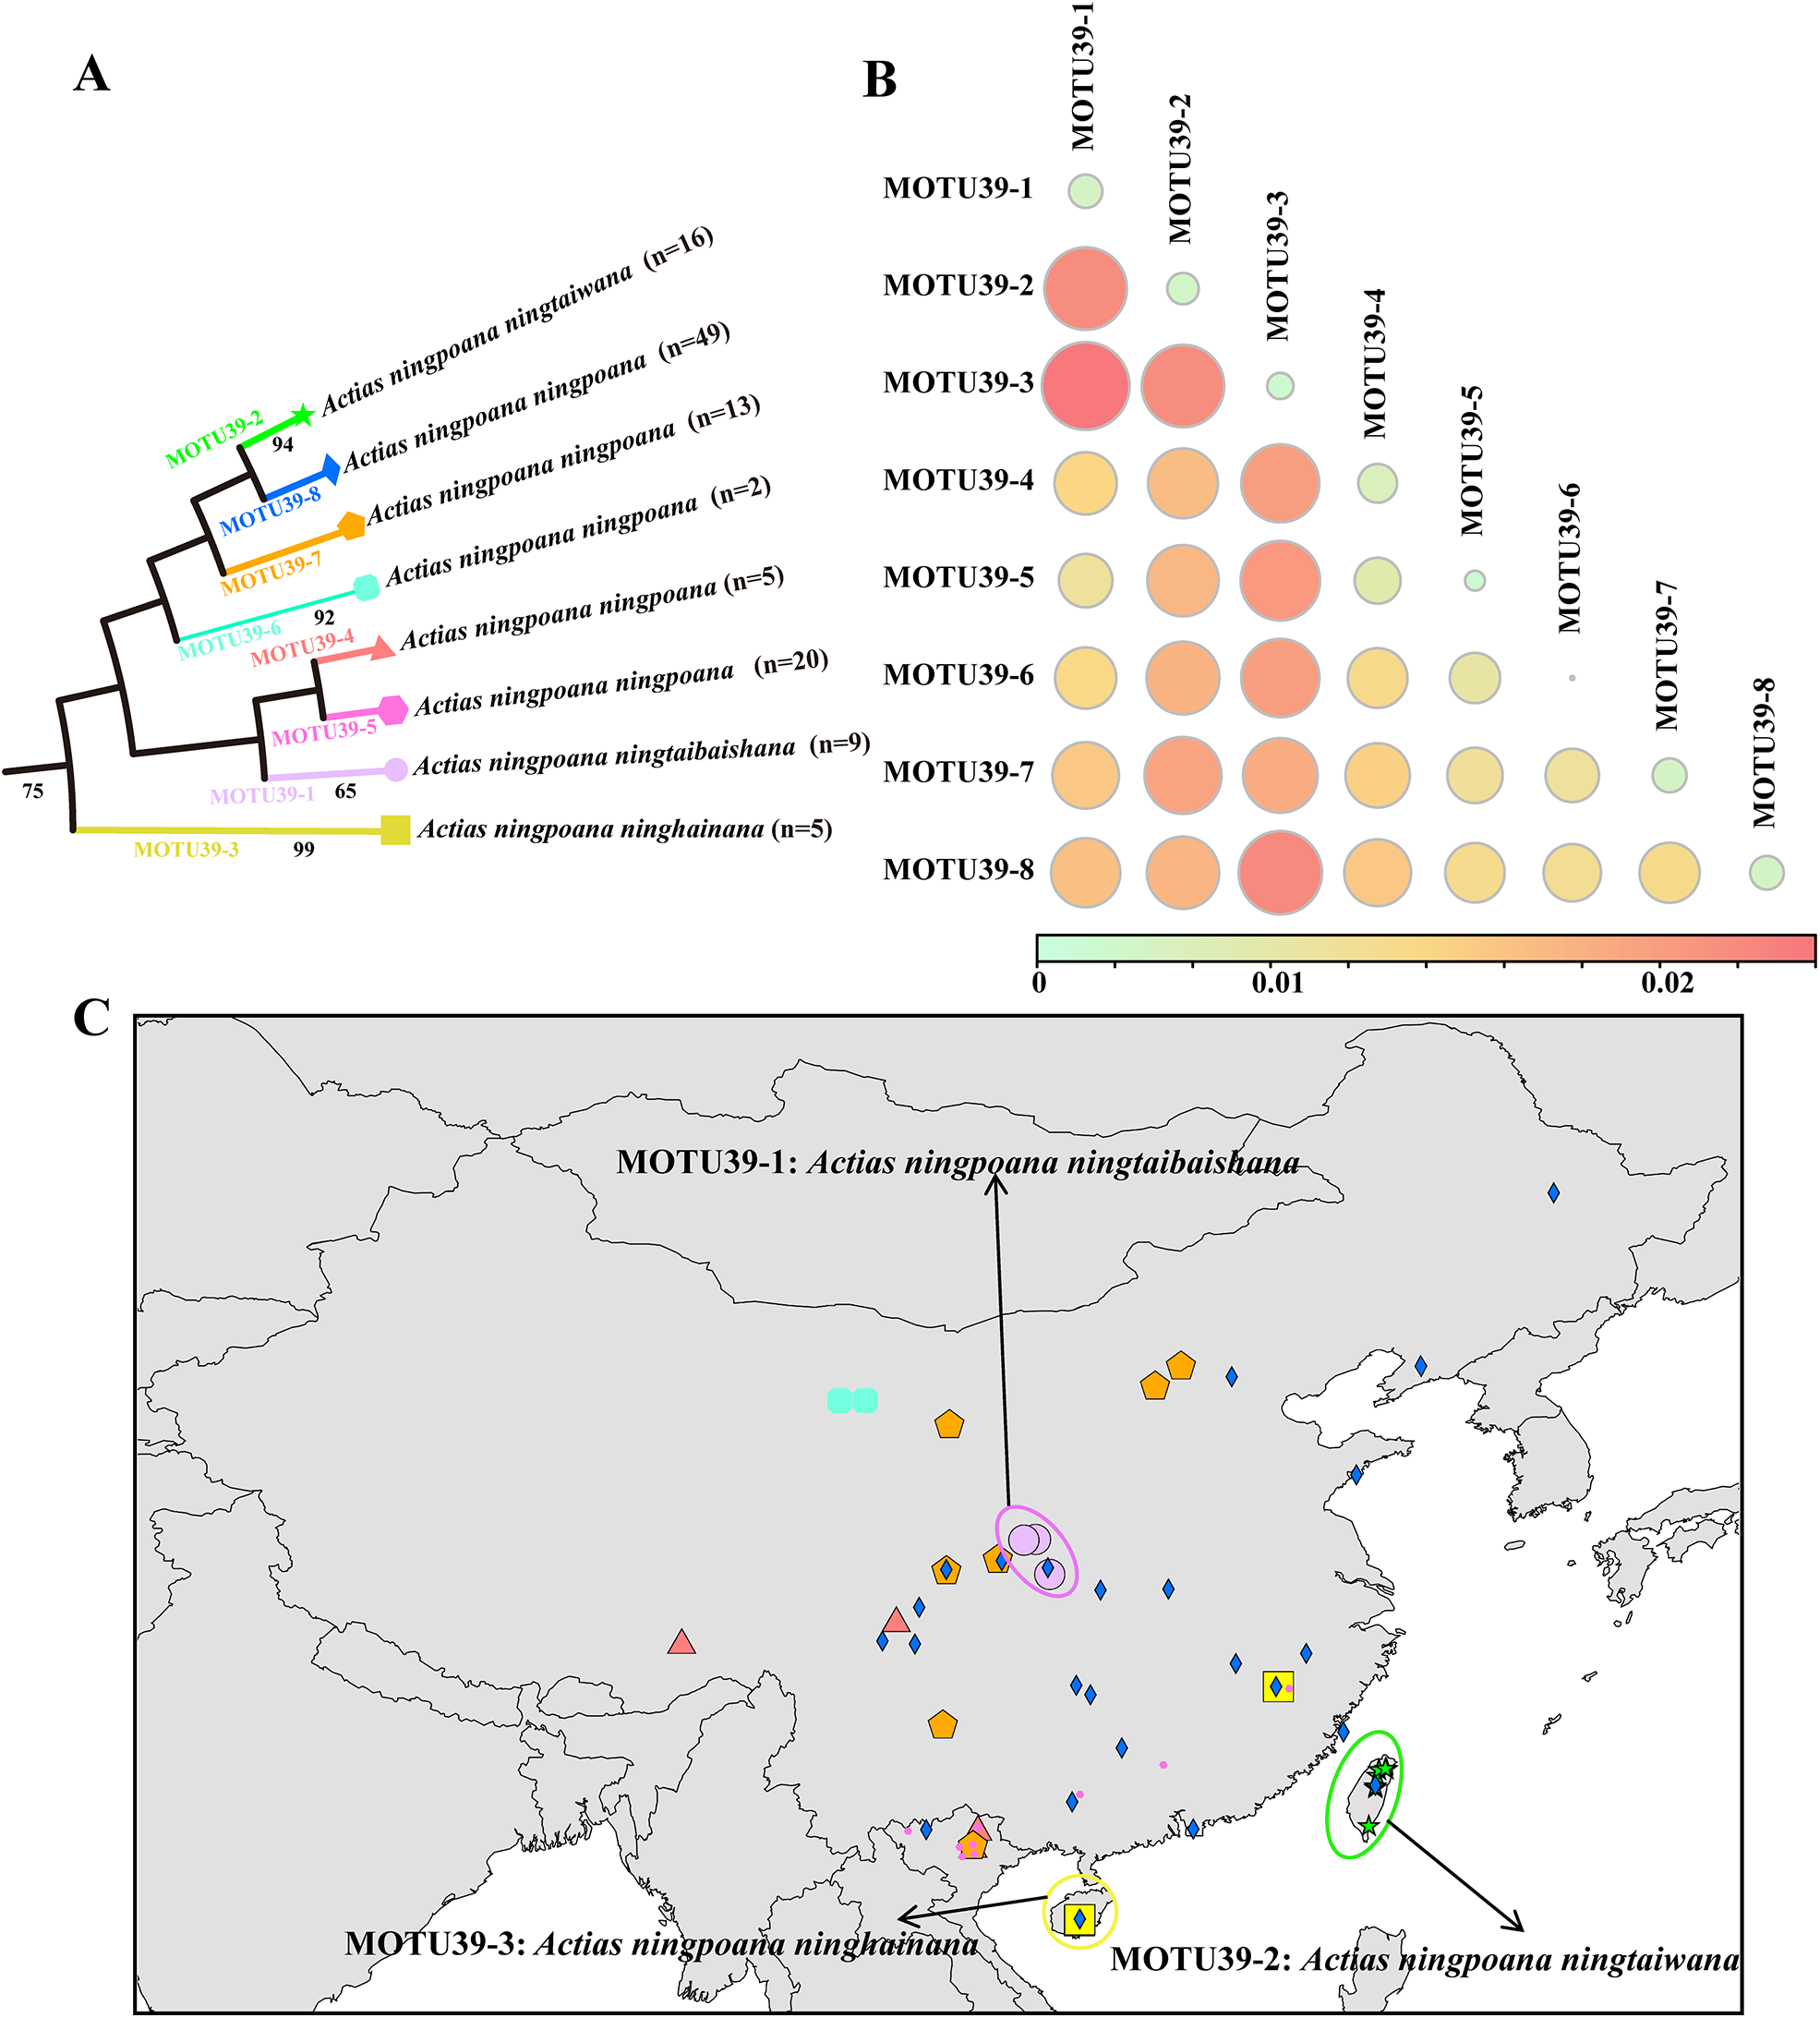
To establish a reference for subspecific genetic distances within the genus Actias, we analysed three morphologically well-defined lineages of Actias ningpoana Fielder, 1862 viz. A. n. ningtaibaishana Brechlin, 2013 (MOTU39-1), A. n. ningtaiwana Brechlin, 2012 (MOTU39-2), and A. n. ninghainana Brechlin, 2012 (MOTU39-3). These lineages show very low intrasubspecific K2P COI distances (0.18–0.40%) (fig. 2), consistent with typical intraspecific variation. Yet, the intersubspecific K2P COI distances between them (1.79–2.03%) exhibited a characteristic ‘intermediate state’. They were substantially greater than routine intraspecific divergence (>1%), though they remained below the Actias-specific interspecific threshold of 2.05% established in this study. This empirical range for intersubspecific COI divergences provides another quantitative baseline to help interpreting COI genetic distances in Actias.
Neighbour-joining tree (A), K2P COI distance (B), and geographical distribution (C) of potential subspecies in MOTU39 (A. ningpoana).

Figure 2 Long description
The image consists of three parts: A) A phylogenetic tree illustrating the relationships among subspecies of Actias ningpoana. The tree includes MOTU39-1, MOTU39-2 and MOTU39-3, with respective sample sizes indicated in parentheses. B) A matrix displaying K2P COI distances between the subspecies. The matrix uses circles of varying sizes and colors to represent genetic distances, with a scale ranging from 0.01 to 0.02. C) A map showing the geographical distribution of the subspecies. Locations for MOTU39-1 (Actias ningpoana ningtaibaishana), MOTU39-2 (Actias ningpoana ningtaiwana) and MOTU39-3 (Actias ningpoana ninghainana) are marked with different symbols and colors, indicating their specific regions.
Accordingly, we define a practical operational criterion for subspecific distinction in Actias as a K2P COI distance range of >1.00% to <2.05%. This criterion was applied to evaluate other potential subspecies within the genus. Furthermore, in line with the logic of Núñez et al. (Reference Núñez, Genaro, Miller, Barro-Cañamero, Álvarez, Fernández, Minno, Turner, Turlan, Wahlberg, Pérez-Asso and Hausmann2023), we interpret any lineage that is separated by a barcode gap exceeding 2.05% from its nearest conspecific population as having reached species-level distinction.
Assessment of infraspecific diversity and potential subspecies
Following the clarification of species boundaries, we investigated complex internal genetic structures within several MOTUs to assess infraspecific diversity. Our analysis integrated the genus-specific K2P COI distance criterion (1.00–2.05%) with phylogenetic, geographical, and population genetic (Fst) evidence to evaluate putative subspecies boundaries.
Within A. ningpoana (MOTU39), the nominal subspecies A. n. ningpoana (89 specimens) comprised 5 distinct subclades (fig. 2A). These subclades exhibited significant COI differentiation (Fst = 0.35–0.91) (table S5), with K2P COI distances in the range 0.56–1.19% (fig. 2B, C), falling within the subspecific threshold range, despite their largely sympatric distribution. Given this substantial differentiation that exceeds typical intraspecific variation, but that does not warrant species-level distinction, we interpret these as well-differentiated infraspecific subclades, the taxonomic status of which awaits clarification by incorporating more integrative data in future study.
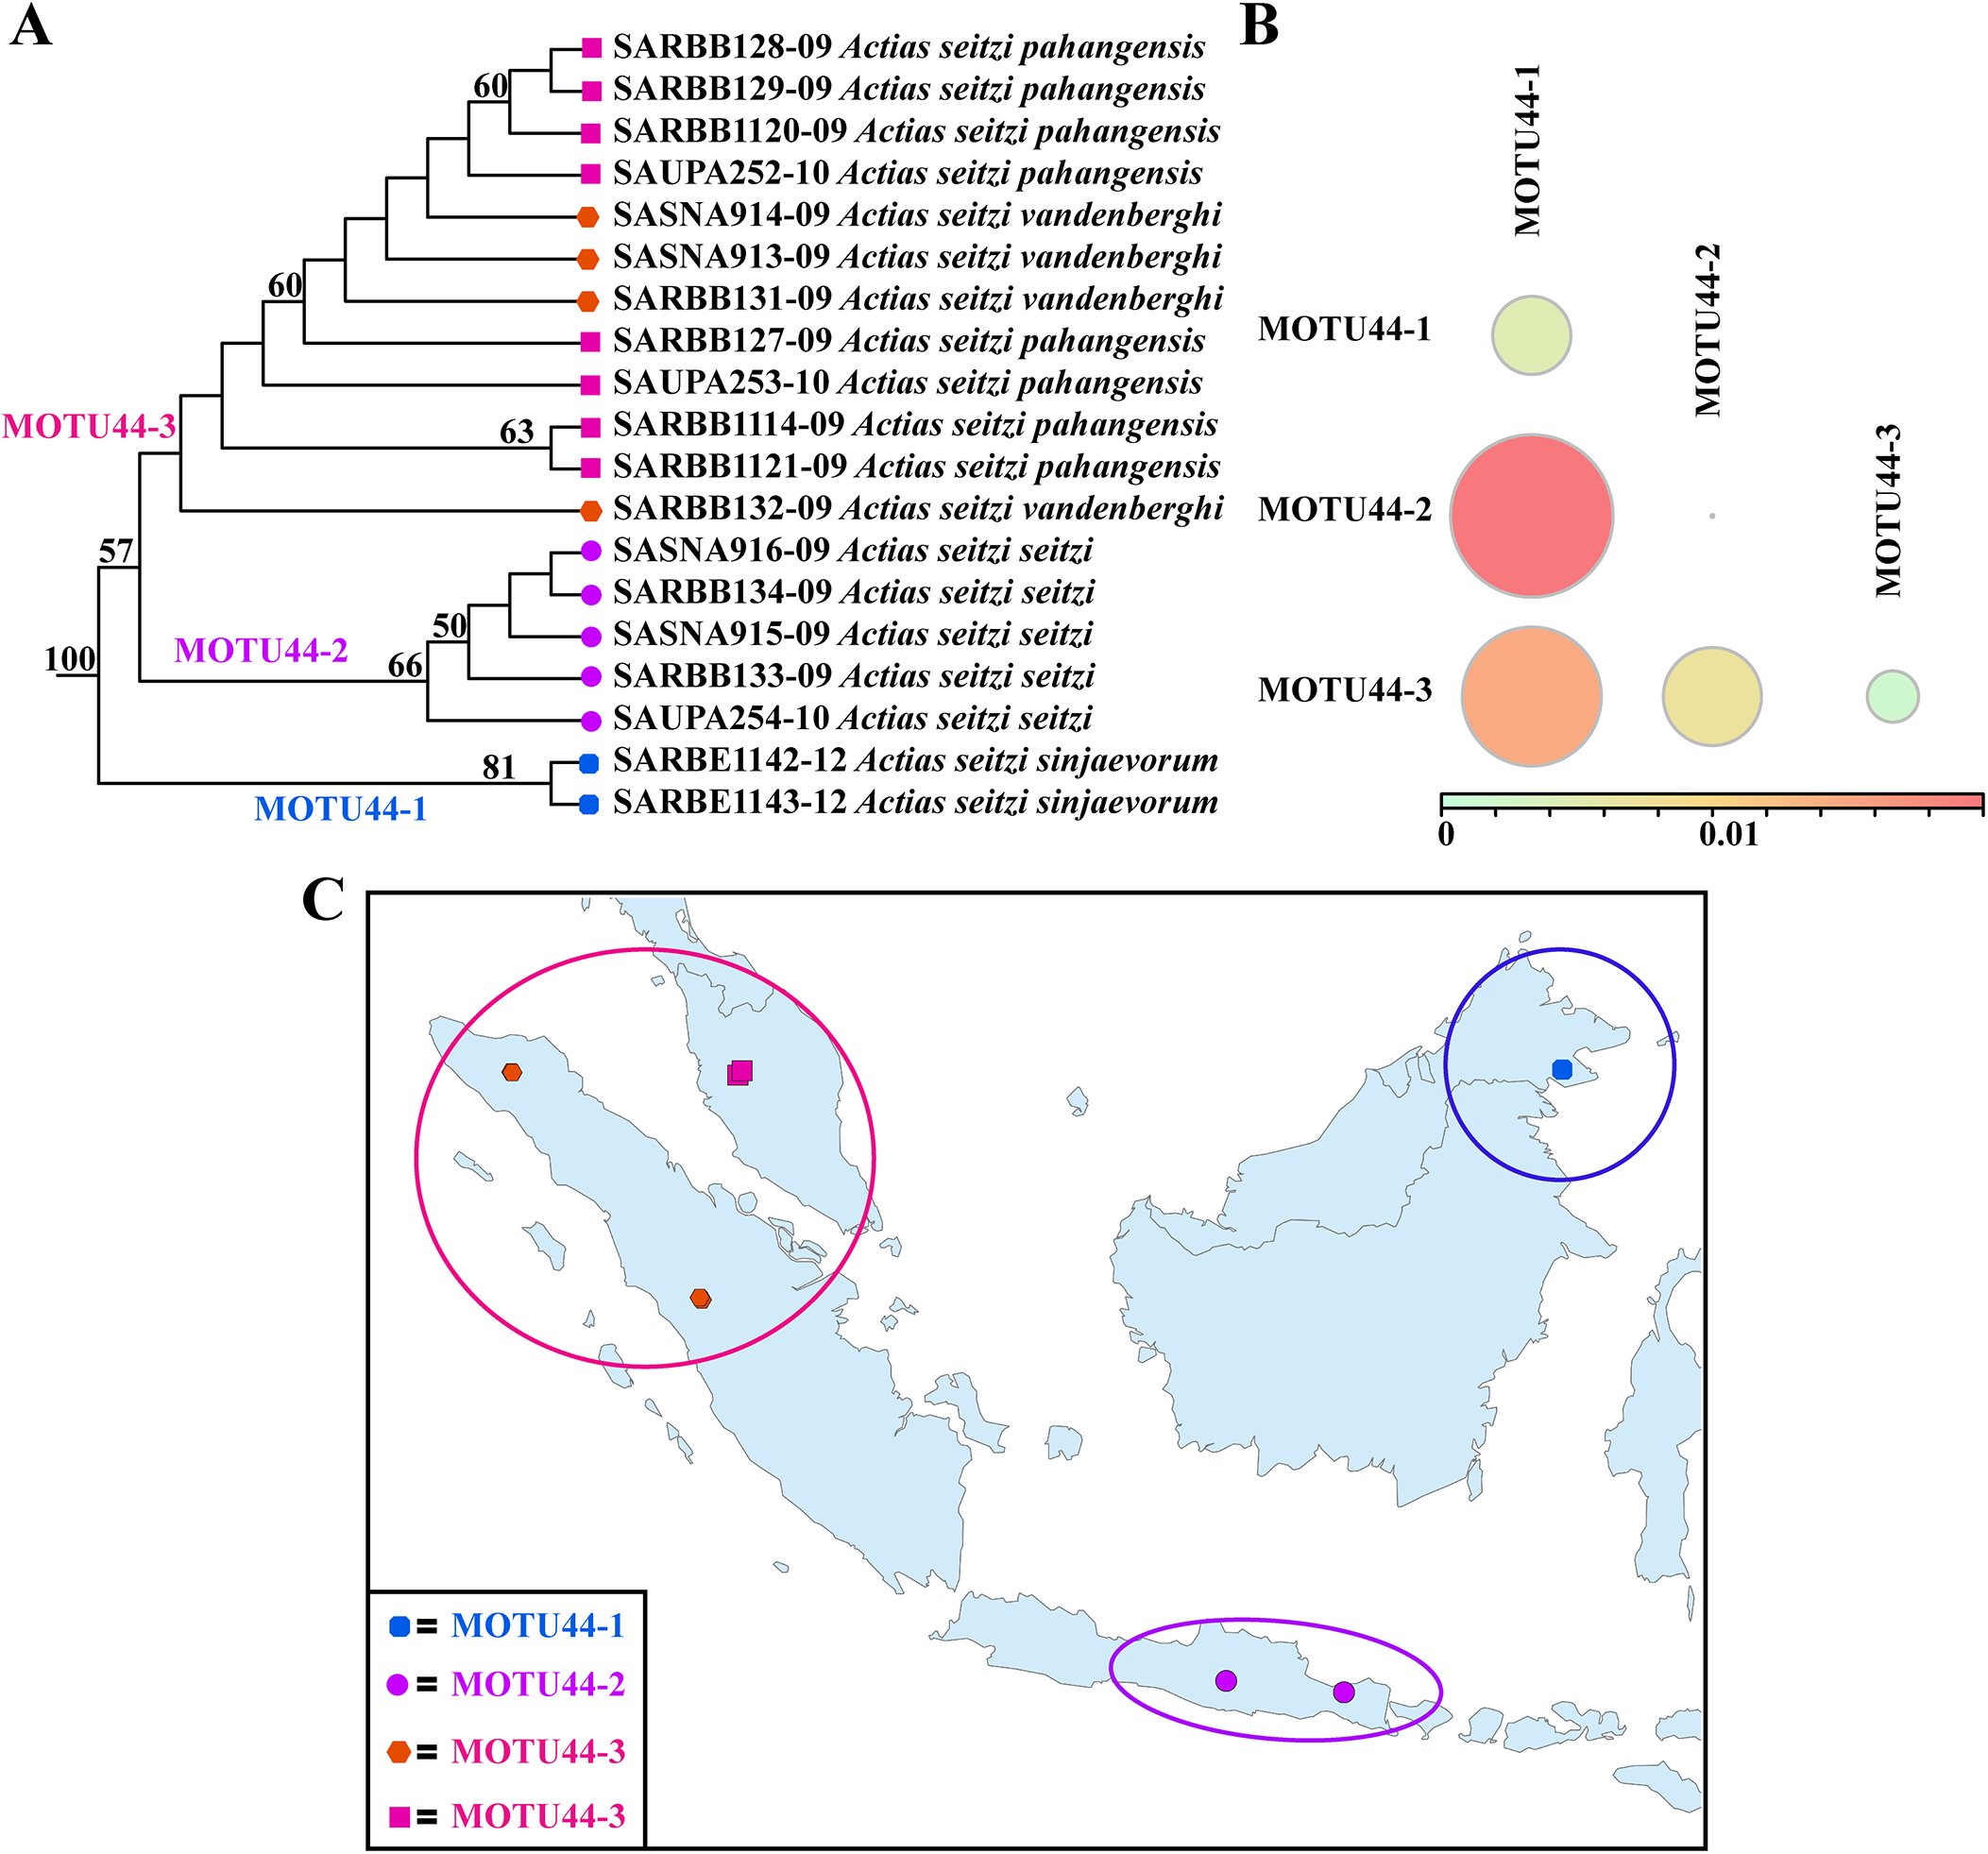
Conversely, the case of Actias seitzi Kalis, 1934 (MOTU44) provided a compelling, three-tiered demonstration of how our framework resolved complex infraspecific taxonomy by integrating multiple lines of evidence. Phylogenetic analysis grouped the morphologically defined A. s. pahangensis Brechlin, 2012 and A. s. vandenberghi (GBIF Secretariat, 2023) into a single, mixed subclade (MOTU44-3). This consolidation was strongly supported by their mean K2P COI distance of 0.17% (fig. 3), adjacent geographical distributions, and a negligible population genetic differentiation (Fst = 0.102) (table S6). Collectively, this suggests that they represent a single interbreeding population and thus are better interpreted as a single subspecies. We therefore propose the synonymization of these two subspecific names. The case of A. s. sinjaevorum Brechlin, 2012 (MOTU44-1) provides an intermediate scenario. Its mean K2P COI distances to the other subclades (0.83% and 1.11%) approached or fall within the lower bound of the proposed subspecific threshold. This, together with its clearly allopatric distribution, provides compelling evidence for its recognition as a distinct subspecies. Finally, the distinction between the consolidated MOTU44-3 and A. s. seitzi (MOTU44-2) was critically supported by population genetic evidence (fig. 3C). Despite a mean intersubspecific K2P COI distance (0.44%), their allopatric distributions and a high pairwise Fst value (> 0.76) (table S6) suggest a pronounced lack of gene flow and substantial genetic differentiation, robustly supporting their status as distinct subspecies. Thus, across a spectrum of genetic divergence, the integration of phylogenetic, genetic, and geographic evidence robustly supported the recognition of three, rather than four, valid subspecies within the A. seitzi complex.
Neighbour-joining tree (A), K2P COI distance (B), and geographical distribution (C) of one species and three subspecies in MOTU44 (A. seitzi).

Figure 3 Long description
The diagram consists of three panels labeled A, B and C. Panel A displays a neighbor-joining tree illustrating the phylogenetic relationships among Actias seitzi MOTU groups. The tree includes four main clades labeled MOTU44-1, MOTU44-2, MOTU44-3 and MOTU44-4, with bootstrap values such as 60, 61, 63, 57 and 100 supporting the branches. Panel B shows a genetic distance plot with K2P COI distances among the MOTU groups. The plot features four differently sized circles representing MOTU44-1, MOTU44-2, MOTU44-3 and MOTU44-4, with a horizontal scale ranging from 0 to 0.01. The size of the circles indicates the relative genetic distances, with MOTU44-2 having the largest circle. Panel C is a map depicting the geographical distribution of the MOTU groups. The map highlights distinct regions for each group, indicating their allopatric distributions. Each MOTU group is marked with a different color on the map, corresponding to their labels in the other panels, showing their specific locations.
Re-assessment of species boundaries: evidence for consolidation and division
Equipped with the empirically derived species (2.05%) and subspecies (1.00–2.05%) COI divergence thresholds, we next applied this two-tiered framework to systematically re-evaluate the taxonomic status of the 15 MOTUs that conflicted with prior morphological classifications.
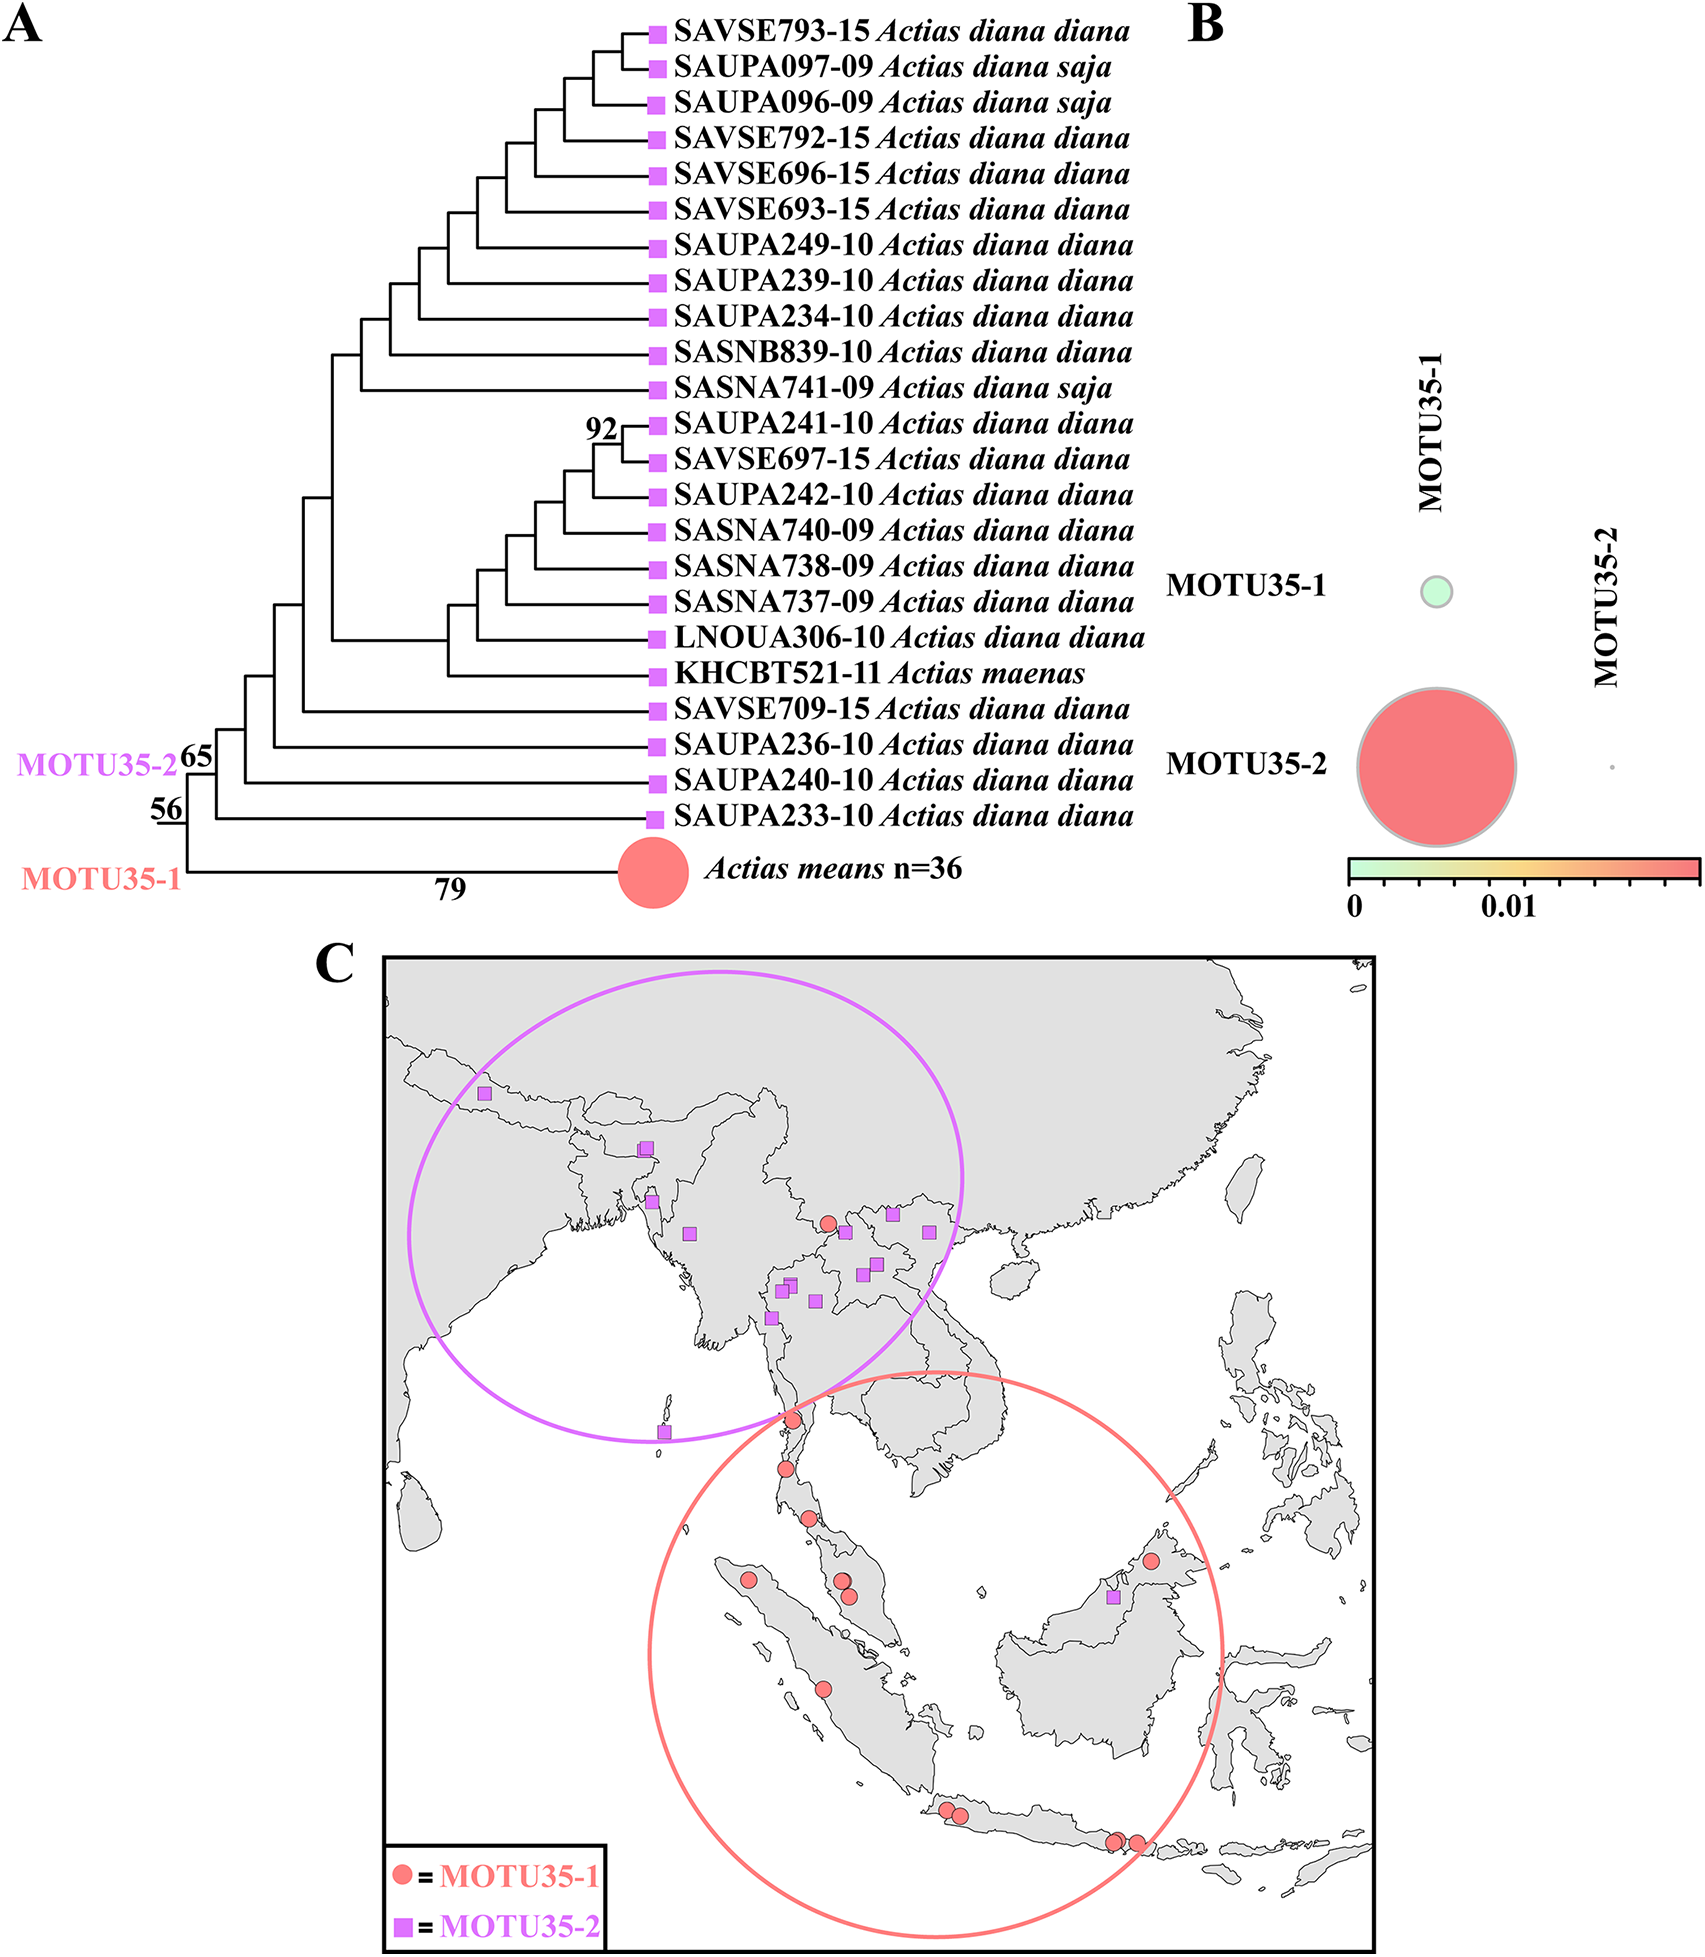
The taxonomic relationship between Actias maenas (Doubleday, 1847) (MOTU35-1, n = 36) and A. diana Maassen, 1872 (MOTU35-2, n = 22) has been historically unstable. Our COI data reveal that both entities form a well-supported clade with a maximal K2P COI distance of 1.54% between specimens (fig. 4), which falls within the Actias-specific subspecific threshold range (1.00–2.05%). Their largely allopatric distributions, with minimal range overlap, provide additional evidence for a subspecific interpretation, in line with the historical treatment of A. diana as a subspecies of A. maenas. The integrated evidence hence supports the subspecific classification of A. diana (as A. maenas diana). Regarding the infraspecific structure within ‘A. diana’ (MOTU35-2), the available sequences (n = 22) of two subspecies A. d. diana and A. d. saja were intermingled in the phylogeny and exhibited minimal COI divergences (0.15–0.45%), consistent with population-level variation rather than subspecific differentiation. Therefore, we do not uphold this subspecific division of MOTU35-2.
Neighbour-joining tree (A), K2P COI distance (B), and geographical distribution (C) of one species and two subspecies in MOTU35 (A. maenas and A. diana).

Figure 4 Long description
The infographic consists of three parts: A, B and C. A) The phylogenetic tree displays the relationship between Actias maenas and Actias diana. It lists various specimens labeled as Actias diana diana and Actias diana saja, with numerical identifiers such as SAVE893-15 and SAUPA239-10. The tree shows a clade with Actias maenas n=36 and Actias diana n=22, with support values of 79 and 92. B) The K2P COI distance graph illustrates the genetic distance between MOTU35-1 and MOTU35-2. MOTU35-1 is represented by a large circle, while MOTU35-2 is shown as a smaller circle. The x-axis is labeled with a range from 0 to 0.01. C) The geographical distribution map highlights the locations of MOTU35-1 and MOTU35-2. MOTU35-1 is marked with red circles and MOTU35-2 is marked with purple squares. The map covers regions in Asia, with overlapping areas indicated by circles.
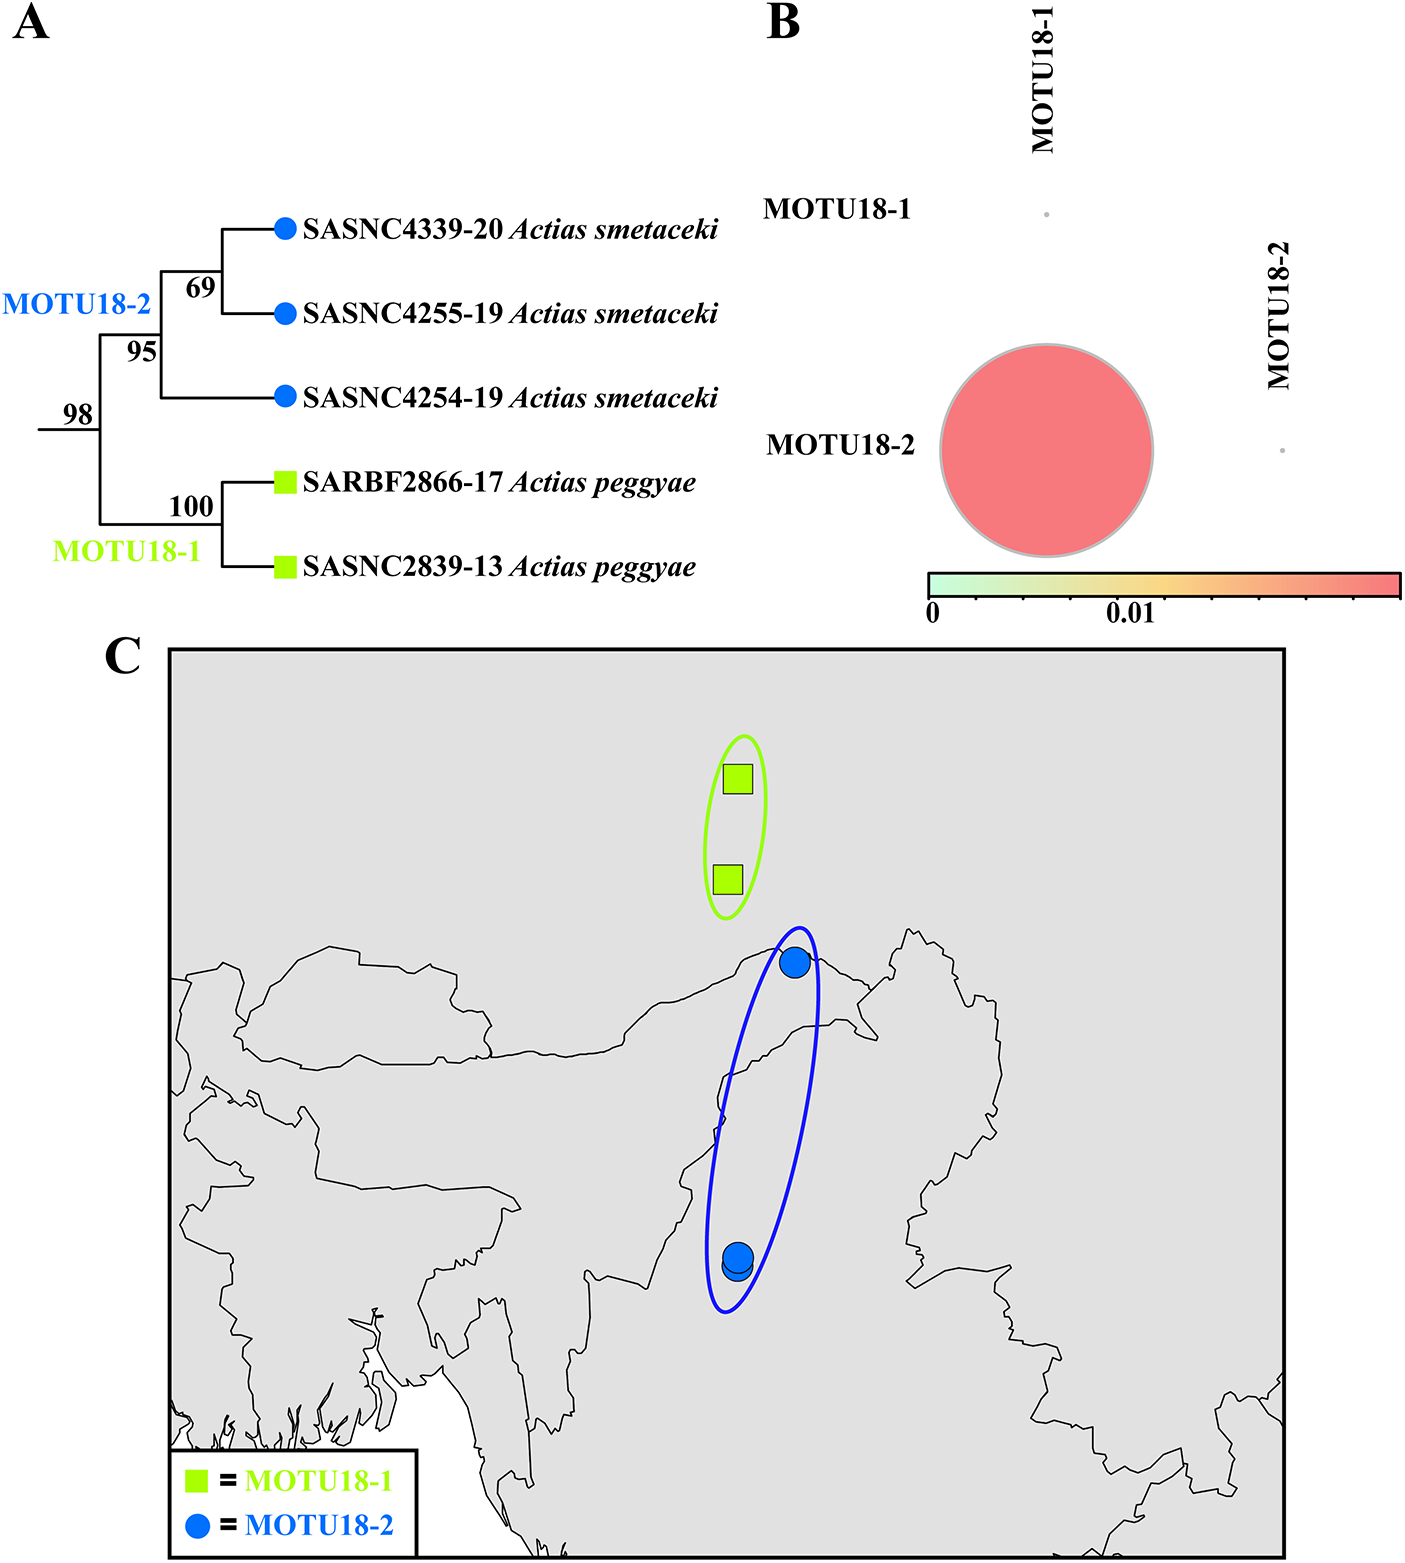
Similarly, MOTU18 contained sequences of both Actias peggyae Brechlin, 2017 (n = 2) and A. smetaceki Naumann, 2023 (n = 3). The maximal K2P COI distance of 1.36% between them fell within the subspecific threshold (fig. 5), and their distributions were largely allopatric. Following the rationale applied for A. diana and A. maenas, the evidence supported treating A. smetaceki as a subspecies of A. peggyae.
Neighbour-joining tree (A), K2P COI distance (B), and geographical distribution (C) of one species and two subspecies in MOTU18 (A. smetaceki and A. peggyae).

Figure 5 Long description
The figure contains three parts labeled A, B and C. A) A neighbour-joining tree shows two groups: MOTU18-2 and MOTU18-1. MOTU18-2 contains three specimens labeled SASNC4339-20 Actias smetaceki, SASNC4255-19 Actias smetaceki and SASNC4254-19 Actias smetaceki. MOTU18-1 contains two specimens labeled SARBF2866-17 Actias peggyae and SASNC2839-13 Actias peggyae. Bootstrap support values visible on branches are 69, 95, 98 and 100. B) The K2P COI distance graphic shows a horizontal scale bar labeled 0 to 0.01. A large circle is plotted near the MOTU18-2 label and a small circle is plotted near MOTU18-1. The relative sizes indicate greater within-group distance for MOTU18-2 compared to MOTU18-1. C) The thematic map shows the geographical distribution of MOTU18-1 and MOTU18-2 across a region that includes outlines consistent with East Asia, including what appears to be a large landmass with river or boundary lines. North is at the top. The legend identifies square symbols as MOTU18-1 and circular symbols as MOTU18-2. Two square markers for MOTU18-1 are positioned in the upper central portion of the map. Two circular markers for MOTU18-2 are positioned further south and east. An outlined ellipse surrounds the MOTU18-2 markers, as drawn on the map. MOTU18-1 markers occur at a more northerly position than MOTU18-2 markers and the two groups do not share the same marker locations.
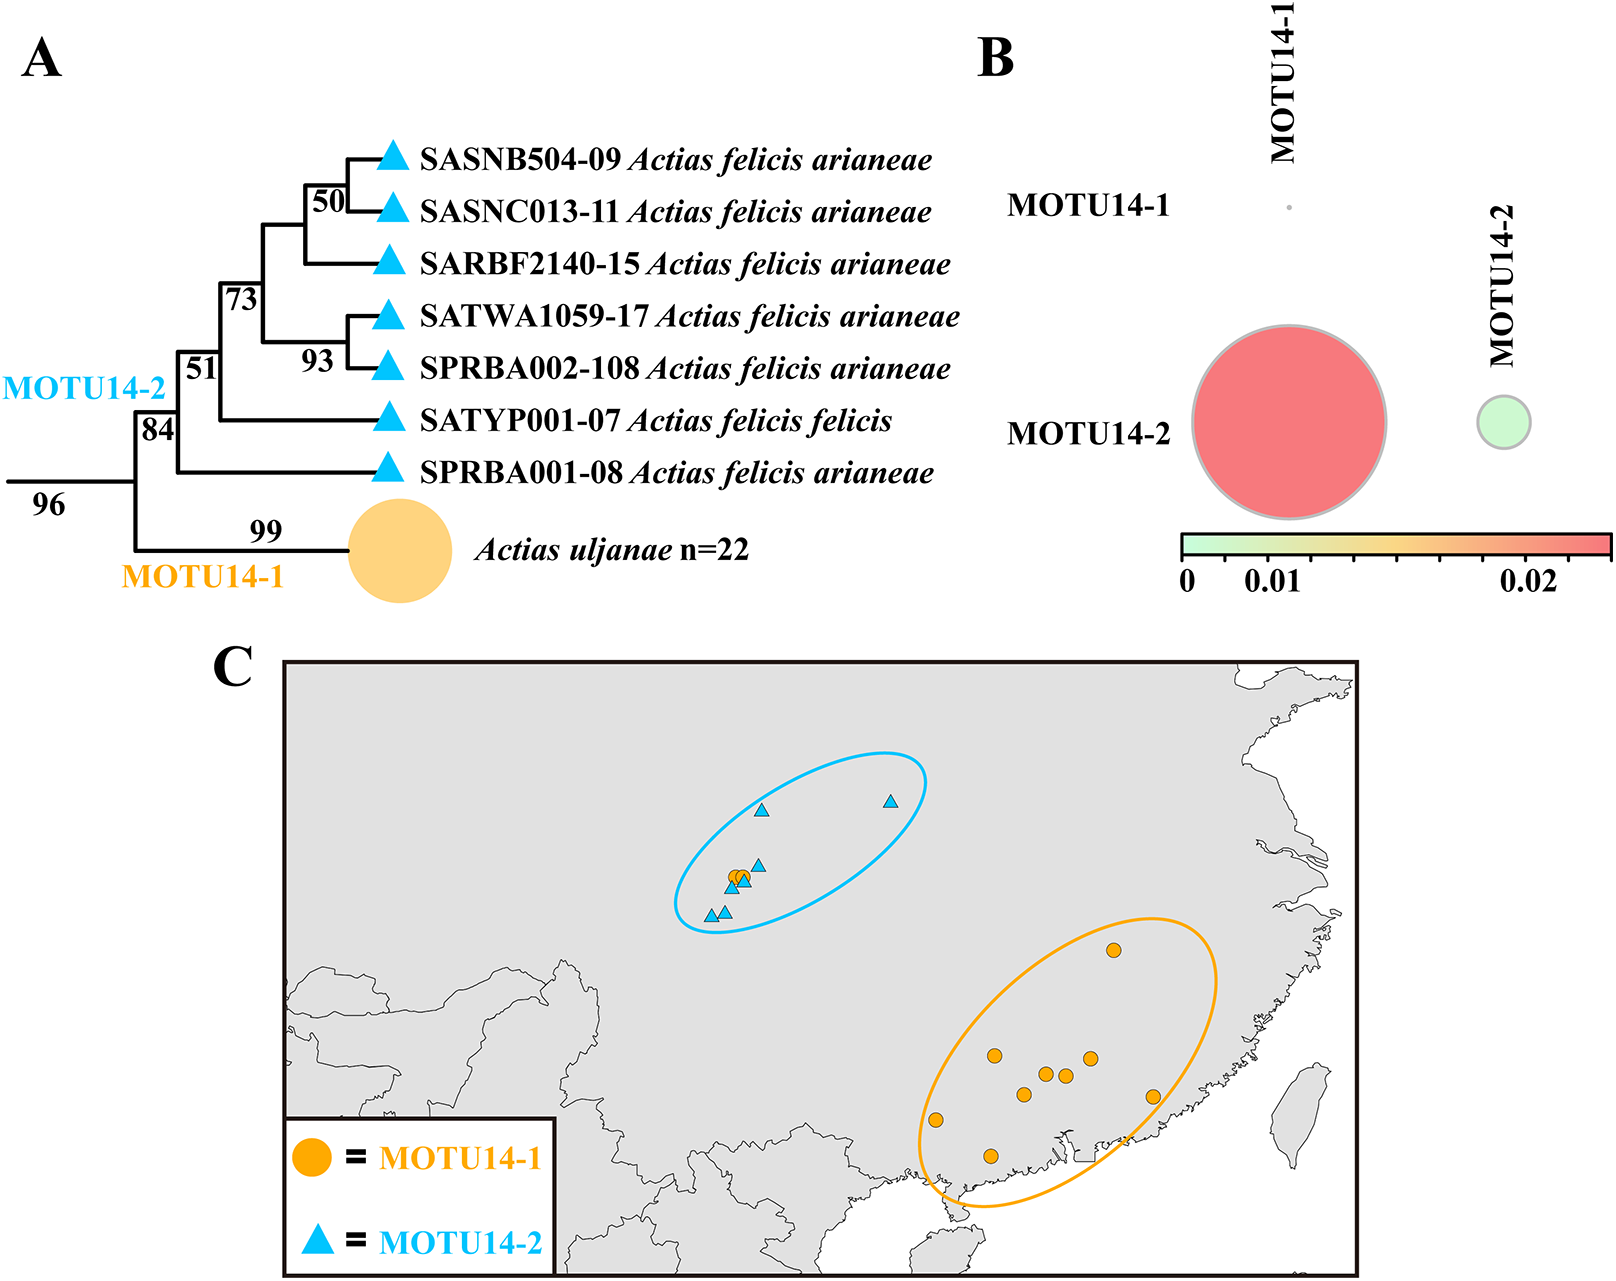
The same rationale was also applied to Actias felicis (Oberthür, 1896) and A. uljanae Brechlin, 2007, two distinct, but monophyletic, morphospecies (see for A. felicis MOTU14-2 (n = 7) and for A. uljanae MOTU14-1 (n = 22) in fig. 6A). However, they are separated by a mean K2P COI distance of 1.83%, which is in the 1.00–2.05% range, suggesting that they might be interpreted as subspecies of the same species (fig. 6B). Their largely allopatric distributions (fig. 6C) further support the subspecific relationship. This reclassification applies to the relationship between A. uljanae and the A. felicis complex as a whole. Within the A. felicis complex, the low K2P COI distances (0.76–0.92%) between the single sequence of the nominal subspecies A. f. felicis and all sequences of A. f. arianeae Brechlin, 2007 support their current status as conspecific. A definitive assessment of the subspecific boundary between A. f. felicis and A. f. arianeae, however, requires a larger sample size for the nominal subspecies and remains a focus for future research.
Neighbour-joining tree (A), K2P COI distance (B), and geographical distribution (C) of potential subspecies in MOTU14 (A. felicis and A. uljanae).

Figure 6 Long description
The image consists of three panels labeled A, B and C. Panel A displays a neighbor-joining tree with two main clades, MOTU14-1 and MOTU14-2. MOTU14-1 includes Actias uljanae with 22 samples, while MOTU14-2 consists of Actias felicis arianeae with various samples labeled SASNB504-09, SASNC013-11, SARBF21409-15, SATWA1059-17, SPRBA002-108, SATYP001-07 and SPRBA001-108. The tree shows bootstrap values at nodes, with 99 percent supporting the separation between MOTU14-1 and MOTU14-2. Panel B illustrates a K2P COI genetic distance graph, with MOTU14-1 and MOTU14-2 represented by circles of different sizes and colors, indicating genetic distance. The x-axis ranges from 0.01 to 0.02. Panel C maps the geographical distribution of the subspecies, with MOTU14-1 marked in orange and MOTU14-2 in blue. The map shows distinct regions in Asia where each subspecies is found, with orange and blue circles indicating their respective locations.
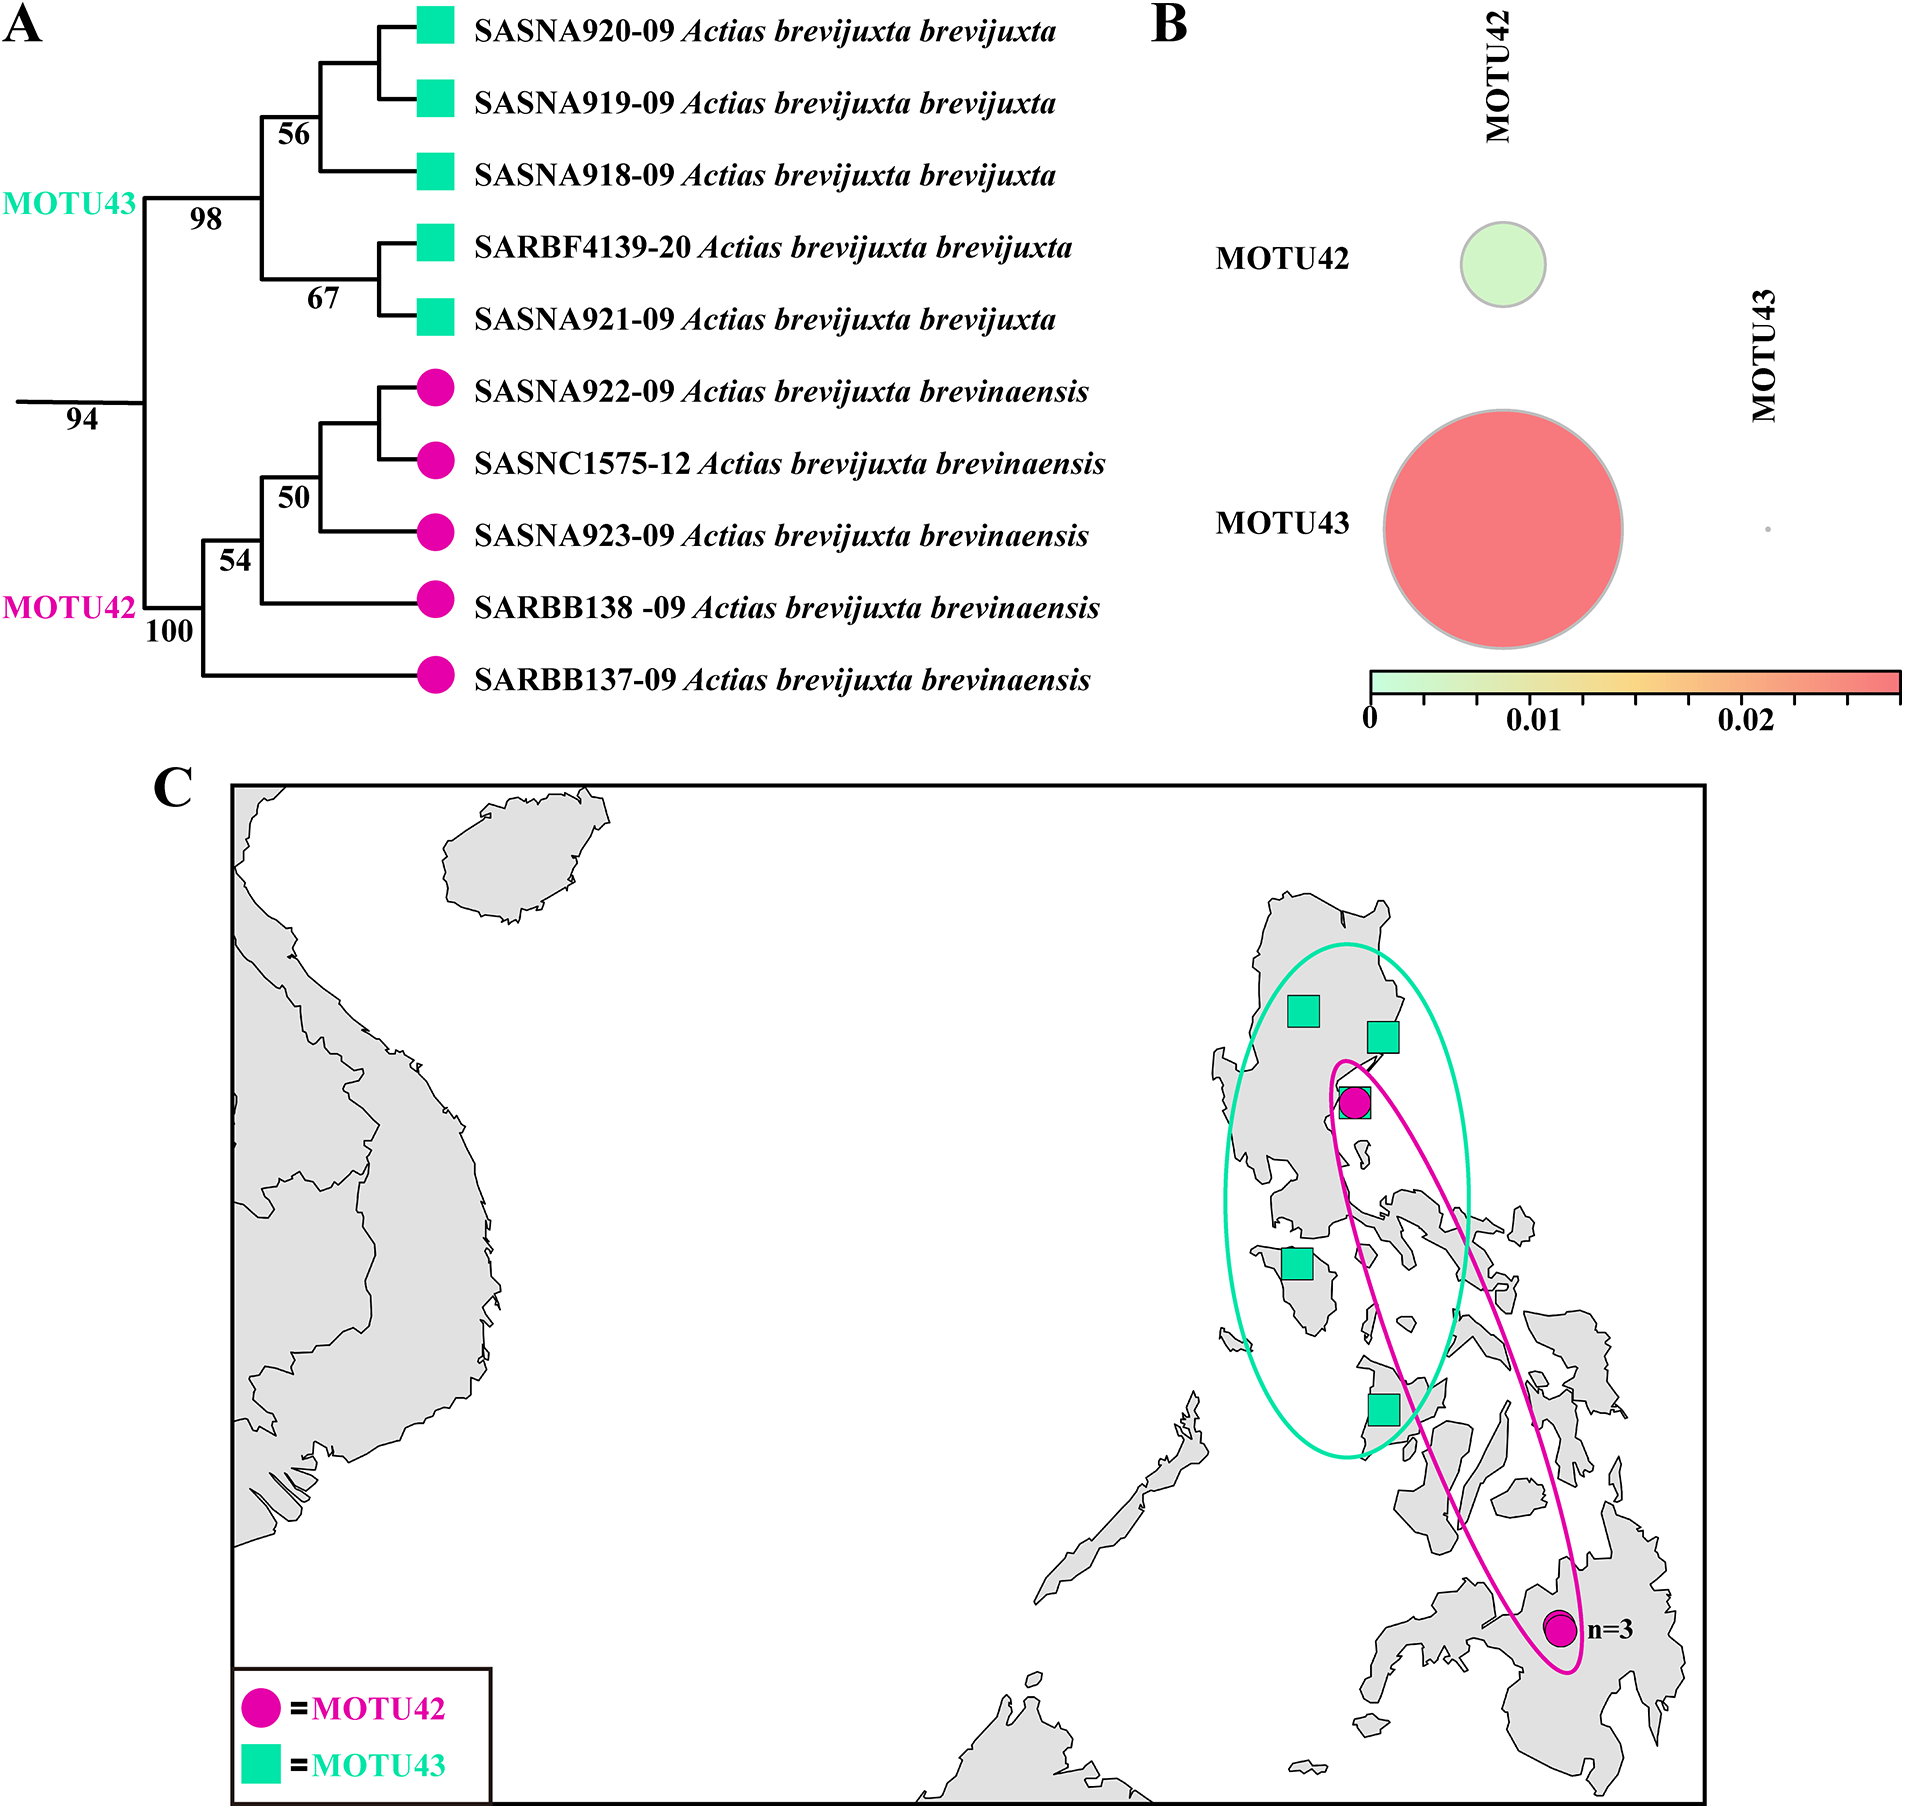
Based on morphology, 10 of the Actias specimens were recognized as representing 2 subspecies of A. brevijuxta Nässig & Treadaway, 1997, viz. A. b. brevijuxta and A. b. brevinaensis Brechlin, 2012. Our DNA barcoding analysis grouped these specimens into two well-supported MOTUs (MOTU42 and MOTU43; fig. 7), separated by a mean K2P COI distance of 2.19%, which exceeds the species-level threshold for the genus Actias. These two MOTUs also have largely allopatric distributions with only a minor zone of sympatry. Hence, the COI and biogeographical evidences support their recognition as distinct species.
Neighbour-joining tree (A), K2P COI distance (B), and geographical distribution (C) of two species in MOTU42 and MOTU43 (A. brevijuxta).

Figure 7 Long description
The infographic consists of three parts: A, B and C. A) The phylogenetic tree displays the relationship between Actias brevijuxta subspecies. It includes two main groups, MOTU42 and MOTU43, with respective specimens labeled as SASNA920-09, SASNA919-09, SASNA918-09, SARBF319-09, SASNA921-09, SASNA922-09, SASNC1575-12, SASNA923-09, SARBB138-09 and SARBB137-09. The tree shows bootstrap values of 99, 94 and 100. B) The K2P COI distance diagram illustrates the genetic distance between MOTU42 and MOTU43. MOTU42 is represented by a smaller circle, while MOTU43 is shown as a larger circle. The scale ranges from 0.00 to 0.02. C) The geographical distribution map indicates the locations of MOTU42 and MOTU43 in the Philippines. MOTU42 is marked with magenta circles and MOTU43 with green squares. The map highlights their largely allopatric distributions with a minor zone of sympatry.
Delineation of infraspecific diversity: assessment of subspecific boundaries
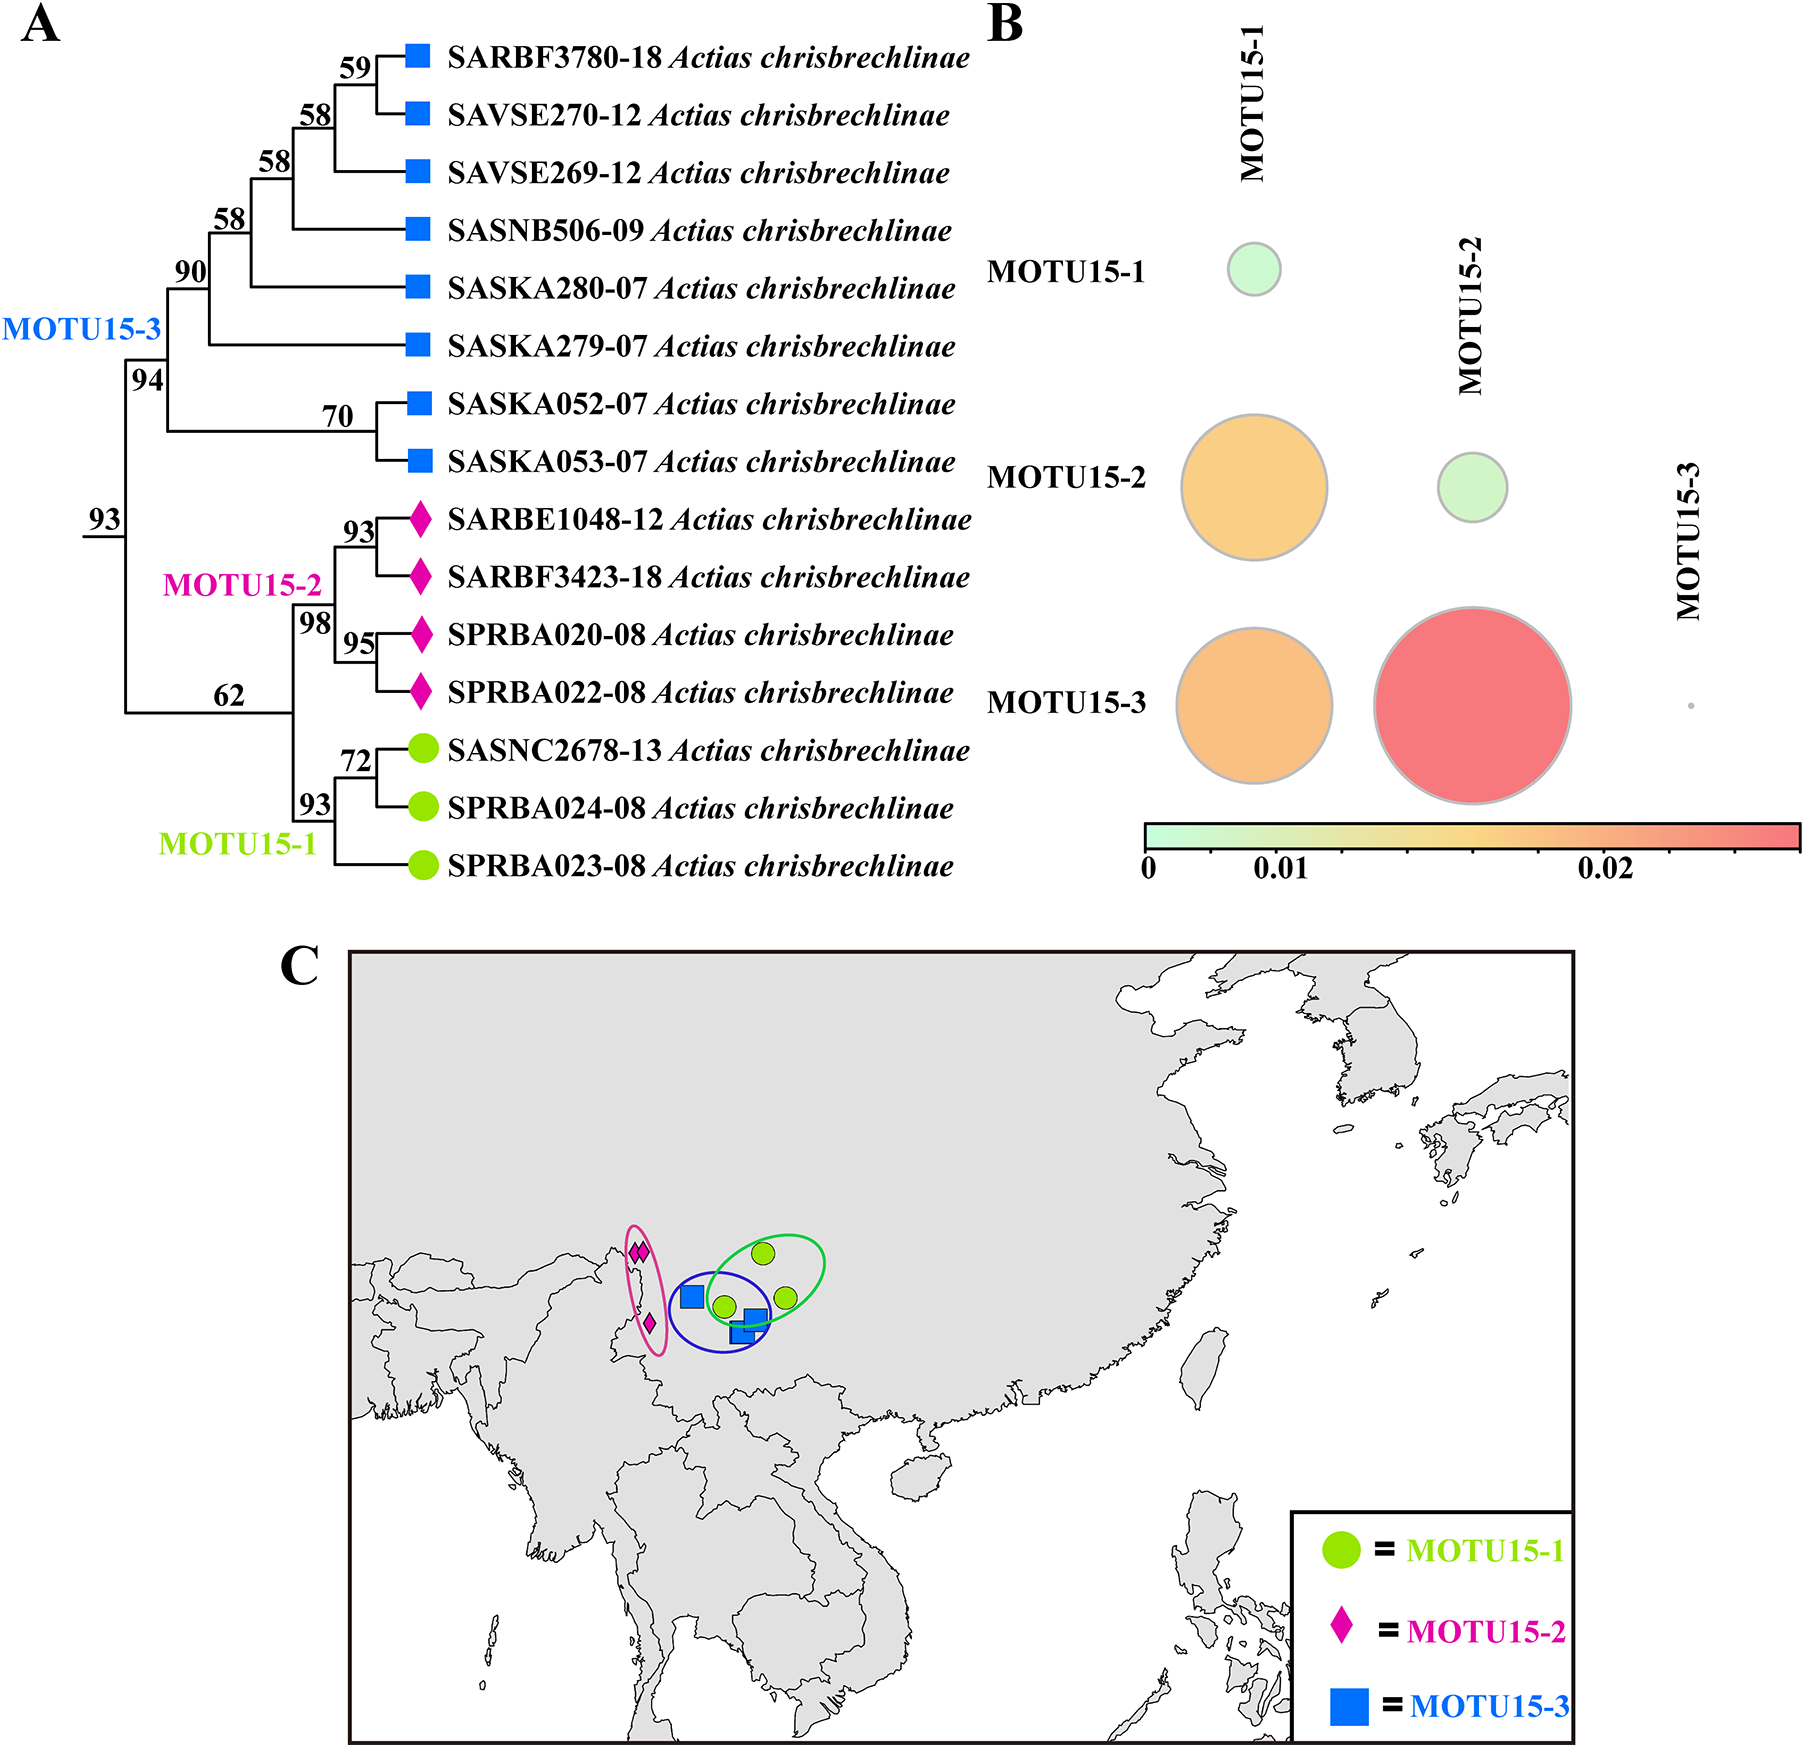
Phylogenetic analysis of 15 COI sequences of Actias chrisbrechlinae Brechlin, 2007 (MOTU15) yielded 3 well-supported subclades (fig. 8A). The mean K2P COI distance between these subclades was 1.55%, falling within the Actias-specific subspecific threshold range (fig. 8B). The three subclades also have large allopatric distributions (fig. 8C). Together, these evidences indicate that A. chrisbrechlinae comprises three well-differentiated, geographically structured infraspecific lineages. Formal description of these as subspecies, however, would require confirmation through an integrated morphological study.
Neighbour-joining tree (A), K2P COI distance (B), and geographical distribution (C) of potential subspecies in MOTU15 (A. chrisbrechlinae).

Figure 8 Long description
The image consists of three panels labeled A, B and C. Panel A displays a neighbor-joining tree of Actias chrisbrechlinae, showing three subclades labeled MOTU15-1, MOTU15-2 and MOTU15-3. Each subclade is represented by different colors: green for MOTU15-1, pink for MOTU15-2 and blue for MOTU15-3. The tree includes various sequences with labels such as SARBF3730-18 and SAVSE270-12, indicating their respective subclades. Bootstrap values are shown at the nodes, indicating the support for each clade. Panel B illustrates the K2P COI distance between the subclades, with circles of varying sizes representing the distances. The color gradient from green to red indicates the range of distances, with MOTU15-3 showing the largest distance. Panel C maps the geographical distribution of the subclades across a region in Asia, with colored outlines matching the subclade colors: green for MOTU15-1, pink for MOTU15-2 and blue for MOTU15-3. The map highlights the allopatric distribution of these subclades.
Resolution of complex taxonomic scenarios involving multiple levels
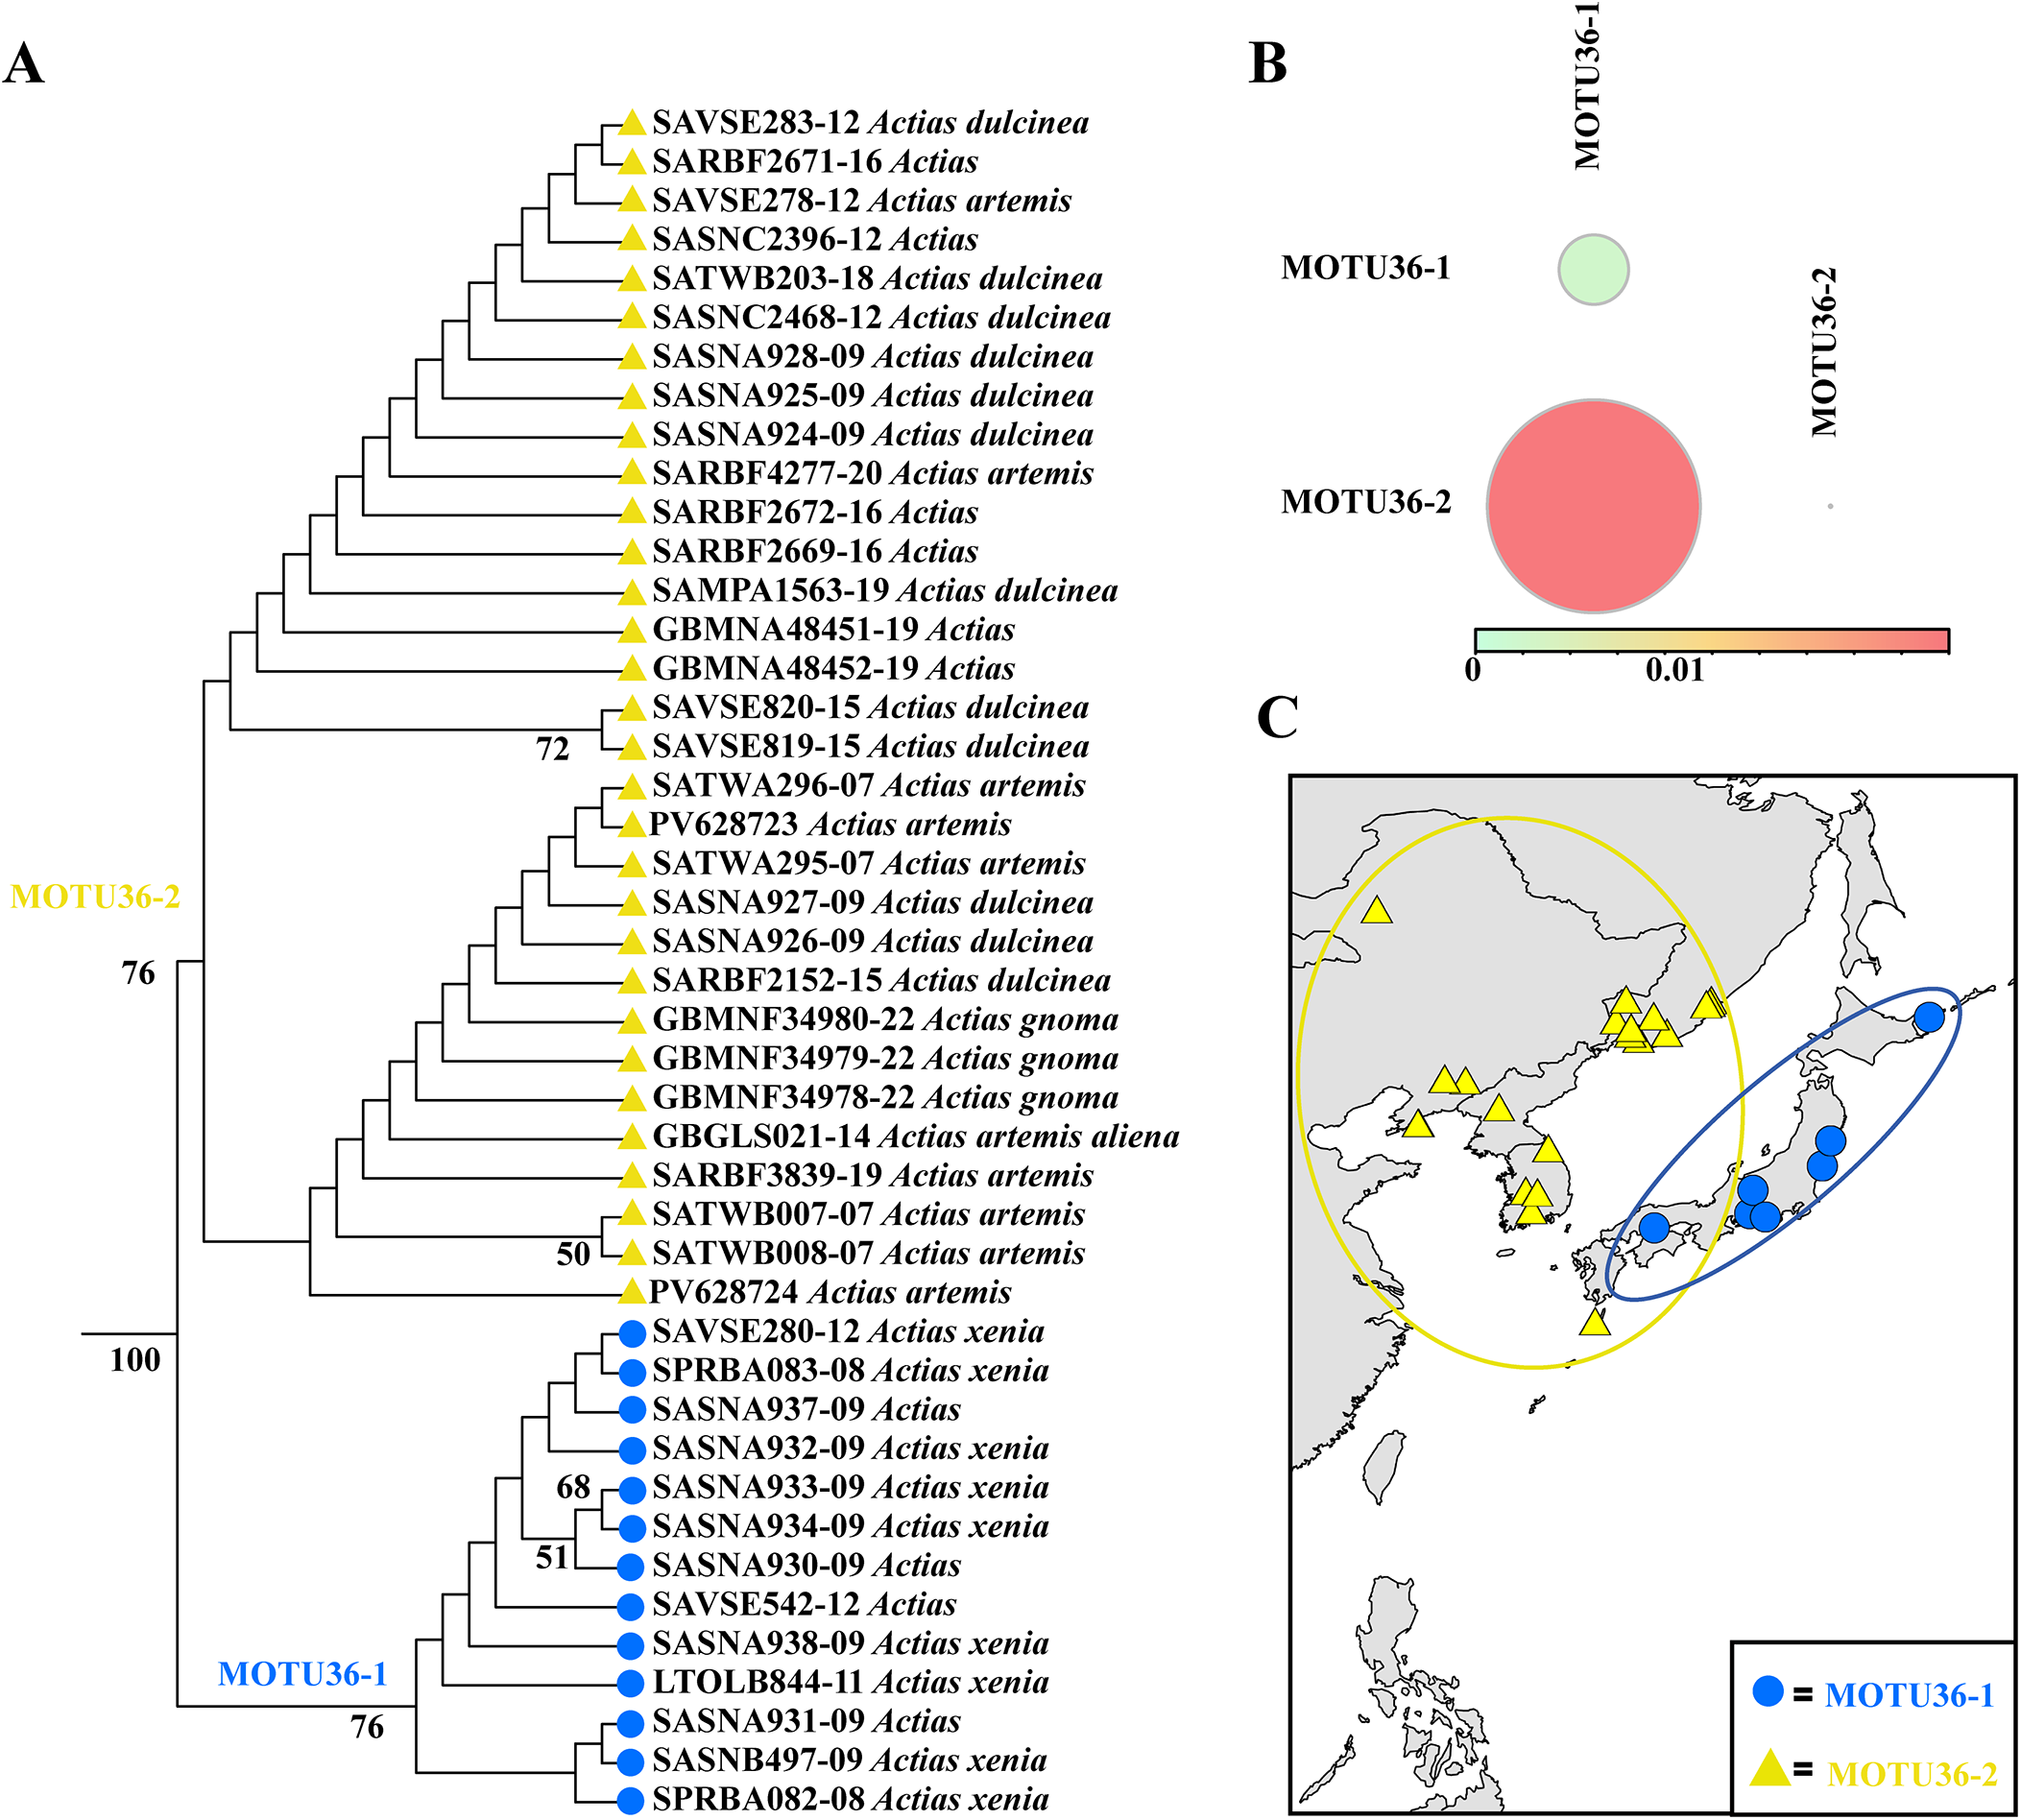
Actias artemis (Bremer & Grey, 1853), A. dulcinea (Butler, 1881), and A. xenia (Jordan, 1912) are three distinct morphospecies. Yet, DNA barcoding-based phylogenetic analysis showed that A. artemis (n = 8) and A. dulcinea (n = 12) form a mixed clade, suggesting that they may be conspecific. Moreover, although A. dulcinea/A. artemis (MOTU36-2, n = 20) and A. xenia (MOTU36-1, n = 9) form two clades (fig. 9A), their maximal K2P COI distance of 1.38% (fig. 9B) is in the 1.00–2.05% range, suggesting that they might be interpreted as subspecies. This interpretation is also supported by the largely disjunct distribution, with A. xenia primarily found in Japan and A. dulcinea/A. artemis in the neighbouring regions of China, North Korea, South Korea, and Russia (fig. 9C). Hence, this combined evidence suggests that these two clades are conspecific and may represent two subspecies.
Neighbour-joining tree (A), K2P COI distance (B), and geographical distribution (C) of potential subspecies in MOTU36 (A. artemis, A. dulcinea, and A. xenia).

Figure 9 Long description
The image consists of three panels labeled A, B and C. Panel A displays a neighbor-joining tree with branches representing different species. The tree is divided into two main clades: MOTU36-2, marked with yellow triangles and MOTU36-1, marked with blue circles. The clades are separated by bootstrap values, with 76 supporting the division between MOTU36-2 and MOTU36-1 and 100 supporting the internal branching within MOTU36-1. The species names, such as Actias dulcinea and Actias xenia, are listed alongside their respective branches. Panel B shows a genetic distance graph with two circles representing MOTU36-1 and MOTU36-2. The size of the circles indicates the genetic distance, with MOTU36-2 having a larger circle, suggesting a greater genetic distance. The color gradient bar below ranges from 0 to 0.01. Panel C illustrates the geographical distribution of the subspecies, with MOTU36-1 represented by blue circles and MOTU36-2 by yellow triangles. The map covers regions including Japan, China, North Korea, South Korea and Russia, with yellow and blue symbols indicating the locations where each subspecies is found. The yellow circle encompasses the distribution area of MOTU36-2, while the blue circle covers MOTU36-1.
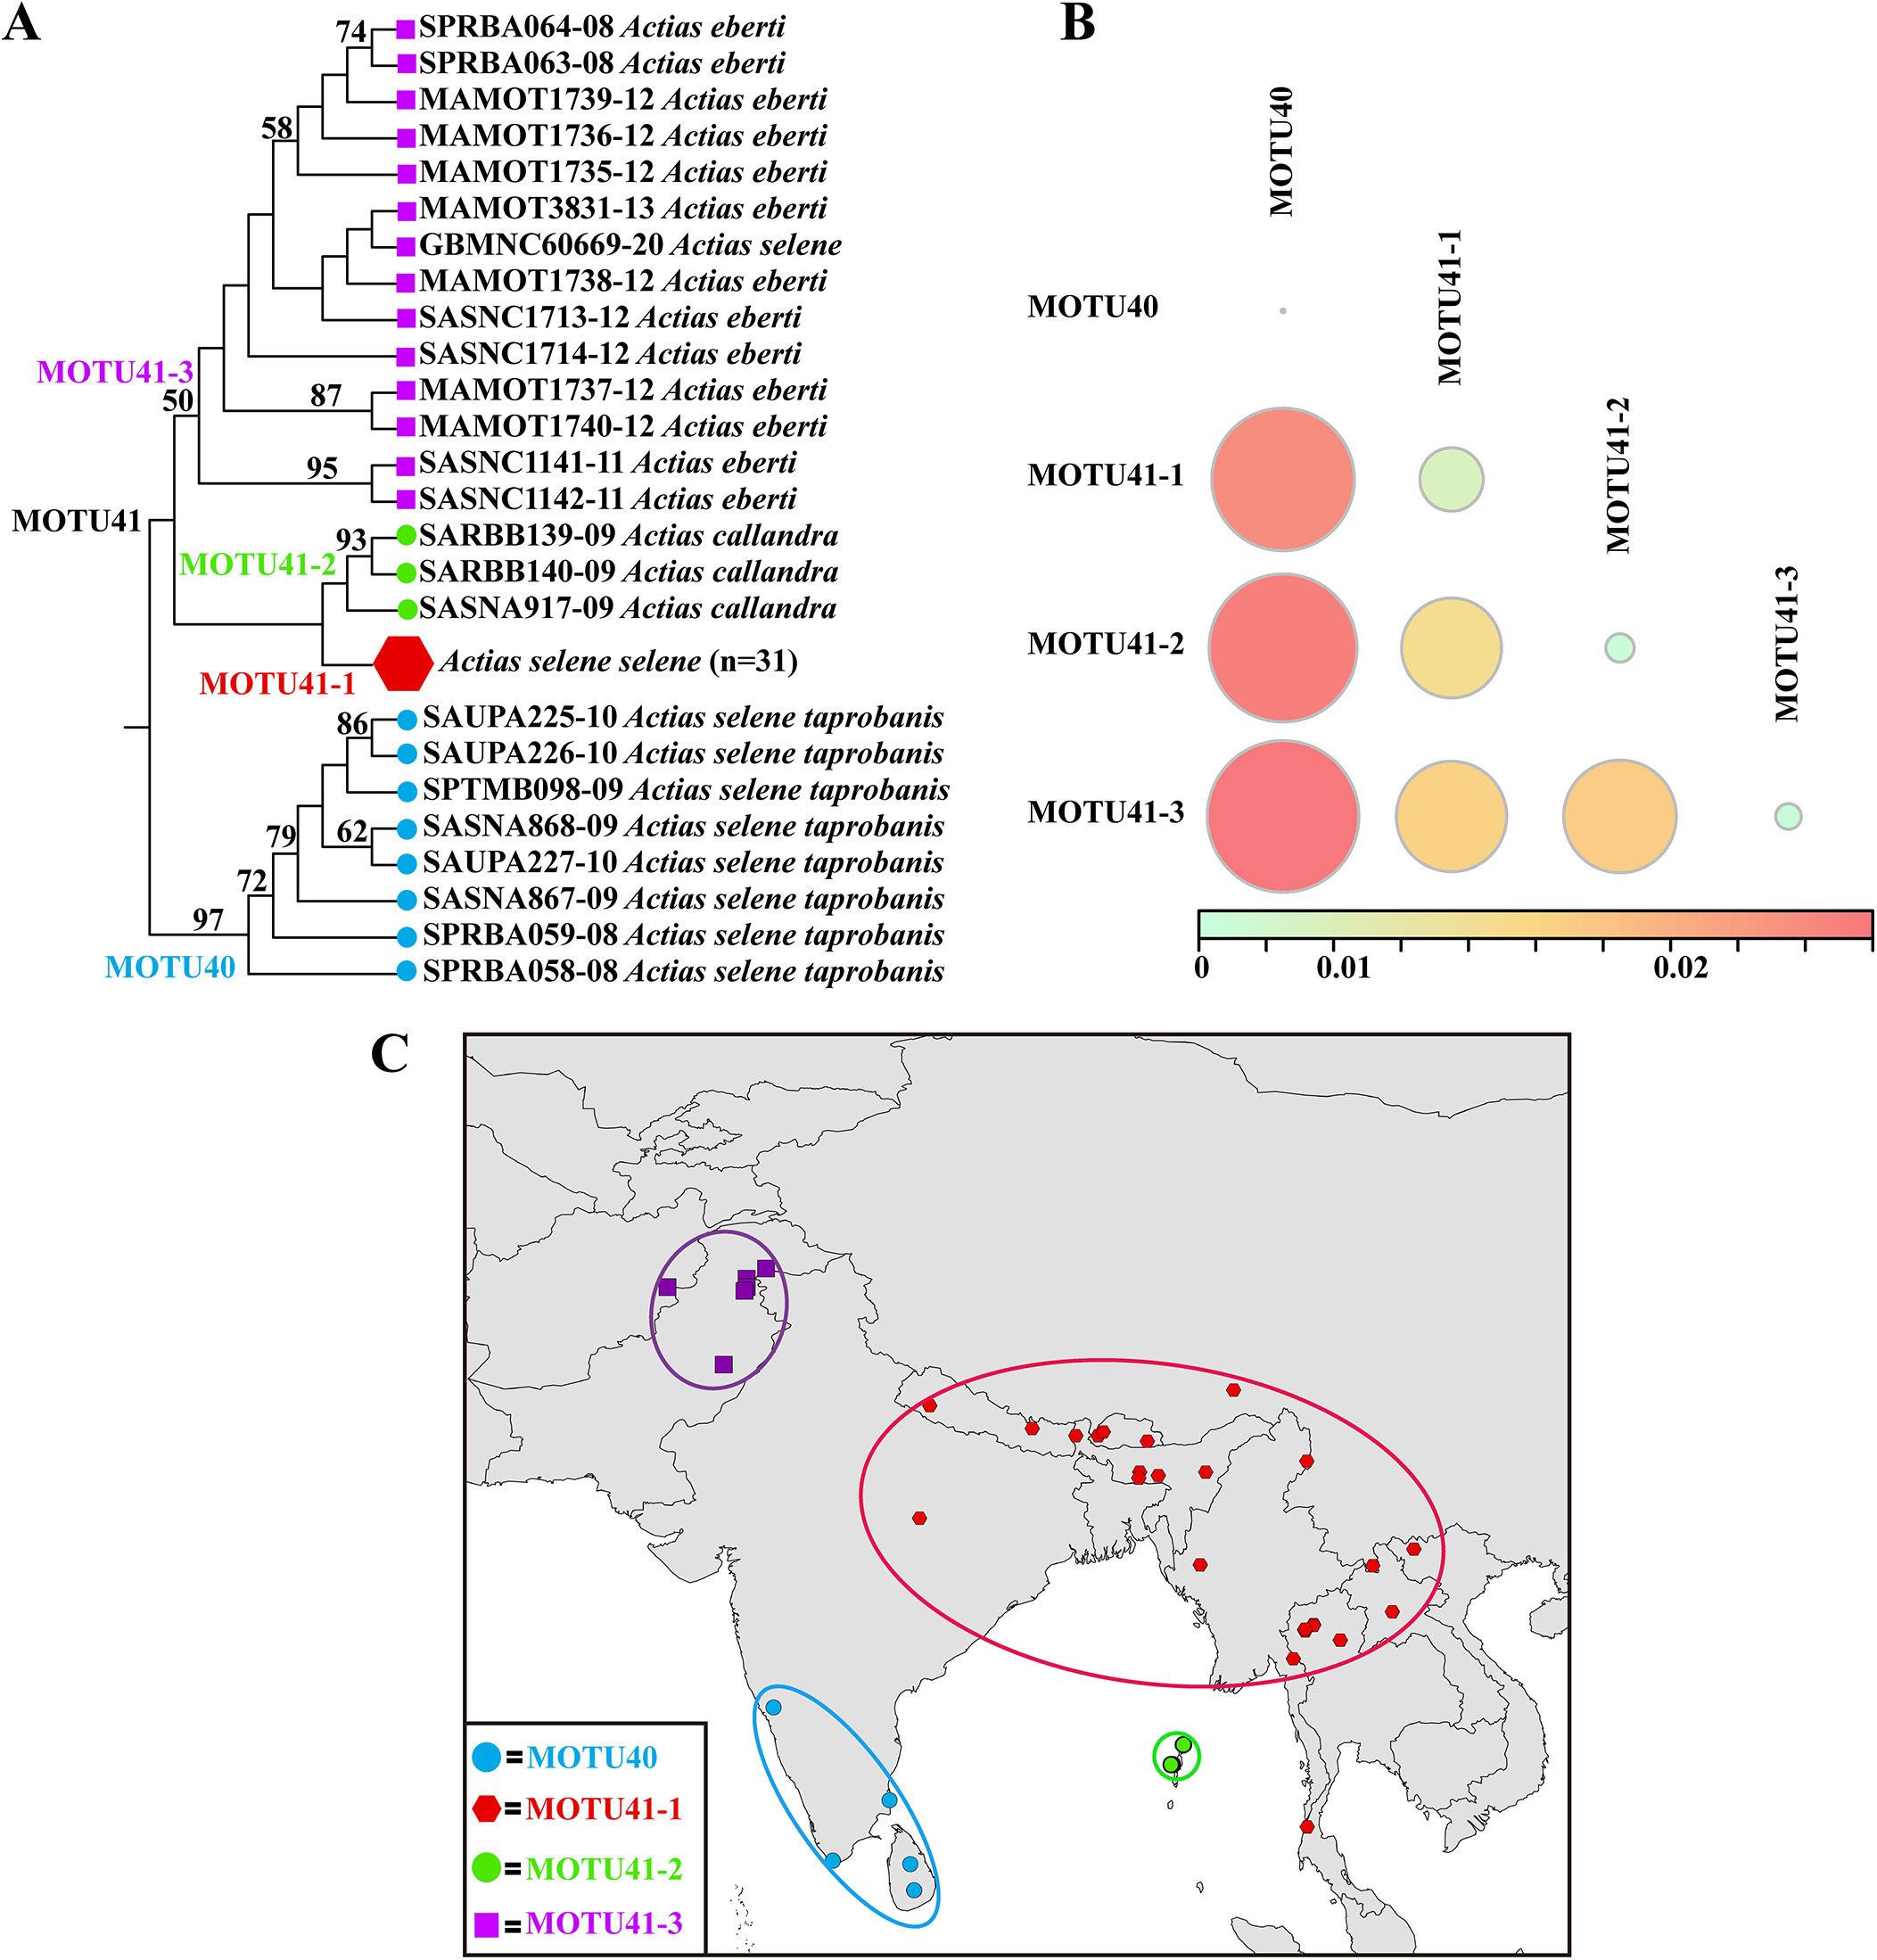
Actias selene (Hübner, 1807) is a widely distributed species in southern Asia. Phylogenetic analysis grouped A. selene (n = 40) into MOTU40 and MOTU41. MOTU40 contained 8 sequences of A. s. taprobanis Paukstadt & Paukstadt, 1999, and MOTU41 included 31 sequences of A. s. selene (MOTU41-1), 3 sequences of A. callandra Jordan, 1911 (MOTU41-2), and 40 sequences of A. eberti Rougeot, 1969 (MOTU41-3) (fig. 10A). The mean K2P COI distance between MOTU40 and MOTU41 was 2.15% (fig. 10B), which exceeds the species-level threshold. Moreover, these two MOTUs have widely separated distributions (fig. 10C). These combined evidences support their species-level distinction. Moreover, MOTU41-1 (A. s. selene), MOTU41-2 (A. callandra), and MOTU41-3 (A. eberti) are separated by a K2P COI distance range of 1.14–1.39%, falling within the subspecific threshold range. These three MOTU41s also have allopatric distributions, further suggesting their subspecific variations. This structure conflicts with the current classification of A. s. taprobanis (MOTU40) and A. s. selene (MOTU41-1) as conspecifics, while supporting the inclusion of A. callandra (MOTU41-2) and A. eberti (MOTU41-3) within the A. selene (sensu stricto) species complex as subspecies.
Neighbour-joining tree (A), K2P COI distance (B), and geographical distribution (C) of two species and two subspecies in MOTU40 and MOTU41 (A. selene, A. callandra, and A. eberti).

Figure 10 Long description
The image consists of three parts: A, B and C. Part A shows a neighbor-joining tree with species and subspecies labeled as MOTU40 and MOTU41. MOTU40 includes Actias selene taprobanis, while MOTU41 is divided into MOTU41-1 (Actias selene selene), MOTU41-2 (Actias callandra) and MOTU41-3 (Actias eberti). Bootstrap values are indicated at the nodes. Part B displays a bubble chart representing the K2P COI distance between MOTU40 and MOTU41, with distances ranging from 0.01 to 0.02. Part C is a map showing the geographical distribution of the species and subspecies, with different colored markers indicating the locations of MOTU40, MOTU41-1, MOTU41-2 and MOTU41-3.
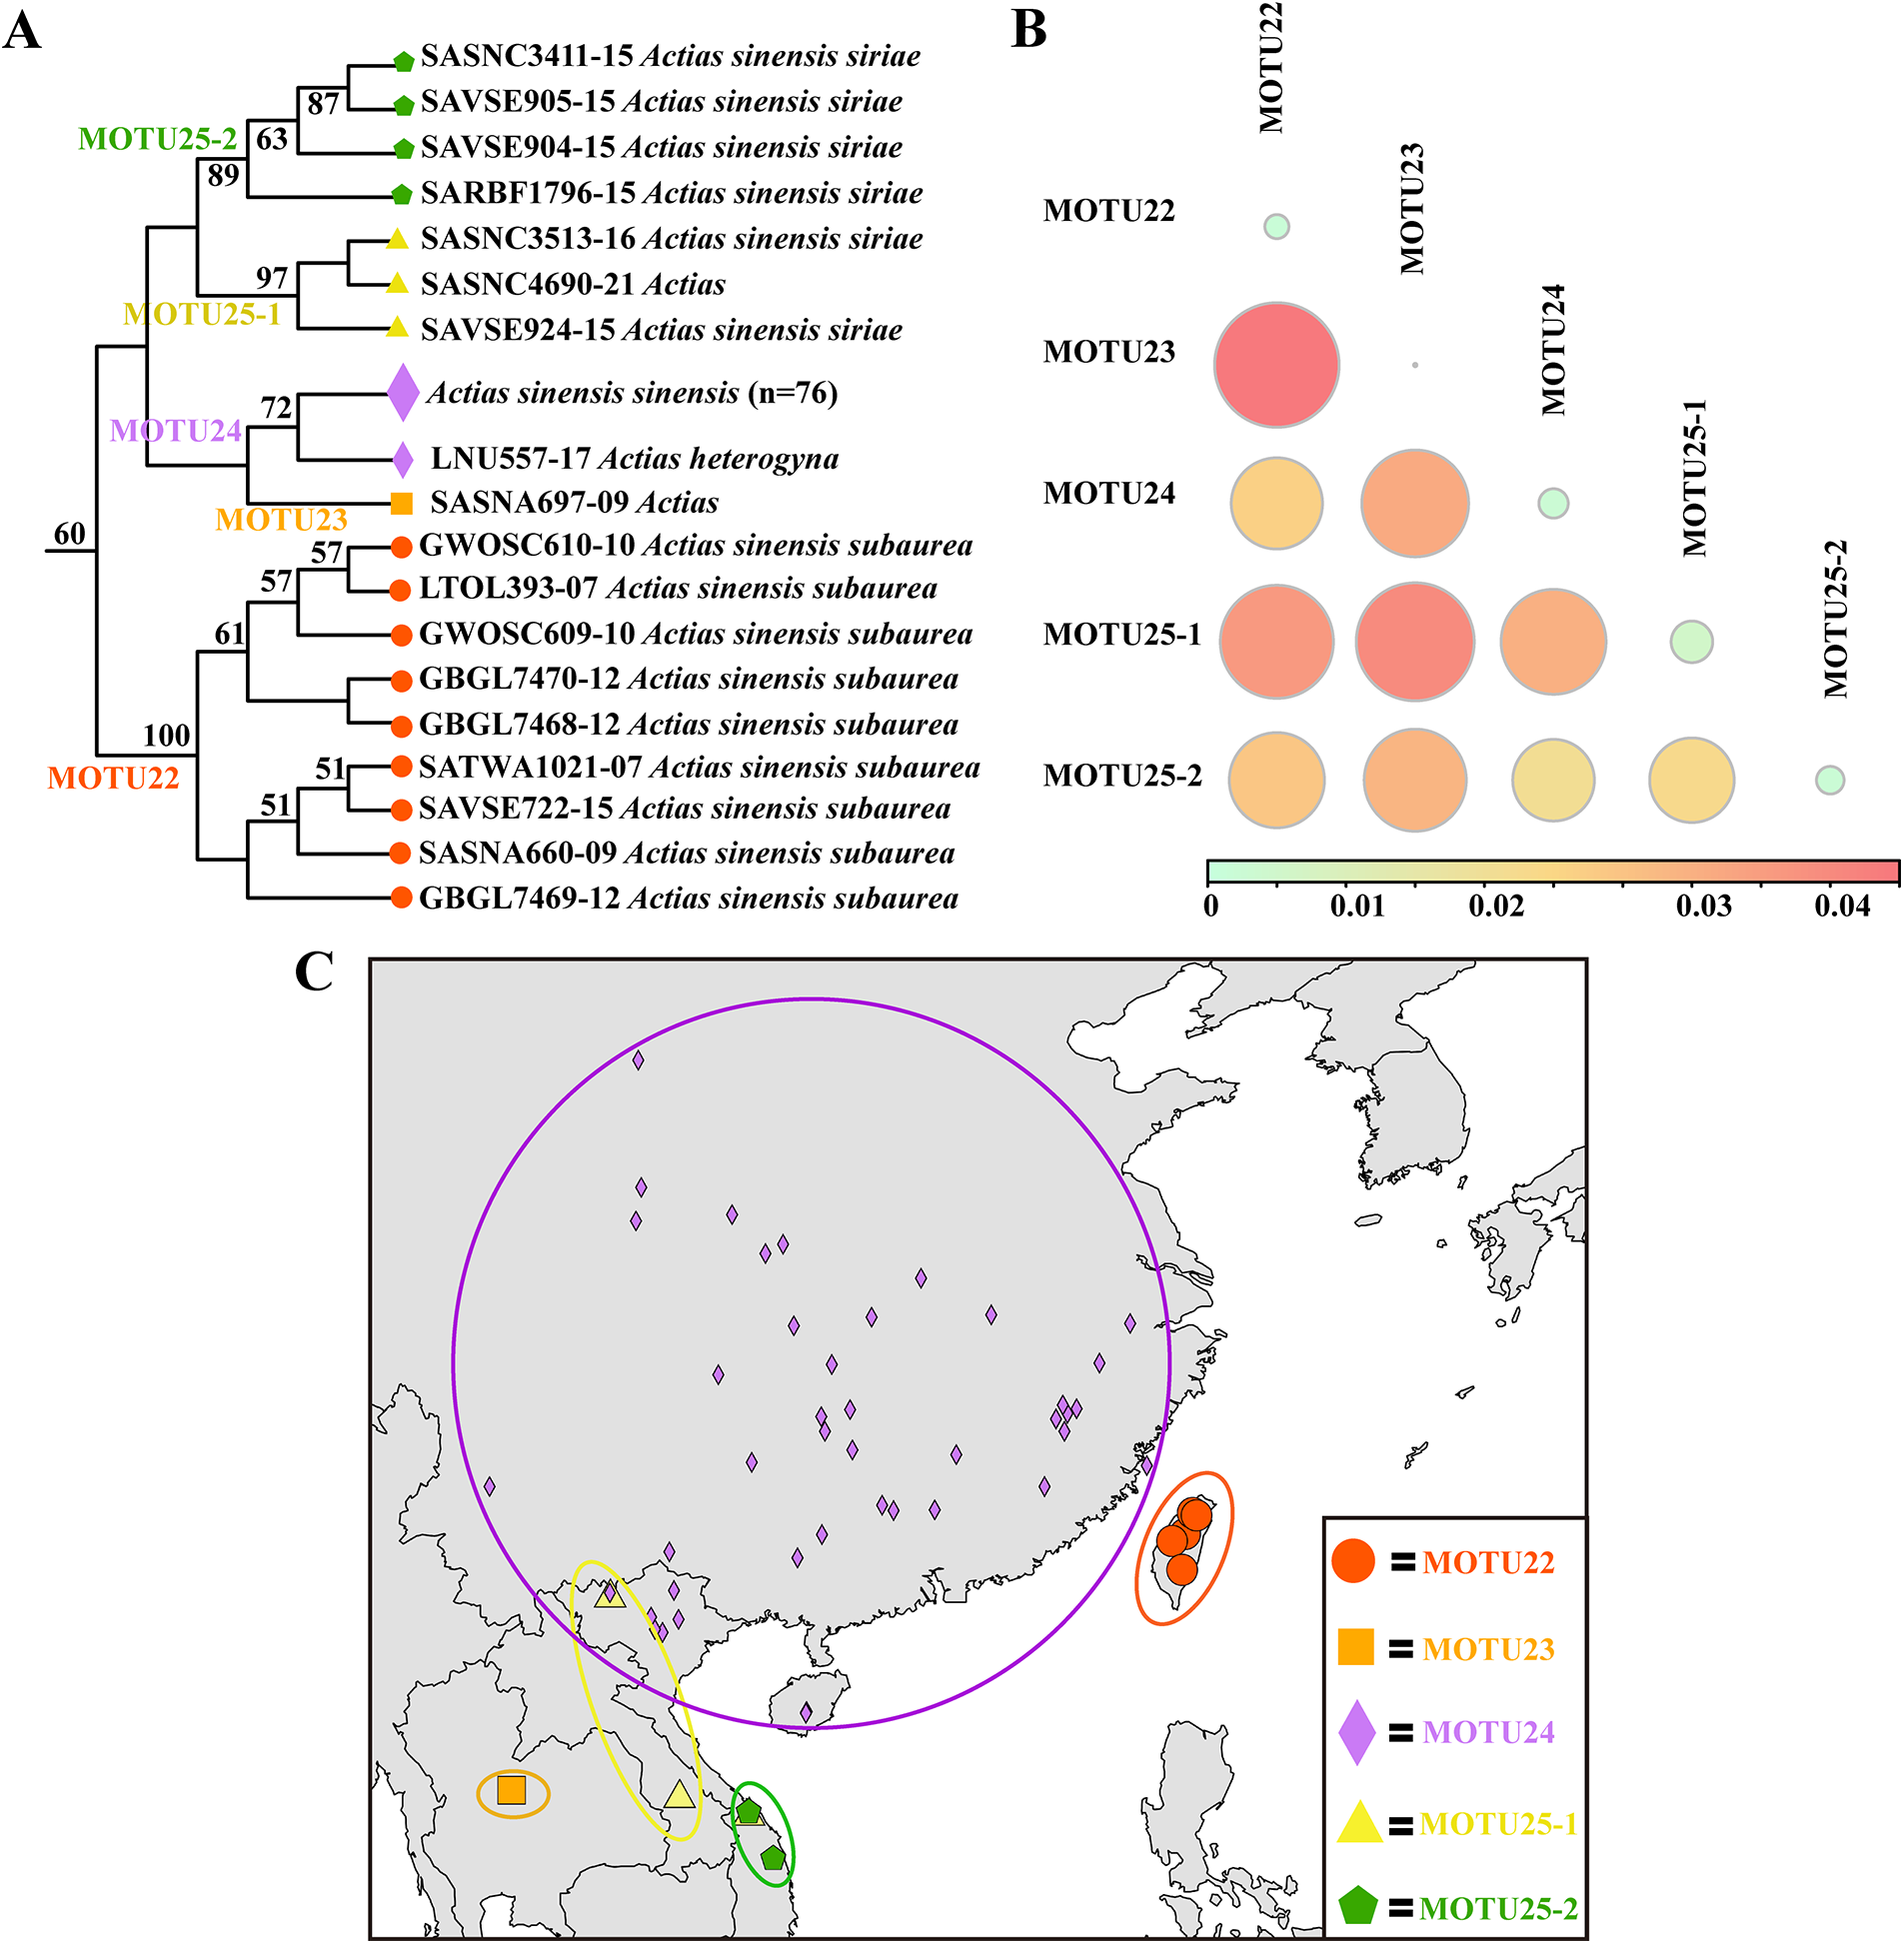
Actias sinensis (Walker, 1855) is a widely distributed species in Asia that comprises three morphological subspecies: A. s. sinensis, A. s. siriae Brechlin & van Schayck, 2017, and A. s. subaurea Kishida, 1993. DNA barcoding-based phylogenetic analysis divided A. sinensis into MOTU22-25 (fig. 11A). These four MOTUs showed K2P COI distances of 2.22–4.23% (fig. 11B), i.e. >2.05% and thus suggested a species-level separation. This COI evidence, coupled with their allopatric distributions (fig. 11C), supports their interpretation as distinct species. The unique sequence SASNA697-09 (MOTU23, from Thailand) exhibits a 2.65% minimal K2P genetic distance from MOTU24, providing preliminary molecular evidence for its distinct taxonomic status. Here it is designated as a potential new lineage requiring future verification. However, evidence based on a single specimen is insufficient to draw a definitive conclusion. In this complex, the sequence of Actias heterogyna Mell, 1914 was embedded within MOTU24 and has a mean K2P COI distance of less than 1.00% from all A. s. sinensis sequences (n = 76), supporting a potential synonymization. Furthermore, the six individuals of the morphological subspecies A. s. siriae were grouped into two subclades (MOTU25-1 and MOTU25-2; fig. 11A), separated by a mean K2P COI distance of 1.91%. The various MOTUs show largely parapatric distributions: MOTU25-1 occurs in southeastern Vietnam (14.63°N), while MOTU25-2 is primarily distributed in northwestern Vietnam (16.52°N). Although one sampling site (15.99°N) contained individuals from both these MOTUs, the overall pattern of geographic separation supports the hypothesis of limited gene flow, which is consistent with their treatment as distinct subspecies.
Neighbour-joining tree (A), K2P COI distance (B), and geographical distribution (C) of four species and one subspecies in MOTU22, MOTU23, MOTU24 and MOTU25 (A. sinensis).

Figure 11 Long description
The infographic consists of three parts: A, B and C. Part A displays a neighbor-joining tree with various species and subspecies labeled, including SASNC3411-15 Actias sinensis siriae, SASNC5905-15 Actias sinensis siriae and others. MOTU22, MOTU23, MOTU24, MOTU25-1 and MOTU25-2 are indicated with different colors. Part B shows a bubble chart representing K2P COI distances among MOTUs, with MOTU22, MOTU23, MOTU24, MOTU25-1 and MOTU25-2 labeled. The size of the bubbles varies, indicating different distance values. Part C illustrates the geographical distribution of MOTUs on a map, with MOTU22, MOTU23, MOTU24, MOTU25-1 and MOTU25-2 marked in distinct areas. MOTU22 is shown in orange, MOTU23 in red, MOTU24 in purple, MOTU25-1 in yellow and MOTU25-2 in green. The map includes a large circle encompassing several regions, indicating the distribution of these species and subspecies.
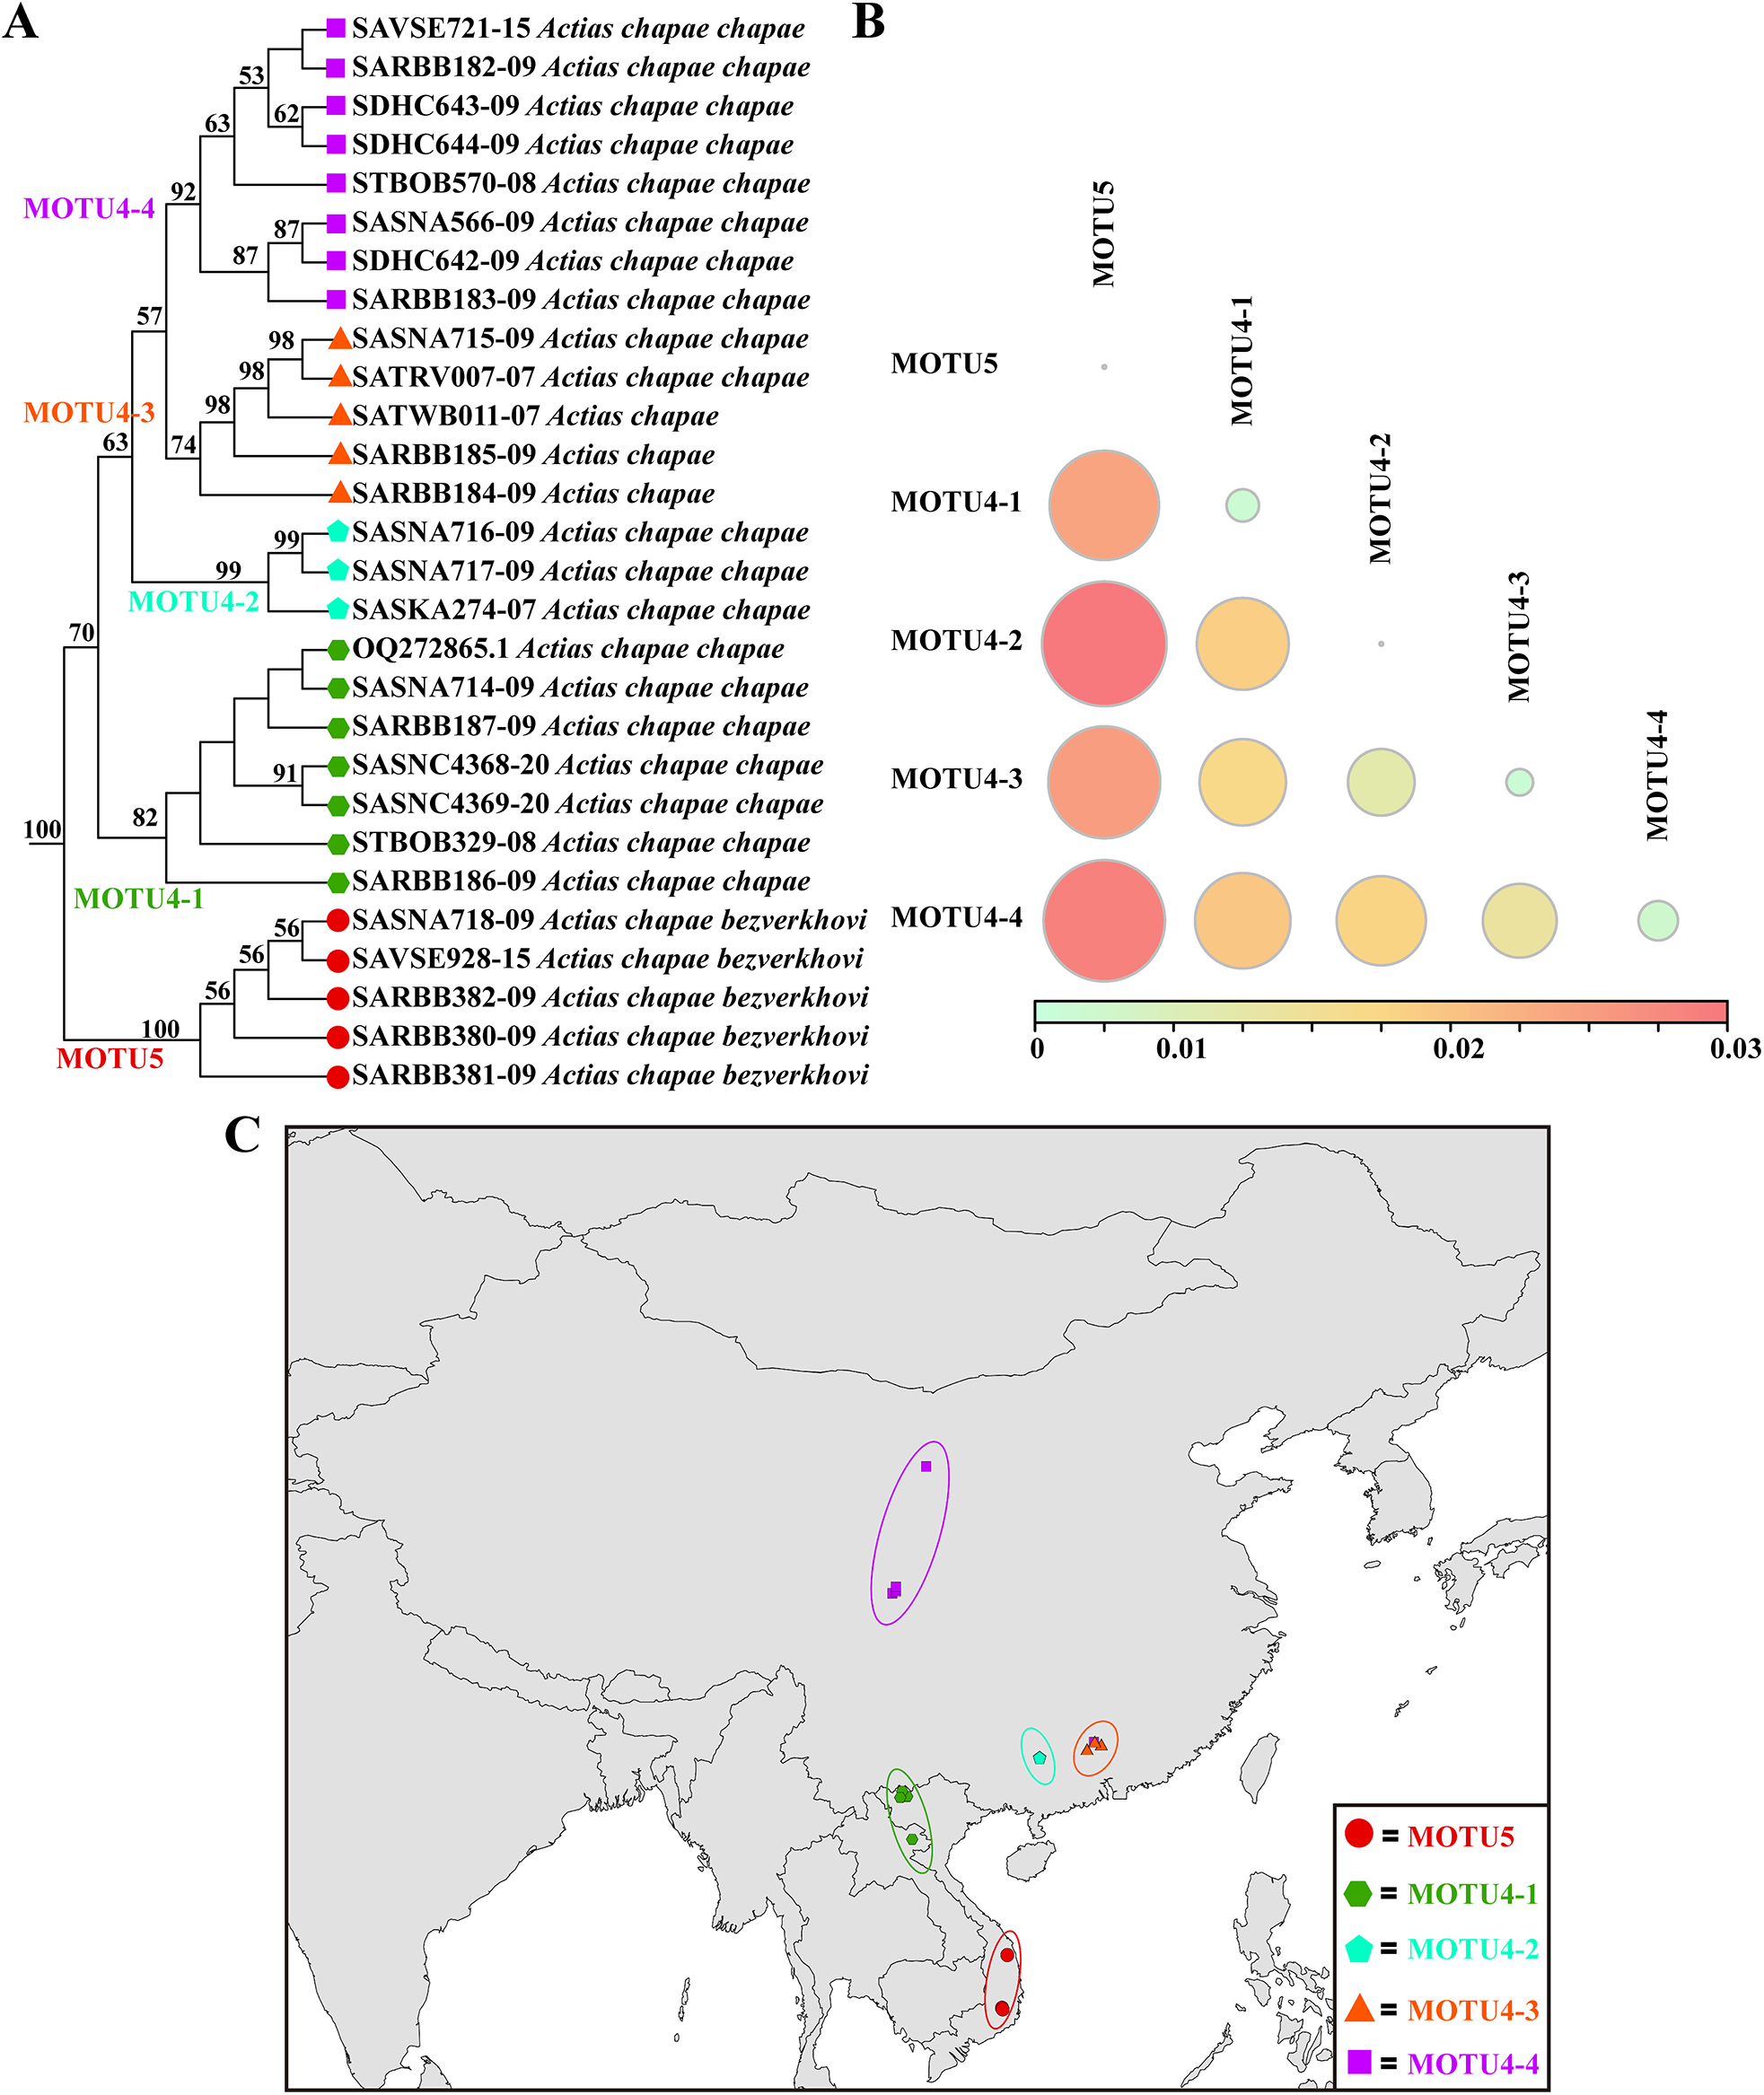
Actias chapae Mell, 1950 comprises two subspecies, A. c. chapae and A. c. bezverkhovi Sochivko & Ivshin, 2008. DNA barcoding-based phylogenetic analysis resolved these two morphological subspecies into two clades (MOTU4 and MOTU5, respectively; fig. 12A). The mean K2P COI distance between them was 2.33% (fig. 12B), which exceeds the species-level threshold. This supports their recognition as distinct species. Within MOTU4 (A. c. chapae), the sequences were further grouped into four subclades. The K2P COI distances between these subclades fell within the range of 1.00–2.05%, supporting their interpretation as distinct subspecies. The allopatric distributions of A. c. bezverkhovi and the four subspecies in MOTU4 provide complementary evidence for this classification (fig. 12C).
Neighbour-joining tree (A), K2P COI distance (B), and geographical distribution (C) of two species and four subspecies in MOTU4 and MOTU5 (A. chapae).

Figure 12 Long description
The image consists of three parts: A, B and C. Part A shows a neighbor-joining tree with species Actias chapae chapae and Actias chapae bezverkhovi, divided into clades MOTU4 and MOTU5. Subclades within MOTU4 are labeled MOTU4-1 to MOTU4-4. Part B displays a bubble chart of K2P COI distances between these clades and subclades, with a scale from 0 to 0.03. Part C is a map indicating the geographical distribution of MOTU5 and MOTU4 subclades, marked with different colors and shapes corresponding to the clades and subclades.
For Actias witti Brechlin, 2007, only a 506 bp COI sequence was available. Its phylogenetic position varied during the construction of the phylogenetic tree, indicating that its taxonomic status needs to be addressed in the future. This principle, whereby infra-specific taxa that lack phylogenetic support within a MOTU are not recognized, also applies to other species in our study, such as Actias luna (n = 45), A. diana (n = 22), A. maenas (n = 35), A. felicis (n = 7), Actias isis Sonthonnax, 1897 (n = 11), and A. artemis (n = 8). For these and other cases listed in table S4, our COI data do not support the recognition of the described subspecies mentioned, and we therefore treat these MOTUs as taxonomic units without subspecific division.
Phylogenetic placement of extra-limital species
Our comprehensive dataset allowed us to critically evaluate the taxonomic placement and COI differentiation of several historically challenging, extra-limital species. For the Spanish moon moth, Actias (Graellsia) isabellae (Graells, 1849), our analysis of 24 COI sequences retrieved from BOLD showed interspecific K2P COI distances to other Actias species ranging from 9.54% to 12.52%, well within the Actias-specific interspecific range (2.05–14.56%) observed across our study. Phylogenetically, A. isabellae was robustly placed within a clade comprising exclusively Asian Actias species, including A. maenas and A. timorensis (fig. 1). This close phylogenetic relationship stands in contrast to its allopatric distribution in Europe. For the American moon moths, A. luna (Linnaeus, 1758) (n = 45) and A. truncatipennis (Sonthonnax, 1899) (n = 9), the analysis of COI sequences confirmed their status as distinct species. Their K2P COI distances to Asian congeners also fell within the typical Actias-specific interspecific range. Crucially, phylogenetic analysis grouped them within a well-supported clade of Asian species, specifically as a sister taxon to a lineage containing A. dubernardi and A. chapae (fig. 1).
Assessment of sequence identifications in public databases
The comprehensive phylogenetic framework established in this study enabled a critical assessment of taxonomic assignments in public databases, leading to the re-identification of 13 sequences out of 741 used sequences. In the COI-based phylogenetic framework, these 13 sequences were deeply embedded within a MOTU that differed from its original morphological classification (table S7), indicating the occurrence of misidentification. A representative case is sequence FJ358505 (Pu et al., Reference Pu, Wu, Huo, Wang, Xia, Li, Wang, Luo and Liu2008), which was originally identified morphologically as A. selene but clusters within the A. ningpoana clade in our phylogeny. It shows minimal genetic divergence from the A. ningpoana clade (MOTU39; <1.64%) but high divergence from the A. selene clade (MOTU41; >7.08%). Accordingly, the sequences identified as potential misidentifications have been formally reported to the BOLD database management team as evidence-based suggestions for curatorial review, in line with our aim to contribute to the improvement of public data quality.
Species composition and COI identification in Liaoning Province
The application of our global phylogenetic framework provided definitive COI identifications for the historically ambiguous Actias fauna of Liaoning Province. All publicly available COI sequences from Liaoning, along with our four newly sequenced specimens from Benxi (BOLD Dataset: https://dx.doi.org/10.5883/DS-CLBX), were placed within the framework with high confidence. This analysis revealed the presence of at least three species in the region: A. ningpoana, the A. artemis/A. dulcinea complex, and Actias gnoma (Butler, 1877). Specifically, three of the four public BOLD sequences from Liaoning and our new Benxi specimens (PV628723 and PV628724) clustered within MOTU36-2, confirming their identity as members of the A. artemis/A. dulcinea complex. The previously published sequence FJ358505 (A. selene) and the two other newly sequenced specimens from Benxi (PV628729 and PV628734), all from Liaoning Province, were robustly placed within the A. n. ningpoana clade (MOTU39-8). The public sequence of A. gnoma from Liaoning was correctly placed within its expected clade.
Discussion
Species delimitation in Actias is, with 41–55 recognized morphospecies, challenged by morphological ambiguities and the lack of a genus-specific COI threshold standard (Ratnasingham and Hebert, Reference Ratnasingham and Hebert2007; Huemer et al., Reference Huemer, Mutanen, Sefc and Hebert2014; Kitching et al., Reference Kitching, Rougerie, Zwick, Hamilton, St Laurent, Naumann, Ballesteros Mejia and Kawahara2018; Beccaloni et al., Reference Beccaloni, Scoble, Kitching, Simonsen, Robinson, Pitkin, Hine, Lyal, Ollerenshaw, Wing, Hobern, Bánki, Roskov, Döring, Ower, Hernández Robles, Plata Corredor, Stjernegaard Jeppesen, Örn, Pape, Hobern, Garnett, Little, DeWalt, Ma, Miller, Orrell, Aalbu, Abbott and Aedo2024). To tackle these challenges, we built a robust framework based on DNA barcoding data, combined with morphological, phylogenetic, population genetic (Fst), and biogeographic evidence. A set of 29 MOTUs consistent with morphology-based taxa served as the baseline for determining an Actias-specific interspecific K2P COI distance range. The resulting 2.05% threshold that aligns with the established ∼2% Lepidopteran benchmark (Hajibabaei et al., Reference Hajibabaei, Janzen, Burns, Hallwachs and Hebert2006; Zahiri et al., Reference Zahiri, Lafontaine, Schmidt, Dewaard, Zakharov and Hebert2014) was then applied to resolve species-level taxonomic uncertainties across the genus. This approach not only delineated 15 additional MOTUs from previously ambiguous assignments but was also key to resolving long-standing ambiguities in sequence identity. The species-level threshold (2.05%) provided a consistent criterion for delimitation, consequently supporting the elevation of morphologically defined subspecies to species status where genetic distances warranted (MOTU5, MOTU22, MOTU25, MOTU42, and MOTU40). By applying the empirically derived subspecific threshold range (1.00–2.05%), we were able to validate robust subspecies hypotheses and, conversely, to flag taxonomic units that lack coherent support, thereby identifying priority cases for future taxonomic revision. The infraspecific threshold consolidated synonyms (MOTU44) and, conversely, identified divergent intraspecific lineages (e.g. A. n. ningpoana (MOTU39-4, 5, 6, 7, and 8). Our work establishes a replicable, evidence-based system for generating taxonomic hypotheses in Actias.
Our analysis, applying the integrative framework established above, provides new evidence to address several taxonomic debates stemming from conflicting historical classifications. For instance, while Actias bulbosa Nässig & Treadaway, 1997 is variably elevated to species rank (BOLD) or as a subspecies of Actias philippinica Nässig & Treadaway, 1997 (Kitching et al., Reference Kitching, Rougerie, Zwick, Hamilton, St Laurent, Naumann, Ballesteros Mejia and Kawahara2018), our genetic data support its recognition as a distinct species, as its divergence exceeds our empirical interspecific threshold. Conversely, for A. diana (often equated with A. maenas diana), our data support its subspecific status within A. maenas, consistent with its classification in Kitching et al. (Reference Kitching, Rougerie, Zwick, Hamilton, St Laurent, Naumann, Ballesteros Mejia and Kawahara2018).
Likewise, the taxonomic complex comprising Actias acutapex Kishida, 2000, Actias sumbawaensis Paukstadt, Paukstadt & Rougerie, 2010, and Actias timorensis Paukstadt, Paukstadt & Rougerie, 2010, which are treated as subspecies of Actias groenendaeli Roepke, 1954 in some classifications (e.g. Wikipedia: accessed on 4 March 2025; Kitching et al., Reference Kitching, Rougerie, Zwick, Hamilton, St Laurent, Naumann, Ballesteros Mejia and Kawahara2018) but as full species in BOLD, is evaluated by our data. Their pairwise genetic distances fall within the range of interspecific variation for Actias, and their phylogenetic separation lead us to support their recognition as distinct species, consistent with their treatment in BOLD.
A particularly instructive case is A. xenia, which was originally described as a subspecies of A. artemis before being elevated to species level (Kitching et al., Reference Kitching, Rougerie, Zwick, Hamilton, St Laurent, Naumann, Ballesteros Mejia and Kawahara2018; Coppens, Reference Coppens2019). Our data show that while it forms a distinct, allopatric subclade, it exhibits a low genetic distance of 1.08% from A. artemis, a value below our Actias-specific interspecific threshold of 2.05%. Therefore, based on our calibrated criteria, we support its classification at the subspecific level, i.e. as A. artemis xenia. This case, however, also precisely underscores a limitation of the single-gene approach. Our framework could not resolve the distinction between A. artemis and A. dulcinea, which show minimal genetic divergence and broadly overlapping distributions. This pattern suggests underlying evolutionary complexity that cannot be resolved here, pinpointing a key question requiring phylogenomic data for clarification. Collectively, these applications showcase the framework’s capacity to generate specific, testable hypotheses for resolving taxonomic ambiguities, while precisely demarcating the boundaries of its current analytical scope.
Building on the specific cases and limitations discussed above, this study establishes a robust framework for Actias taxonomy while clarifying key avenues for future research. Firstly, our conclusions are based primarily on the COI barcode region. Although this marker is highly effective for initial species delimitation, it may be insufficient to fully resolve recent radiations or complex phylogenetic relationships where incomplete lineage sorting or introgression is involved. Thus, future studies incorporating genome-scale data (e.g. ultra-conserved elements or whole genomes) will be crucial for elucidating these difficult nodes. Secondly, while our taxonomic inferences are grounded in quantitative evidence, they are sometimes constrained by data availability. For example, the proposed synonymization of A. heterogyna is based on a single sequence, and the phylogenetic position of A. witti remains unstable due to its short sequence length (506 bp). These specific cases highlight the need for targeted sampling from type localities and the generation of full-length barcodes to conclusively test our hypotheses. Finally, beyond taxonomy, our biogeographic analysis reveals that the European and American species are phylogenetically nested within Asian clades. This pattern presents a compelling evolutionary puzzle regarding their historical biogeography. However, the limited resolution of a single gene fragment precludes detailed inference into the timing and mechanisms of these transcontinental distributions. Therefore, our framework establishes the necessary phylogenetic foundation for future studies to address these macroevolutionary questions directly, using phylogenomic and biogeographic modelling approaches.
Supplementary material
The supplementary material for this article can be found at https://doi.org/10.1017/S0007485326100893.
Acknowledgements
This work was supported by the National Natural Science Foundation of China (grant no: 31972617), the Applied Basic Research Program of Liaoning Province (grant no: 2022JH2/101300178), and the China Agriculture Research System (CARS-18).
Competing interests
The authors declare that no potential conflicts of interest exist.