Implications
Nowadays, aquaculture is the fastest-growing food production system. However, reducing the dependence of aquaculture on fishmeal (FM) and fish oil in feeds is essential for a sustainable growth of the sector. A key area of investigation to improve modern aquafeeds includes the evaluation of varying proportions and combinations of plant ingredients in low FM diets to identify mixtures that are more efficiently utilized by the fish. This study compared the effects of diets containing a low amount of FM and different plant protein blends containing increasing levels of soybean meal (SBM) on the performance of European sea bass.
Introduction
For several years, there has been continuing interest in identifying and developing ingredients as alternatives to FM for use within aquafeeds, resulting in a substantial decrease of this ingredient in the feed formulation of many species. Nowadays aquaculture relies on a basket of common input plant protein ingredients such as SBM, corn gluten (CGM), wheat gluten (WGM) or sunflower meal (SFM), for which it competes in the marketplace with the animal husbandry sector as well as with use for direct human consumption. Based on evidence indicating that mixed dietary plant proteins outperform single sources, a key area of investigation for continuing to improve modern aquafeeds includes the evaluation of varying proportions and combinations of plant ingredients to identify mixtures that are more efficiently utilized by the fish (De Santis et al., Reference De Santis, Tocher, Ruohonen, El-Mowafi, Martin, Dehler, Secombes and Crampton2016). Corn gluten and WGM have high protein level, are low in fiber, rich in vitamins B and E and are known to contain no antinutritional factors (Bonaldo et al., Reference Bonaldo, Parma, Mandrioli, Sirri, Fontanillas, Badiani and Gatta2011 and Reference Bonaldo, Roem, Fagioli, Pecchini, Cipollini and Gatta2015). Sunflower meal is highly palatable and has low antinutritional factors (Merida et al., Reference Merida, Tomás-Vidal, Martínez-Llorens and Cerdá2010). SBM is one of the most interesting alternatives to FM because of the advantages of supply, price, protein and amino acid composition (Parma et al., Reference Peres, Gonçalves and Oliva-Teles2016). However, SBM has been found to induce a variety of histological and functional changes in the gastrointestinal tracts of several species, especially in salmonids, such as subacute enteritis of the distal epithelial mucosa including morphological alteration and inflammation (Krogdahl et al., Reference Krogdahl, Penn, Thorsen, Refstie and Bakke2010). To our knowledge, only a few studies have explored in European sea bass (Dicentrarchus labrax) the effects of different plant blends with increasing levels of SBM in low FM diets, and most of the data in the literature were restricted to replacing FM with SBM. Hence, this study investigated the effects of different plant protein blends, with increasing SBM by replacing a mix of plant ingredients (WGM, CGM and SFM) in low FM diets (20%), on growth, blood biochemistry profile and gut histology in European sea bass.
Material and methods
Experimental diets
Five isonitrogenous and isolipidic experimental diets were formulated: four diets containing increasing SBM levels (0%, 10%, 20% and 30%; 0SBM, 10SBM, 20SBM and 30SBM, respectively) with a low content of FM (20%) and one control diet (CD) (0% SBM; 35% FM). SBM was replaced by adding a combination of WGM, CGM and SFM, as recently described by Parma et al. (Reference Peres, Gonçalves and Oliva-Teles2016) on gilthead seabream (Sparus aurata L.). The diets were produced by Skretting Aquaculture Research Centre, Stavanger, Norway. According to the feed manufacturer, protein and lipid levels were within the range of commercial diets for sea bass. The CD, containing 35% FM, was included to exclude any deleterious effect of low FM on the performance and health during the on-growing of European sea bass, adopting the same approach used by Torrecillas et al. (Reference Torrecillas, Robaina, Caballero, Montero, Calandra, Mompel, Karalazos, Kaushik and Izquierdo2017) and Parma et al. (Reference Peres, Gonçalves and Oliva-Teles2016).
The diameter of the pellet was 4 mm. Ingredients and proximate composition of the experimental diets are presented in Table 1.
Ingredients and proximate composition of the experimental diets

FM=fishmeal; SBM=soybean meal; CD=control diet; 0SBM=0 g/kg SBM diet; 10SBM=100 g/kg SBM diet; 20SBM=200 g/kg SBM diet; 30SBM=300 g/kg SBM diet; NfE=nitrogen-free extract, calculated.
1 Vitamin and mineral premix; Skretting, Stavanger, Norway (fulfilling recommendations for marine fish species given by NRC, 2011).
Fish and feeding trial
The experiment was carried out at the Laboratory of Aquaculture, Department of Veterinary Medical Sciences of the University of Bologna, Cesenatico, Italy. European sea bass juveniles were obtained from Ecloserie Marine de Gravelines (Gravelines, France). One week before the beginning of the trial, fish were fed with a mixture of the five experimental diets. At the beginning of the trial, 60 fish (initial average weight 68.9±1.7 g) per tank were randomly distributed into 15 1000 l square tanks with a conical bottom. Each diet was administered to triplicate groups, assigned in a completely random manner, over 91 days. Tanks were provided with natural seawater and connected to a closed recirculation system (overall water volume: 18 m3). The rearing system consisted of a mechanical sand filter (Astralpool, Spain), ultraviolet lights (Philips, the Netherlands) and a biofilter (Astralpool, Spain). The water exchange rate within each tank was 100% every hour, while the overall water renewal amount in the system was 5% daily. During the trial, the temperature was kept constant at 22±1.0°C and the photoperiod was maintained at 12 h light and 12 h dark through artificial light. The oxygen level was kept constant at 100% saturation by a liquid oxygen system regulated by a software program (B&G Sinergia snc, Chioggia, Italy). Ammonia (total ammonia nitrogen ⩽0.1 ppm), nitrite (⩽0.2 ppm) and salinity (25 g/l) were spectrophotometrically monitored daily (Spectroquant Nova 60, Merck, Lab business, Darmstadt, Germany). Sodium bicarbonate was added on a daily basis to keep pH constant at 7.8 to 8.0. Feed was provided to 10% overfeeding by automatic feeders, twice a day for 6 days a week, while one meal was supplied on Sundays, as reported by Mongile et al. (Reference Mongile, Bonaldo, Fontanillas, Mariani, Badiani, Bonvini and Parma2014). Each meal lasted 1 h, after that the uneaten pellets in each tank were gathered, dried overnight at 105°C, and their weight was deducted for overall calculation.
Sampling
At the beginning and at the end of the experiment, all the fish in each tank were anesthetized and individually weighed. In case of any mortality, fish were immediately removed and the weight was recorded for overall calculation. Specific growth rate (SGR), voluntary feed intake (VFI) and feed conversion rate (FCR) were calculated. The proximate composition of the carcasses was determined at the beginning of the trial on a pooled sample of 10 fish and on pooled samples of five fish per tank at the end of the trial. Protein efficiency rate (PER), gross protein efficiency (GPE) and gross lipid efficiency (GLE) were calculated. Furthermore, at the end of the trial, wet weight, viscera, liver and visceral fat weight were individually recorded for five fish per tank to determine viscerosomatic index (VSI), hepatosomatic index (HSI) and fat index (FaI). At the end of the trial five fish per tank (15 fish per dietary treatment) were sampled for intestine histology examination. After the end of the trial, the fish left were kept in the same rearing and feeding conditions for 3 more days and then were sampled to perform blood analyses of hematocrit, serum total protein, triglycerides and cholesterol. Blood from five fish per tank was collected 5 h postprandial from the caudal vein. Samples were then centrifuged (3000×g for 10 min at 4°C) and serum aliquots were stored at 4°C and analyzed during the same day.
All experimental procedures were evaluated and approved by the Ethical-Scientific Committee for Animal Experimentation of the University of Bologna, in accordance with European directive 2010/63/UE on the protection of animals used for scientific purposes.
Analytical methods
Diets and whole body were analyzed for proximate composition. Moisture content was obtained by weight loss after drying samples in a stove at 105°C until a constant weight was achieved. Crude protein was determined as total nitrogen (N) by using the Kjeldahl method and multiplying N by 6.25. Total lipids were determined according to Bligh and Dyer’s (Reference Bligh and Dyer1959) extraction method. Ash content was estimated by incineration to a constant weight in a muffle oven at 450°C. Gross energy was determined by a calorimetric bomb (Adiabatic Calorimetric Bomb Parr 1261; PARR Instrument, IL, USA).
The hematocrit value was obtained as packed cell volume % using microhematocrit tubes on a dedicated centrifuge (Hettich Haematokrit 210, Tuttingen, Germany). Serum total protein, cholesterol and triglycerides were measured using colorimetric methods (Total protein OSR6232, Cholesterol OSR6216, Triglyceride OSR61118; Beckman Coulter, Brea, CA, USA) on an automated analyzer (AU 400; Beckman Coulter).
Calculations
The formulae employed were as follows:
Specific growth rate (SGR) (per day)=100×(ln FBW−ln IBW)/days (where FBW and IBW represent the final and the initial BWs). Voluntary feed intake (VFI) (g feed/fish)=g feed ingested/fish number. Feed conversion ratio (FCR)=feed intake/weight gain. Viscerosomatic index (VSI) (%)=100×(viscera weight/BW). Hepatosomatic index (HSI) (%)=100×(liver weight/BW). Fat index (FaI) (%)=100×(visceral fat weight/FBW). Protein efficiency ratio (PER)=(FBW–IBW)/protein intake. Gross protein efficiency (GPE) (%)=100×[(% final body protein×FBW)−(% initial body protein×IBW)]/total protein intake fish. Gross lipid efficiency (GLE) (%)=100×[(% final body lipid×FBW)−(% initial body lipid×IBW)]/total lipid intake fish. The survival rate was calculated as a percentage of the initial number of fish.
Histology
After euthanasia, the gut was removed and the intestine was divided into two segments (proximal and distal). From each segment, a 5-mm-long piece was sectioned and fixed in 10% buffered formalin. Samples were then processed for routine histology to obtain a transversal section, which was stained with hematoxylin and eosin. Sections were evaluated in blind fashion under a light microscope regarding treatments for degenerative and inflammatory changes. Photographs of the sections were made with a Nikon Eclipse 80i microscope (Nikon, Tokyo, Japan) equipped with a Nikon Digital Sight SD-MS camera and the Nikon software NIS-Elements. Adobe Photoshop CS3 Extended was used for the final photographic preparation without altering the original integrity of the pictures. Regarding diet CD and 30SBM, also morphometry and scoring were conducted for proximal and distal tracts. Morphometry consisted in measurements at 100× magnification of five randomly selected fields per intestinal tract. Width of lamina propria, width of mucosal layer in the middle of the folds, height of mucosal layer at the base of the folds and height of submucosa were measured and expressed in micron (µ). Goblet cells were counted in three fields per intestinal tract at 40× magnification. A semiquantitative scoring system, with the range of scores set at 0 to 3, was used for evaluation of inflammatory cells infiltration, number of mast cells and number of intraepithelial lymphocytes.
Statistical analysis
All data are presented as mean. Tank was used as the experimental unit for analyzing growth and performance, a pool of five sampled fish was considered the experimental unit for analyzing carcass composition, whereas individual fish was used for analyzing VSI, HSI, FaI, and all blood parameters. Diets with low FM (0SBM, 10SBM, 20SBM and 30SBM) were analyzed by a one-way ANOVA followed by a Tukey’s multiple comparison test. T-test was used to compare diets CD and 0SBM. Normal distribution of morphometric and histologic data sets was tested by Shapiro–Wilk. If normality criteria were not met, Mann–Whitney U testing was run. The differences among treatments were considered significant at P⩽0.05. All statistical analyses were performed using software Statistica 8 (StatSoft Inc., Tulsa, OK, USA).
Results
Growth
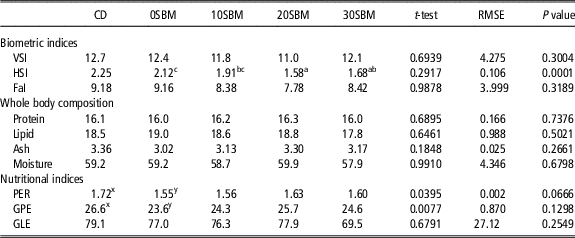
Growth performances are summarized in Table 2. No significant differences were found in final BW, SGR and VFI. Fish fed diet 0SBM showed lower FCR in comparison to those fed diet CD and 20SBM. No significant differences were recorded in survival rate among groups. Data on biometric indices, body composition and nutritional indices are shown in Table 3. No significant differences were found in VSI and FaI. Within the groups fed low FM, HSI significantly decreased from 0SBM to 20SBM. No significant differences were found in the whole body proximate composition. Fish fed diet CD showed higher PER and GPE in comparison to those fed diet 0SBM, while no differences were recorded between low FM treatments. No significant differences among treatments were found in GLE.
Growth performance, intake and survival of European sea bass fed experimental diets over 91 days

CD=control diet; 0SBM=0 g/kg SBM diet; 10SBM=100 g/kg SBM diet; 20SBM=200 g/kg SBM diet; 30SBM=300 g/kg SBM diet; RMSE=root mean square error; IBW=initial BW; FBW=final BW; SGR=specific growth rate (% per day)=100×(ln FBW−ln IBW)/days (where FBW and IBW represent the final and the initial BWs); VFI=voluntary feed intake (g feed/fish)=g feed ingested/fish; FCR=feed conversion rate=feed intake/weight gain.
Data are presented as mean of three measurements.
a,bValues within a row with different superscripts differ significantly at P<0.05 for one-way ANOVA analysis.
x,yValues within a row with different superscripts differ significantly at P<0.05 for t-test analysis.
Biometric indices, body composition and nutritional indices of European sea bass fed the experimental diets

CD=control diet; 0SBM=0 g/kg SBM diet; 10SBM=100 g/kg SBM diet; 20SBM=200 g/kg SBM diet; 30SBM=300 g/kg SBM diet; RMSE=root mean square error; VSI=viscerosomatic index (%)=100×(viscera weight/BW); HSI=hepatosomatic index (%)=100×(liver weight/BW); FaI=fat index (%)=100×(visceral fat weight/FBW); PER=protein efficiency ratio=((FBW−IBW)/protein intake); GPE=gross protein efficiency=100× [(%final body protein×FBW)−(% initial body protein×IBW)]/total protein intake fish; GLE=gross lipid efficiency=100×[(% final body lipid×FBW)−(% initial body lipid×IBW)]/total lipid intake fish.
Data are presented as mean of 3 measurements, 15 measurements for VSI, HSI, FaI.
a,b,cValues within a row with different superscripts differ significantly at P<0.05 for one-way ANOVA analysis.
x,yValues within a row with different superscripts differ significantly at P<0.05 for t-test analysis.
Blood biochemistry
Hematocrit, serum total protein, triglycerides and cholesterol levels are shown in Table 4. Data on hematocrit analyzed by ANOVA were significantly different (P=0.0355), even though the Tukey’s multiple comparison test did not underline specific differences between groups. Fish fed diet 0SBM showed higher serum total protein in comparison to those fed diet 30SBM and higher serum triglycerides in comparison to CD. Within low FM diets, cholesterol values decreased with the increasing of SBM inclusion.
Hematocrit, serum total protein, triglycerides and cholesterol concentrations of European sea bass fed the experimental diets

CD=control diet; 0SBM=0 g/kg SBM diet; 10SBM=100 g/kg SBM diet; 20SBM=200 g/kg SBM diet; 30SBM=300 g/kg SBM diet; RMSE=root mean square error.
Data are presented as mean of 15 measurements.
a,bValues within a row with different superscripts differ significantly at P<0.05 for one-way ANOVA analysis.
x,yValues within a row with different superscripts differ significantly at P<0.05 for t-test analysis.
Histology
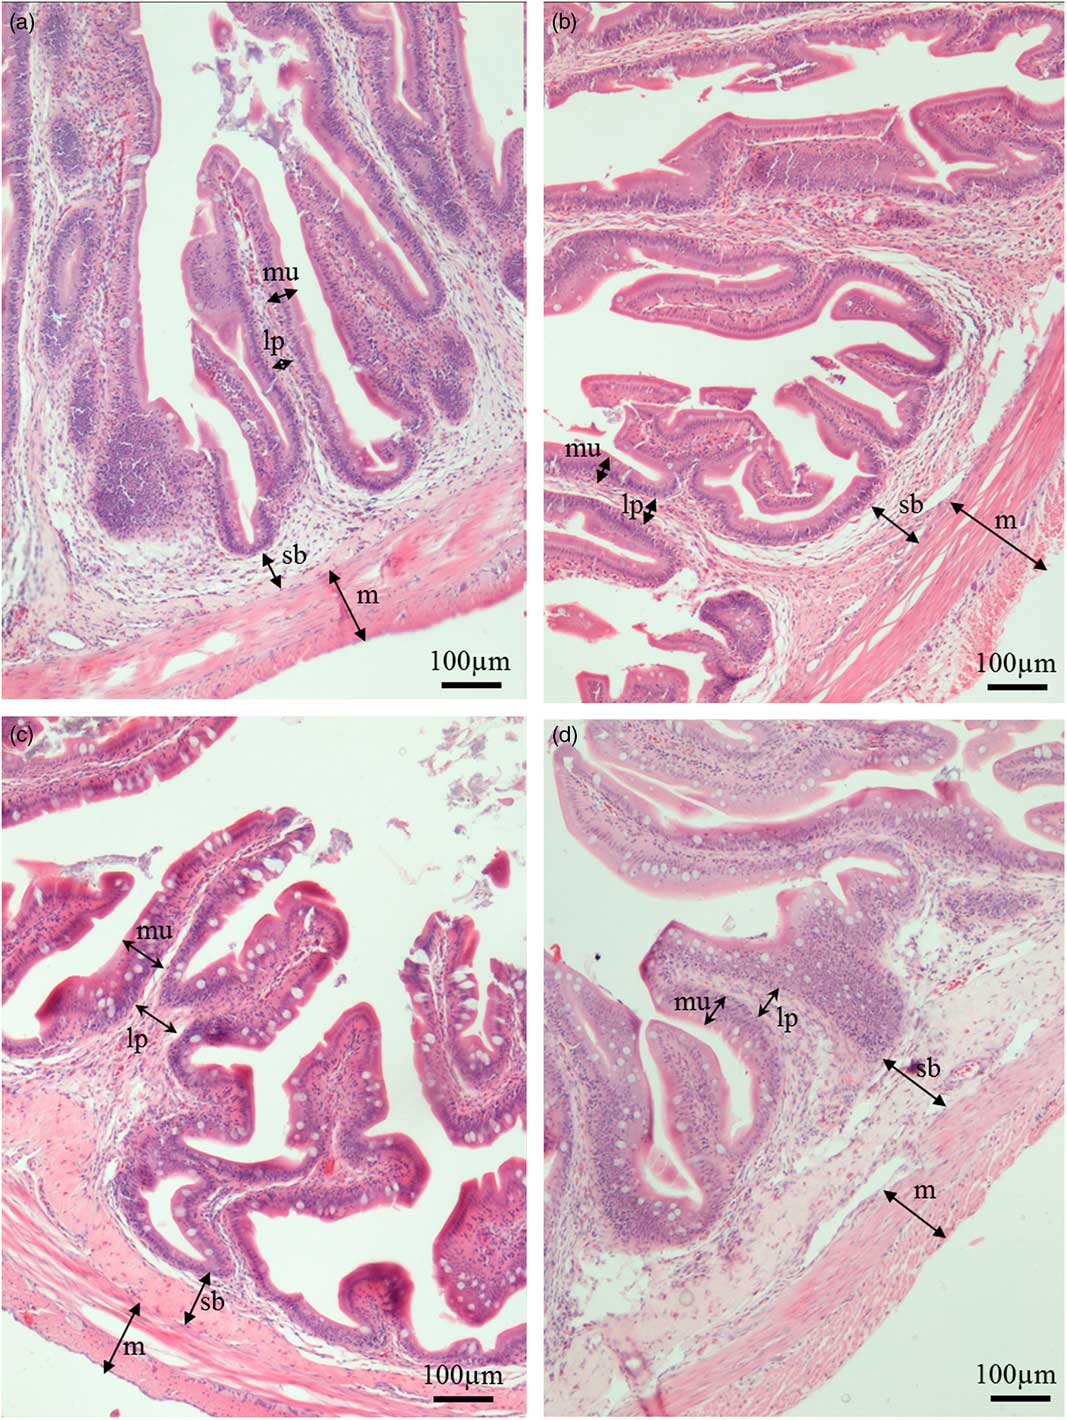
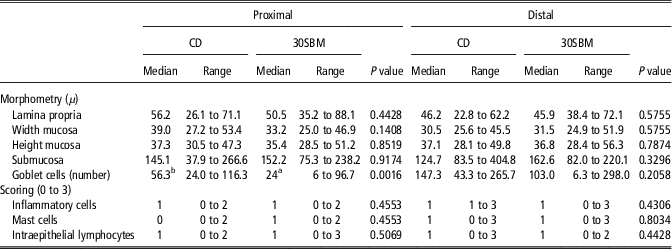
Inflammatory and/or degenerative changes indicative of soy-induced enteritis were not present in any histological section from all subjects examined (Figure 1). Regarding proximal tract, no differences were recorded for morphometry and scoring while a depletion of goblet cells was found in animals fed 30SBM in comparison with CD. Considering distal tract, no differences were recorded for all the parameters evaluated. All data are shown in Table 5.
Histology of the proximal and distal intestine of sea bass fed the control diet (CD) (a, c) and 30SBM diet (b, d). Sections show a normal architecture of the mucosal layer (mu) that displays a regular columnar epithelium with polarized and basally located nuclei, of the lamina propia (lp) and submucosal layer (sb) that show a loose connective tissue rich in capillary network, and of the muscular layer (m) for both treatments (hematoxylin and eosin, bar=100 µm).

Morphometry and histopathological scoring of European sea bass fed diets CD and 30SBM

CD=control diet; 30SBM=300 g/kg SBM diet.
Each value is median from 15 samples.
a,bValues within a row with different superscripts differ significantly at P<0.05.
Discussion
A few studies have investigated the utilization of plant dietary inclusion in European sea bass, but mainly as a FM replacement. More recently, the combination of maximum replacement of FM and fish oil by alternative meals and oils was evaluated (Torrecillas et al., Reference Torrecillas, Robaina, Caballero, Montero, Calandra, Mompel, Karalazos, Kaushik and Izquierdo2017). The present study compared the effects of diets containing different plant protein blends, maintaining constant the FM level (20%), on the performance of European sea bass.
As reported by Médale and Kaushik (Reference Médale and Kaushik2009), a blend of plant protein sources can replace 75 to 95% of FM in almost all species, thus reducing the pressure of aquaculture on marine resources. The authors also reported that to limit the negative effects of each raw material, the strategy adopted is to replace FM with a mixture of vegetable protein sources. Kaushik et al. (Reference Kaushik, Covès, Dutto and Blanc2004) observed that an almost total replacement of FM by a mixture of several plant protein sources had no influence on final weight at commercial size in European sea bass. Geay et al. (Reference Geay, Ferraresso, Zambonino-Infante, Bargelloni, Quentel, Vandeputte, Kaushik, Cahu and Mazurais2011) found that European sea bass fed an exclusively vegetable-based diet exhibited significantly lower final weight and daily growth index than those fed a fish-based diet. Overall, one of the reasons of reduced growth in fish fed diets containing plant protein is a decrease of feed intake, due to a reduced feed palatability. Interestingly, in the present study no differences were recorded in voluntary feed intake among all feeding regimes and despite the low FM level, the inclusion of different blends of different plant feedstuff did not cause palatability problems in European sea bass.
Considering the low FM treatments, diets containing a plant blend with SBM (10SBM, 20SBM and 30SBM) brought to similar performance and protein utilization. Indeed, fish fed 0SBM diet showed lower feed and protein efficiency in comparison with 20SBM and CD. The highest inclusion of CGM in diet 0SBM may have led to a negative impact on feed conversion rate and protein utilization, since this ingredient is characterized by a low protein digestibility coefficient, as reported by Dias et al. (Reference Dias, Alvarez, Diez, Arzel, Corraze, Bautista and Kaushik2005).
No significant differences were found in VSI and this result is in agreement with those previously reported for this species (Kaushik et al., Reference Kaushik, Covès, Dutto and Blanc2004). The authors reported no differences in VSI in European sea bass fed diets containing different levels of FM incorporation. Instead, HSI values decreased on increasing the inclusion of SBM. Geay et al. (Reference Geay, Ferraresso, Zambonino-Infante, Bargelloni, Quentel, Vandeputte, Kaushik, Cahu and Mazurais2011) found lower HSI values in European sea bass fed vegetable-based diets in comparison with fish-based diets; on the contrary, Kaushik et al. (Reference Kaushik, Covès, Dutto and Blanc2004) reported no differences in European sea bass fed diets with graded levels of FM replacement. A possible explanation of the trend in HSI, found in our study, can be related to the decrease in level of wheat and nitrogen-free extract in SBM diets. As has been observed in sea bass (Dias et al., Reference Dias, Alvarez, Arzel, Corraze, Diez, Bautista and Kaushik1998; Peres et al., Reference Peres, Santos and Oliva-Teles1999), hepatosomatic index increased with the increase of dietary digestible carbohydrate.
Information on the nutritional status and health in fish species can be achieved through the study of blood metabolites (Peres et al., Reference Perez-Sanchez, Estensoro, Redondo, Calduch-Giner, Kaushik and Sitja-Bobadilla2014; Bonvini et al., Reference Bonvini, Parma, Mandrioli, Sirri, Brachelente, Mongile, Gatta and Bonaldo2015). To our knowledge, few studies have assessed blood parameters in response to SBM inclusion in low FM diets in marine species. In aquaculture, this practice is not widely spread and it is to be expected that, as occurs in relation to land animals, blood analysis will become a useful tool (Peres et al., Reference Perez-Sanchez, Estensoro, Redondo, Calduch-Giner, Kaushik and Sitja-Bobadilla2014). Data obtained in our study are within the ranges reported for European sea bass under good nutritional status (Peres et al., Reference Perez-Sanchez, Estensoro, Redondo, Calduch-Giner, Kaushik and Sitja-Bobadilla2014). However, we found some differences between feeding treatments. Hematocrit averaged between 41.4 and 46.2, with lower values recorded in fish fed diet 20SBM and 30SBM. As reported for juvenile beluga (Huso huso) (Hosseini and Khajepour, Reference Hosseini and Khajepour2013), hematocrit was significantly lowered by increasing SBM of diets. On the contrary, Moradi et al. (Reference Moradi, Imanpoor and Taghizadeh2013) reported that hematocrit concentration decreased parallel to plant protein inclusion in diet in Cyprinus carpio. Plasma proteins averaged between 5.7 and 5.1 g/dl, with the lowest value recorded in diet 30SBM (5.1±0.4 g/dl). Plasma protein level is usually very stable in well-nourished animals but decreases under fasting conditions (Peres et al., Reference Perez-Sanchez, Estensoro, Redondo, Calduch-Giner, Kaushik and Sitja-Bobadilla2014). Triglycerides and cholesterol levels are in agreement with previously reported values for this species (Couto et al., Reference Couto, Kortner, Penn, Østby, Bakke, Krogdahl and Oliva-Teles2015), but higher than those reported by Peres et al. (Reference Perez-Sanchez, Estensoro, Redondo, Calduch-Giner, Kaushik and Sitja-Bobadilla2014). Regarding cholesterol, values decreased with the increasing of SBM inclusion within low FM diets. Our data confirm the hypocholesterolemic effect of soybean components in European sea bass, as previously reported in several researches (Gómez-Requeni et al., Reference Gómez-Requeni, Mingarro, Calduch-Giner, Médale, Martin, Houlihan, Kaushik and Pérez-Sánchez2004; Couto et al., Reference Couto, Kortner, Penn, Østby, Bakke, Krogdahl and Oliva-Teles2015).
Regarding histology, no inflammatory and/or degenerative changes were recorded in any of the histological sections. European sea bass seems to be less sensitive to certain soy-anti-nutritional factors, which induce intestinal disturbances in salmonids (Tibaldi et al., Reference Tibaldi, Hakim, Uni, Tulli, de Francesco, Luzzana and Harpaz2006). Bonaldo et al. (Reference Bonaldo, Di Marco, Petocchi, Marino, Parma, Fontanillas, Koppe, Mongile, Finoia and Gatta2008) also reported no evidence of soy-induced enteritis in European sea bass juveniles fed diets with 35% of FM and 30% of SBM. Our results support the thesis that SBM, even at the high inclusion rate of 30% in a diet with only 20% of FM, did not lead to soy-induced enteritis in European sea bass. Further, no differences were recorded in measurement and scoring in proximal and distal tracts in CD and 30SBM diets, and a slight depletion of goblet cells in proximal tracts in 30SBM diet was the only difference reported. A few references are available on this subject. Olsen et al. (Reference Parma, Candela, Soverini, Turroni, Consolandi, Brigidi, Mandrioli, Sirri, Fontanillas, Gatta and Bonaldo2007) observed in cod (Gadus morhua) goblet cell hypertrophy and hyperplasia in the distal parts of the gastrointestinal tract in fish fed high plant protein levels. Notwithstanding the above, a few studies reported a depletion in number of goblet cells in fish fed a diet with other vegetable raw materials like Jojoba meal (Saleh and Toutou, 2015) and vegetable oil (Perez-Sanchez et al., Reference Saleh and Toutou2013), but to our knowledge the reasons for this decrement are still unknown. Further investigations will be necessary to determine and understand the effects of the diets on the depletion of these cells.
In conclusion, from our findings we can state that for European sea bass: (i) different blends of plant protein did not affect feed intake despite the 20% FM dietary level; (ii) the inclusion of SBM maintains optimal growth and feed utilization in low FM diets; (iii) blood biochemistry profile showed a good nutritional status under all feeding regimes; (iv) no evidence of soy-induced enteritis was reported in any group fed low FM diets. For formulation of practical diets in on-growing of European sea bass, SBM up to 30% can be successfully incorporated in low FM.
Acknowledgments
The author would like to thank Gillian Forlivesi Heywood for English language editing.