Implications
The dairy industry utilizes glucogenic dietary supplements to improve energy balance and, potentially, reproductive performance. This study illustrates the interactions between the frequently used glucogenic supplement, liquid propylene glycol and the animal’s reproductive status. The combined effect of the metabolic response to propylene glycol drenching and estrous-cycle stage changed the milk’s fatty acid composition, as well as phospholipid composition and concentration, and may induce structural modifications of the milk fat globule.
Introduction
Milk fat is secreted in a unique structure termed milk fat globule (MFG), which consists of a triglyceride core covered with three layers of polar lipids and proteins termed MFG membrane (Mather and Keenan, Reference Mather and Keenan1998). Polar lipids are considered health-promoting bioactive constituents in the human diet due to their effect on plasma lipid profile, colon cancer pathogenesis and even gut bacteria population (Dillehay et al., Reference Dillehay, Webb, Andalfred and Merrill1994; Burgess et al., Reference Burgess, Neville, Rouillard, Harder, Beanlands and Sparks2005). The concentrations of polar lipids in milk also have industrial implications due to their emulsifying properties, which are required for some food systems (Thompson and Singh, Reference Thompson and Singh2006). Hence, understanding how milk polar lipid composition and yield are determined can provide novel means for improving dairy product quality for human consumption.
Milk polar lipid composition and concentration are closely associated with lactation stage (Bitman and Wood, Reference Bitman and Wood1990), genetic predisposition (Argov-Argaman et al., Reference Argov-Argaman, Mida, Cohen, Visker and Hettinga2013), plasma insulin concentration (Argov-Argaman et al., Reference Argov-Argaman, Mbogori, Sabastian, Shamay and Mabjeesh2012) and diet (Lopez et al., Reference Lopez, Briard-Bion, Menard, Rousseau, Pradel and Besle2008). In general, milk polar lipid composition and concentration are altered when systemic or local – within the mammary gland – changes in lipid metabolism are induced. Two factors with a known effect on whole-body lipid metabolism are insulin and progesterone (Bauman and Currie, Reference Bauman and Currie1980; Flint et al., Reference Flint, Clegg and Knight1984; Li et al., Reference Li, Wang, Lin and Lin2007). Although the concentrations of both hormones are frequently altered by glucogenic dietary supplementation in dairy cows and during the animal’s estrous cycle, respectively, information about their individual and combined effects on lipid composition in milk is still scarce.
Propylene glycol is a food industry by-product and a well-known glucogenic dietary supplement for dairy cows. Propylene glycol is often used to improve dairy cows’ energy balance at early lactation stages, primarily due to its ability to provide concentrated energy, which is rapidly absorbed and metabolized. In the rumen, propylene glycol administration elevates propionate and decreases acetate concentrations (Shingfield et al., Reference Shingfield, Jaakkola and Huhtanen2002). Post-absorption, the elevated propionate increases plasma glucose concentration (Miyoshi et al., Reference Miyoshi, Pate and Palmquist2001; Rizos et al., Reference Rizos, Kenny, Griffin, Quinn, Duffy, Mulligan, Roche, Boland and Lonergan2008), which may lead to a transient increase in plasma insulin concentration (Rizos et al., Reference Rizos, Kenny, Griffin, Quinn, Duffy, Mulligan, Roche, Boland and Lonergan2008) and reduced plasma non-esterified fatty acid (NEFA) concentrations when applied at early lactation stages (Burhans et al., Reference Burhans, Briggs, Rathmacher and Bell1997; Stokes and Goff, Reference Stokes and Goff2001). Fatty acids absorbed from the plasma, including NEFA, are considered to be the source of long-chain fatty acids (>16C) in milk (Bauman and Griinari, Reference Bauman and Griinari2003; Corl et al., Reference Corl, Butler, Butler and Bauman2006; Couvreur et al., Reference Couvreur, Hurtaud, Marnet, Faverdin and Peyraud2007). Therefore, propylene glycol may alter milk lipid composition by modulating NEFA availability to mammary gland cells and by altering the availability of lipogenic precursors, for example, acetate, from the rumen, for lipogenesis by mammary gland cells.
Progesterone has been shown to modulate the partitioning of lipid precursors between mammary gland and adipose tissue, primarily by inducing opposing changes in lipoprotein lipase (LPL) activity and expression in these two tissues (Bauman and Currie, Reference Bauman and Currie1980; Flint et al.,Reference Flint, Clegg and Knight1984). LPL hydrolyzes lipoprotein triglycerides, releasing fatty acids, which are utilized by the mammary gland as preformed fatty acids. Hence, changes in progesterone concentration might modulate the availability of preformed fatty acids from the circulation to the mammary gland by changing LPL expression and activity, and thus affect milk fatty acid composition.
In the present study, we hypothesized that fluctuations in progesterone concentration during the estrous cycle might modulate lipid metabolism in the mammary gland and hence affect the composition of milk lipids. In addition, we studied the effect of propylene glycol supplementation on milk lipid composition, as well as its interaction with progesterone concentration. To reduce the confounding effect of propylene glycol on plasma NEFA concentrations and subsequently on milk fatty acid composition, cows allocated to this study were at 60 days in milk (DIM). At this stage of lactation, cows are transitioning from negative to positive postpartum energy balance (i.e. adipose lipolysis rate is decreasing) and therefore, the effect of propylene glycol administration on NEFA plasma concentration (Burhans et al., Reference Burhans, Briggs, Rathmacher and Bell1997; Stokes and Goff, Reference Stokes and Goff2001) is expected to be modest. In addition, at this stage of lactation, the mammary gland utilizes more lipogenic precursors, such as acetate, and less NEFA for lipogenesis (Gross et al., Reference Gross, van Dorland, Bruckmaier and Schwarz2011). To examine the effect of estrous-cycle day on milk lipid composition, cows were synchronized and plasma levels of insulin and progesterone were determined on day 1 and 8 post-estrus in both treated (with propylene glycol) and untreated cows. During this period, a spontaneous increase in plasma progesterone concentration is expected upon corpus luteum formation.
Material and methods
Cows and treatments
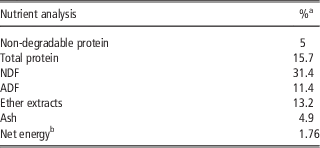
The experimental protocol for the study was approved by the Volcani Center Animal Care Committee and was conducted at the Isra’el dairy farm, Israel. Thirty-seven Israeli Holstein cows, 60 DIM in their first, second or third lactation, were assigned to the study. Only healthy cows were included as determined by the local veterinarian 2 weeks before the start of the study. Body condition score was determined 1 week before expected parturition and 40 days postpartum. The cows were free to move around in covered pens with an adjacent yard and provided total mixed ration, formulated to meet or exceed NRC requirements (2001), ad libitum (Table 1). The treatment group was drenched with 850 ml/day liquid propylene glycol after the morning milking, but before they were allowed to return to their stalls. Cows were milked three times a day at 8-h intervals and milk production was recorded electronically.
Chemical composition of cows’ diet

a Chemicals are expressed as % of dry matter.
b MCal/kg dry matter.
Cows were given two injections (625 ng each) of the prostaglandin F2α (PGF2α) analog cloprostenol (Estrumate, Coopers Animal Health Ltd, Berkhamsted, UK) 14 days apart, beginning after 60 DIM to facilitate estrus detection. After the second PGF2α injection, cows were visually observed for signs of standing estrus. Alternatively, time of estrus was determined by pedometric system (S.C.R. Engineers, Ltd, Nethanya, Israel). Day of estrus was designated day 0.
Cows were blocked by body condition score at 40-day postpartum (Wildman et al., 1982) and for cows at second and third lactation, according to their previous lactation’s milk yield. Cows were then assigned to control (n=18) or treatment (n=19) groups. Animals were held as controls or drenched for 11 days with 850 ml/day liquid propylene glycol. To ensure that corpus luteum formation occurs in a high-insulin state, treatment was begun 3 days before expected estrus and lasted until 8 days post-estrus. Cows were excluded from the study if standing estrus was not detected. The final number of animals reaching the conclusion of the experiment was 13 for the control and 13 for the treatment group.
Samples
Blood samples were collected three times a day from 1 day after the second PGF2α injection (day −3) till the end of the experiment. A 5-ml aliquot of blood was taken from the tail vein into vacuum tubes (Boston Dickinson Systems, Cowley, UK). The first sampling was performed 17 h after food distribution and 2 h before the morning milking. The second blood sample was collected ∼5 h after food distribution. The third blood sample was collected after the evening milking, ∼8 h after food distribution. Plasma was separated immediately from the blood samples and stored at −18°C until analysis.
Milk samples were collected from the morning milking on days 1 and 8 post-estrus. Milk solids were monitored and recorded by the S.C.R. dairy herd management system (S.C.R. Engineers, Ltd). Milk fat, protein and lactose contents were determined by mean Iranalysis (standard IDF 141C, 2000) at the Israeli Cattle Breeders Association laboratory (Caesarea, Israel).
Plasma hormone and metabolite measurements
Plasma insulin concentration was determined in the morning and evening samples by radioimmunoassay (Coat-A-Count Insulin diagnostic kit, Siemens Medical Solutions Diagnostics, Los Angeles, CA, USA) with intra- and interassay CV of 7.2% and 5.1%, respectively. Plasma progesterone concentration was determined by radioimmunoassay (TKPG1, Coat-A-Count diagnostic kit, Siemens Medical Solutions Diagnostics) with a sensitivity of 0.2 ng/ml, and intra- and interassay CV of 10% and 10.2%, respectively. Plasma NEFA concentration was determined in blood samples collected around noon by Wako NEFA C test kit (Wako Chemicals GmbH, Neuss, Germany).
Extraction of total lipids and fatty acid methyl ester (FAME) preparation
Total lipids were extracted from the milk using the cold-extraction procedure (Folch et al., Reference Folch, Lees and Sloane Stanley1957) with minor adaptations as previously described (Argov-Argaman et al., Reference Argov-Argaman, Mbogori, Sabastian, Shamay and Mabjeesh2012). Each sample was divided into two equal portions: one was used for lipid analysis by normal-phase liquid chromatography and the other was used for fatty acid analysis by gas chromatography. For liquid chromatography of polar lipids, total lipids were extracted from 0.5 ml of milk with methanol, chloroform and water (1 : 2 : 0.6, v/v), filtered and dissolved in 100 µL chloroform–ethanol (3%). For gas chromatography analysis, total lipids were extracted from 0.5 ml of milk with methanol, chloroform and water (1 : 2 : 0.6, v/v) and used to generate FAME by incubation of the lipid extract in 2.5 ml of 5% (v/v) H2SO4–methanol in a 65°C water bath for 1 h. After incubation, FAME were restored by the addition of 1.9 ml petroleum ether and 3.5 ml double-distilled water. The upper phase was collected and evaporated under vacuum, and 100 µL petroleum ether was added before injection for analysis.
Gas chromatography analysis
The analysis was performed in a gas chromatograph (Agilent Technologies, Santa Clara, CA, USA) equipped with a fused-silica capillary column (60 m×0.25 mm ID, DB-23, Agilent Technologies) as previously described (Argov-Argaman et al., Reference Argov-Argaman, Mbogori, Sabastian, Shamay and Mabjeesh2012). Briefly, oven temperature was programmed from 130°C to 170°C at a rate of 27°C/min, from 170°C to 215°C at 2°C/min, holding at 215°C for 8 min, from 215°C to 250°C at 40°C/min, holding at 250°C for 5 min. Run time was 37.9 min. Helium was used as the carrier gas at 2.21 ml/min. Peaks were identified by comparison with retention times of two external standards: for polyunsaturated fatty acids (PUFA), PUFA-2 (Sigma Aldrich Israel Ltd, Rehovot, Israel), and a FAME C8:0 to C24:0 mix (Supelco, Bellefonte, PA, USA). The area of each fatty acid peak was recorded using ChemStation software (Agilent Technologies) and fatty acid weights were calculated using the internal standard’s area under the curve and presented as g/kg fat.
Analysis of polar and neutral lipids
Polar and neutral lipids were identified and quantified by HPLC (HP 1200, Agilent Technologies) combined with an evaporative light-scattering detector (ELSD; Agilent Technologies) as previously described (Argov-Argaman et al., Reference Argov-Argaman, Mbogori, Sabastian, Shamay and Mabjeesh2012). The separation process was managed by ChemStation software, which permitted data acquisition from the ELSD. Lipid identification was performed using external standards: triacylglycerol, diacylglycerol, monoacylglycerol, free fatty acids, cholesterol, phosphatidylethanolamine (PE), phosphatidylinositol (PI), phosphatidylserine (PS), phosphatidylcholine (PC) and sphingomyelin (SM). Standard curves were used to calculate the weight percentage of each of the identified phosopholipids and cholesterol from the overall weight of the identified membrane components (i.e. cholesterol, PE, PI, PS, PC, SM), as indicated below.
HPLC/ELSD calibration
The identification of phospholipids and SM was carried out by comparison with the retention time of pure standards. To evaluate phospholipids and SM, five calibration curves were determined from the area values obtain by injecting different amounts of standard: cholesterol (2 to 15 μg), free fatty acids (5 to 80 μg), PE and PS (2 to 25 μg), PI (5 to 80 μg), PC (0.5 to 10 μg) and SM (5 to 80 μg). Calibration curves were calculated by applying the equations of the power model to the area and concentration values; cholesterol: y=0.1016×0.49 (r 2=0.97), free fatty acids: y=1.73×0.41 (r 2=0.99), PE: y=0.035×0.63 (r 2=0.99), PI: y=0.114×0.607 (r 2=0.99), PC: y=0.051×0.603 (r 2=0.99), SM: y=0.11×0.62 (r 2=0.99), PS: y=0.0824×0.7645 (r 2=0.99). The sum of the glycerophospholipid, SM and cholesterol concentrations was regarded as the total membrane weight (100%). Each of the polar lipids’ weights in 1 ml of milk was calculated according to the standard curves, and weight percentage of total membrane lipids (PE+PI+PC+SM+PS+cholesterol) was determined.
Statistical analysis
The statistical analyses were performed using JMP 7® (SAS Institute Inc., Cary, NC, USA). Differences between treatment and control groups, and within and between days were compared by repeated measures analysis (for day 1 and 8 post-estrus) using repeated measures ANOVA. The main effects were treatment, day in estrous cycle and progesterone plasma concentration, and treatment by days post-estrus and treatment by progesterone interactions, with individual cow nested in the treatment. Parity number and the interactions between parity number and treatment, parity number and progesterone concentration, and parity number and insulin were excluded from the model after finding no significant effect on milk yield or composition. Data are presented as least square means and standard deviation (s.d.). Significance level was set at 0.05.
Results
Plasma hormone and metabolite concentrations
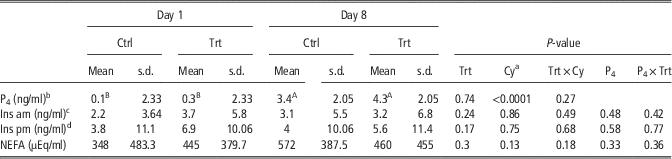
Progesterone concentrations were affected by day of the estrous cycle. Similar progesterone concentrations were found in both groups on day 1 post-estrus, and in both groups, progesterone concentrations increased 10-fold from day 1 to 8 post-estrus.
Drenching with propylene glycol did not change plasma insulin concentrations on either sampling day, or in morning v. evening samples (Table 2). NEFA concentrations measured in plasma collected at noon on days 1 and 8 post-estrus did not differ between groups and was not affected by cycle day or treatment (P=0.13 and 0.3, respectively).
Plasma progesterone, insulin and NEFA concentrations in cows drenched with liquid propylene glycol (Trt) compared with non-drenched controls (Ctrl) on days 1 and 8 post-estrus

Cy=cycle day; P4=progesterone; Ins=insulin; NEFA=non-esterified fatty acids.
Values are least square means and s.d., n=26.
a Days post-estrous.
b Concentration in plasma samples.
c Concentration in morning blood samples.
d Concentration in evening blood samples.
Different letters indicate significant differences between groups and between days, P⩽0.05.
Milk parameters
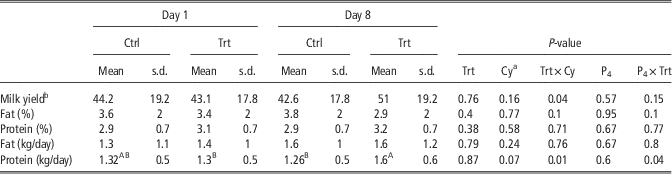
Milk yield was affected by the cycle day×treatment interaction (P=0.04), but no significant differences were found between groups within the same sampling day (Table 3). Milk protein yield was affected by the interactions between cycle day and treatment and progesterone and treatment (P=0.01 and 0.04, respectively), and was higher in the treatment group on day 8 post-estrus than in controls on day 8 post-estrus and the treatment group on day 1 post-estrus.
Milk yield, and concentration of fat and protein in milk collected from cows drenched with liquid propylene glycol (Trt) compared with non-drenched controls (Ctrl) on days 1 and 8 post-estrus

Cy=cycle day; Ins=insulin; P4=progesterone.
Values are least square means and s.d., n=26.
a Days post-estrus.
b Mean daily milk yield, liter per day.
Different letters indicate significant differences between groups and between days, P⩽0.05.
Milk polar lipid composition and diurnal yield
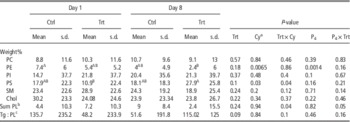
Milk PE concentration was affected by both cycle day and progesterone concentration (P=0.006 and 0.001, respectively), with a lower concentration on day 8 post-estrus in the treatment group compared with the control group on day 1 post-estrus (Table 4). The combined effect of cycle day and treatment affected milk PS concentration (P=0.04) with a 2.5-fold higher concentration in the treatment group on day 8 v. day 1 post-estrus.
Polar lipid composition (weight %) of milk collected on days 1 and 8 post-estrus from cows drenched with propylene glycol (Trt) compared with non-drenched controls (Ctrl)

Cy=cycle day; Ins=insulin; P4=progesterone; PC=phosphatidylcholine; PE=phosphatidylethanolamine; PI=phosphatidylinositol; PS=phosphatidylserine; SM=sphingomyelin; Chol=cholesterol.
Values are least square means and s.d., n=26.
a Days post-estrus.
b Daily yield of sum of polar lipids (g/day).
c Weight ratio between triglycerides and phospholipids in the sample.
Different letters indicate significant differences between groups and between days, P⩽0.05.
Polar lipid yield was strongly influenced by the combined effect of progesterone level and treatment. The daily yield of the sum of polar lipids was affected by the combined effect of cycle day and treatment (P=0.04) and the interaction between progesterone concentration and treatment (P=0.05).
The weight ratio between triglycerides and phospholipids was determined (Table 4). The combined effect of treatment and progesterone influenced the triglyceride-to-phospholipid ratio in the samples (P=0.02). No significant differences were found between groups within the same day.
Milk fatty acid composition
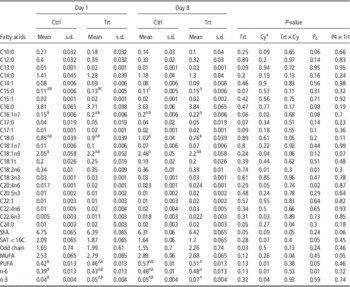
Treating the cows with propylene glycol influenced the concentration of odd-chain fatty acids, including tridecanoic, pentadecanoic, heptadecanoic and heptadecanoyl fatty acids (C13:0, C15:0, C17:0 and C17:1, respectively; Table 5). Pentadecanoic acid concentration was highest in the treatment group on day 8 post-estrus compared with the treatment group on day 1 and control group on day 8 post-estrus.
Concentration (g/kg fat) of fatty acids in milk collected on days 1 and 8 post-estrus from cows drenched with propylene glycol (Trt) compared with non-drenched controls (Ctrl)

Cy=cycle day; Ins=insulin; P4=progesterone; SFA=sum of saturated fatty acids in g/100 g fat; odd chain=sum of odd-chain SFA in g/100 g fat; MUFA=sum of monounsaturated fatty acids in g/100 g fat; PUFA=sum of polyunsaturated fatty acids in g/100 g fat; O6=sum of n-6 PUFA in g/100 g fat; O3=sum of n-3 PUFA in g/100 g fat.
Values are least square means and s.d., n=26.
a Days post-estrus.
Different letters indicate significant differences between groups and between days, P⩽0.05.
The summed concentration of odd-chain fatty acids was affected by treatment (P=0.03) and was highest in the treatment group on day 8 post-estrus relative to the control group on days 1 and 8 post-estrus.
Cycle day and progesterone alone, or their interaction with treatment, affected most of the milk fatty acids. For example, cycle day influenced palmitoleic acid (C16:1n7) concentrations (P=0.02) with a 45% higher concentration in the treatment group on day 8 post-estrus than in the control group on day 1 post-estrus. The concentration of stearic acid (C18:0) was affected by the interaction between cycle day and treatment (P=0.05) and was 25% lower in the treatment v. control group on day 8 post-estrus. The concentration of oleic acid (C18:1n9) was also affected by cycle day (P=0.04) and was highest in the control group on day 8 post-estrus, and 20% lower in the control group on day 1 post-estrus. The concentration of milk PUFA was mostly affected by either cycle day or progesterone level, or both. For example, the concentration of linoleic acid (C18:2n6) was affected by cycle day (P=0.01). Cycle day and progesterone concentration affected the concentration of arachidonic acid (C20:4n6). The same pattern was found for docosahexaenoic acid concentration (C22:6n3), which was affected by cycle day (P=0.03). When fatty acids were grouped according to their biochemical features, such as length and number of unsaturated bonds, their concentration was mostly affected by cycle day and progesterone concentration, and to a much lesser extent by treatment. The concentration of total PUFA was affected by cycle day and progesterone concentration (P=0.01 and 0.05, respectively) and was highest on day 8 post-estrus in the treatment group, and 20% lower in the control group on day 1 post-estrus. The concentration of total n-6 fatty acids was also influenced by cycle day and progesterone concentration (P=0.01), with a higher concentration in the treatment group on day 8 post-estrus than in the control group on day 1 post-estrus. The same was found for the sum of all n-3 PUFA in the milk, which was affected by cycle day (P=0.04) and was 75% higher in the treatment group on day 8 post-estrus than in the control group on day 1 post-estrus. The summed concentration of all saturated fatty acids in the milk was affected by the interaction between cycle day and treatment (P=0.05), with no significant differences between treatment groups.
Discussion
The results of the present study illustrate a strong effect of the fluctuations in progesterone concentration during the estrous cycle on milk lipid constituents. Moreover, the combination of drenching with propylene glycol and plasma progesterone concentration had a strong effect on polar lipid composition and yield. On the other hand, treatment alone (i.e. drenching dairy cows with propylene glycol) affected only a few minor constituents of milk fat.
Propylene glycol is a glucogenic dietary supplement, which has been used in the dairy industry for several decades. Recent interest in this product stems from its increased supply in the feed industry (Nielsen and Ingvartsen, Reference Nielsen and Ingvartsen2004). Nevertheless, claims have been made regarding the effects of glucogenic additives (van Knegsel et al., Reference van Knegsel, van den Brand, Dijkstra, van Straalen, Jorritsma, Tamminga and Kemp2007), and specifically propylene glycol, on milk production and reproductive performance. In the present study, to avoid the confounding effect of lowering NEFA concentrations by propylene glycol drenching, which would in itself alter milk lipid composition, the cows were at 60 DIM. Therefore, the massive mobilization of body reserves, in the form of NEFA, which at earlier lactation stages serves as the main source for milk lipid synthesis (Mcguire et al., Reference Mcguire, Theurer, Vicini and Crooker2004), was avoided. The fact that in the current study treatment had no impact on plasma NEFA concentration validates our selected study design.
Drenching with propylene glycol did not increase insulin concentrations in either morning or evening plasma samples. Individual metabolic variations in terms of metabolic response to propylene glycol administration, as previously shown (Miyoshi et al., Reference Miyoshi, Pate and Palmquist2001), could explain the high standard deviations reported in each group and at each time point. This great variability resulted in a non-significant increase in insulin in the evening samples. The fact that no differences were found in the morning samples might be attributed to the proximity of blood sampling time to the propylene glycol drenching, because plasma insulin concentration is expected to peak ∼2 h after propylene glycol administration (Studer et al., Reference Studer, Grummer, Bertics and Reynolds1993; Grummer et al., Reference Grummer, Winkler, Bertics and Studer1994).
In a previous study, following alteration of lipid metabolism in the mammary gland by hyperinsulinogenic clamp, PS was the main MFG membrane constituent to show changes in concentration (Argov-Argaman et al., Reference Argov-Argaman, Mbogori, Sabastian, Shamay and Mabjeesh2012). Similarly, in the present study, the combined effect of treatment and cycle day affected PS. Moreover, cycle day and progesterone concentration also influenced PE concentration in the milk. Altered milk phospholipid composition is associated with structural differences for the MFG (Mesilati-Stahy and Argov-Argaman, Reference Mesilati-Stahy and Argov-Argaman2014). Accordingly, the altered composition of milk polar lipids found here was associated with a triglyceride-to-phospholipid ratio in the milk that indicated altered MFG diameter (Mesilati-Stahy and Argov-Argaman, Reference Mesilati-Stahy and Argov-Argaman2014). Such structural modifications of the MFG might have nutritional implications for human health (reviewed by Michalski, Reference Michalski2007), as well as industrial implications due to their effect on dairy products’ textural and physical properties (Michalski et al., Reference Michalski, Gassi, Famelart, Leconte, Camier, Michel and Brierd2003; Lopez et al., Reference Lopez, Briard-Bion, Ménard, Beaucher, Rousseau, Fauquant, Leconte and Robert2011). A change in MFG mean diameter is expected to alter polar lipid yield, as was found in the present study under the combined effect of treatment and progesterone concentration. Taken together, the results show that the effect of drenching with propylene glycol on polar lipid yield is dependent on the cow’s estrous-cycle stage and plasma progesterone levels. Therefore, protocols that are used to improve or modify milk lipid composition should consider the animal’s reproductive status, as this can change the effect of the dietary supplement on milk lipid composition.
The major effect of drenching dairy cows with propylene glycol found in the present study was an elevated concentration of odd-chain fatty acids. Administration of propylene glycol has been shown to rapidly increase propionate and decrease acetate concentrations in the rumen (Christensen et al., Reference Christensen, Grummer, Rasmussen and Bertics1997). The rapid elevation in propionate upon propylene glycol administration (Emery et al., Reference Emery, Brown and Black1967; Shingfield et al., Reference Shingfield, Jaakkola and Huhtanen2002) might induce de novo synthesis of odd-chain fatty acids in the mammary gland (Vlaeminck et al., Reference Wildman, Jones, Wagner and Bowman2006) and hence increase their concentration in the milk.
The elevated propionate concentration induced by propylene glycol administration could also explain the elevated protein yield on day 8 post-estrus for the treatment group relative to the controls (Agle et al., Reference Agle, Hristov, Zaman, Schneider, Ndegwa and Vaddella2010). One might assume that these changes in milk composition were due to changes in dry matter intake. However, oral drenching of propylene glycol, as performed in the present study, is the most effective way of allocating propylene glycol without affecting dry matter intake (Miyoshi et al., Reference Miyoshi, Pate and Palmquist2001).
Additional evidence for the role of estrous-cycle day and plasma progesterone concentration in regulating milk lipid composition was provided by the reported milk fatty acid compositions. For example, milk PUFA concentration was higher on day 8 post-estrus than on day 1, under the regulation of cycle day and progesterone. The PUFA found in milk are dietary in origin. The mammary gland absorbs and incorporates these fatty acids from the circulation into the milk fat by using LPL and fatty acid-binding proteins (Bauman and Davis, 1974; Lehner and Kuksis, Reference Lehner and Kuksis1996; Bernlohr et al., Reference Bernlohr, Coe and LiCata1999). In rat mammary gland, progesterone has been shown to increase LPL activity (Hadsell et al., Reference Hadsell, Parlow, Torres, George and Olea2008). The major hormonal change associated with cycle day is the transition from an estrogen-dominant environment at the follicular stage of the cycle (days 0–2) to a progesterone-dominant environment in the early luteal phase (days 7–8; Bauman and Davis, 1974). Hence, milk collected on day 1 post-estrus was most probably synthesized in a high estrogen/low progesterone environment, whereas milk collected on day 8 post-estrus was synthesized in a high progesterone/low estrogen one. It is therefore possible that the changes in progesterone concentration during the estrous cycle underlie the changes in milk PUFA concentration reported here.
Summing up, we examined the effect of propylene glycol drenching and progesterone concentration (i.e. day of estrous cycle) on milk fatty acid and lipid species composition and yield in dairy cows. Results indicate that propylene glycol administration 60 days postpartum affects the concentration of odd-chain fatty acids in milk. The PUFA and saturated fatty acid concentrations were affected by cycle day, which suggests that the changes in the hormonal milieu during the estrous cycle play a role in regulating milk lipid composition. Finally, changes in the composition and yield of milk polar lipids suggest that cycle day influences the MFG structure. This warrants further study due to its possible implications for human health and the dairy industry.
Acknowledgments
This publication was made possible in part by support from the Israeli Dairy Board under Cooperative Agreement No. 039820, and the Israeli Agricultural Ministry Chief Scientist under Cooperative Agreement No. 0396768. Sponsors had no role in study design, collection, analysis or interpretation of the data, or in the writing or publication of the data.