Protection of domestic firms against foreign competitors has a long history both in its operation and in its theoretical justifications. Robert C. Allen (Reference Allen2011) sees protection along with investment in human capital, unification of domestic markets, and financial development, as key elements in fostering modern economic growth in Europe and in the United States in the late nineteenth century and early twentieth century. Jeffrey G. Williamson (Reference Williamson2011) argues that less developed countries damaged by changes in the relative prices of primary product succeeded in reviving their industrial sectors in the twentieth century, by protecting their manufactures.
How protection affects economic growth historically is an empirical issue. Until quite recently, with the notable exception of a seminal paper by Forrest Capie (Reference Capie, Black and Winters1983), its effects were simply inferred from a comparison of growth rates between free-trade and protectionist countries (Bairoch Reference Bairoch, Mathias and Pollard1989). Since 2000, this crude post hoc propter hoc reasoning has increasingly been replaced by econometric testing such as by Kevin O'Rourke (Reference O'Rourke2000), who runs a panel growth regression for ten countries. Contrary to his expectations, he found a positive and significant effect of tariffs on economic growth. Using different datasets this “tariff-growth paradox” was confirmed, by Athanasios Vamvakadis (Reference Vamvakadis2002), Michael Clemens and Williamson (Reference Vamvakadis2004), and David Jacks (Reference Jacks2006), but not by Moritz Shularick and Solomos Solomou (Reference Jacks2011) in the most comprehensive and technically sophisticated analysis so far.Footnote 1 In their work, the tariff variable is either not significant or negative, more in line with the predictions of standard economic theory. More recently, Markus Lampe and Paul Sharp (Reference Lampe and Sharp2013), rather than assuming a common effect of protection on economic growth of all countries, examine country-specific causality relations between tariffs and gross domestic product (GDP) in a two-variable cointegrated VAR model framework for 24 countries from 1870–1913 (and also for 1950–2000). They conclude that “our results show clearly that there is no uniform ‘treatment effect’ of tariff levels on economic performance for all countries, as regards neither the sign nor the direction of causality” (Lampe and Sharp Reference Lampe and Sharp2013, p. 221).
In this article, we argue that the measurement of protection used has implications for the results. In this literature, the level of protection is measured by the ratio of custom revenues to the value of imports (nominal protection or NT). However, NT fails to capture the impact of quantitative restrictions and biases downward measures of protection if the import elasticity is not zero (Pritchett and Sethi Reference Pritchett and Sethi1994). To see this, consider a situation where tariff rates are so high as to prohibit imports. In this case NT is zero, implying zero protection for that industry, rather than extremely high protection causing imports to drop to zero. Solving the problem is less easy than pinpointing it. Often scholars have used different weighting schemes in an attempt to get an unbiased measure of protection. More recently, James Anderson and Peter Neary have proposed the Trade Restrictiveness Index (TRI).Footnote 2 Their original, general equilibrium, version of the index is data and computationally intense. Robert C. Feenstra (Reference Feenstra, Grossman and Rogoff1995) has elaborated a much less data-intensive version (or TRIP to distinguish it from the original Anderson-Neary version), which yields yearly series of trade protection in addition to estimates of welfare losses. In this article, we compute this Feenstra approximation for Italy from unification in 1861 to the eve of the Great Depression in 1929.Footnote 3 In those years, in Italy, as in all major European countries, duties were considered the main tools of industrial policy. Their effects, however, were hugely controversial, and they still are a major issue in the scholarly debate on Italian economic growth.Footnote 4
We begin this article with a short description of Italian trade policy comparing levels of NT in Italy to other countries to argue that Italy was fairly representative of the historical pattern of NT for the Great Powers of Continental Europe (James and O'Rourke Reference James, O'Rourke and Gianni2013). Then we sketch out the method to estimate the TRIP, discussing the potential biases of the results and providing essential information on sources we use. We find that, for Italy, protection and thus welfare losses were fairly low, other than protection on sugar. In the following, we show that our estimates of TRI are robust to changes in data (e.g., different level of aggregation or different sets of elasticities). We discuss the extent of the bias in NT and its changes over time, for Canada, Italy, and the United States. The outcome is straightforward: the relation between TRI and the NT differs by country and in time and thus it is impossible to infer the former from the latter. Finally, we confirm that using the TRI in place of a more conventional NT measure can lead to significantly different empirical results and a re-evaluation of the role of tariffs as a policy tool.
THE ITALIAN PROTECTION IN COMPARATIVE PERSPECTIVE
The unification of Italy in 1861 took place at a time when world trade was booming (Federico and Tena-Junguito Reference Federico and Tena-Junguito2015a). The Kingdom of Sardinia (the official name for Piedmont) and Tuscany had liberalized its trade regime earlier and the new country adopted the Piedmontese tariff in 1861. Despite loud protests from industrialists, the new Kingdom further cut import duties three years later in a trade treaty with France.Footnote 5 In 1878, responding to industrialist protest, Italy became the first major country in Continental Europe to return to protection, but with duties only on some industrial products. The relevance of these 1878 tariffs are often downplayed as they were reduced by the trade treaty with France three years later in 1881. The subsequent fall in prices of cereals on the international market, which threatened the economic conditions for a substantial share of landowners, changed domestic tariff policy. In March 1887, the Italian Parliament approved both a new tariff on industrial goods and a sharp increase in duty on wheat, beginning a period of sharp increase in protection. The duties on some commodities, including wheat, were increased several times, officially to raise revenues. Italy not only entered in a trade war with France, by then its main trading partner, but also tried to find alternative outlets for its goods by signing treaties with Austria-Hungary, Germany, and Switzerland in 1892–1893 and again in 1904–1906. Resulting cuts in duties were extended to all partners (including France after 1898) via the most-favoured nation (MFN) clause. Trade was strictly regulated from WWI until 1920, later a new, and thought to be very protectionist, tariff on industrial goods was finally approved in 1921 (Bachi 1914–1921; De Stefani Reference De Stefani1926). The Fascist government re-instated a duty on wheat in 1926 as part of a strategy for self-sufficiency, bombastically called “battle for wheat.” Italy, as most European countries, reacted to the Great Depression by raising duties and imposing quantitative restrictions, often in the framework of bilateral clearing agreements (Tattara Reference Tattara1985). Because of the greater complexity of protection after 1929, we end our quantitative analysis at 1929.
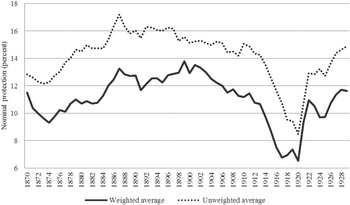
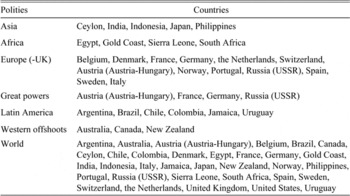
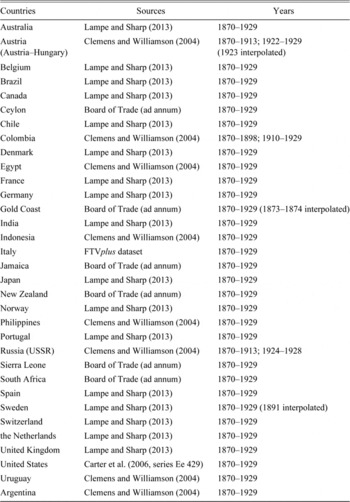
To address how representative Italy's pattern of declining and then increasing tariff protection was we have collected series of NT for 33 countries (14 in Europe, 8 in the Americas, 5 in Asia, 4 in Africa, and 2 in Oceania), from work by Clemens and Williamson (Reference Clemens and Williamson2004) and Lampe and Sharp (Reference Lampe and Sharp2013).Footnote 6 The countries in the sample account for about 81 percent of world GDP (Maddison project data) and for 89 percent of world exports in 1913 (Federico and Tena-Junguito 2Reference Federico and Tena-Junguito015a). Figure 1 plots NT for these countries showing unweighted and trade-weighted averages.
WORLD NOMINAL PROTECTION (1870–1929)

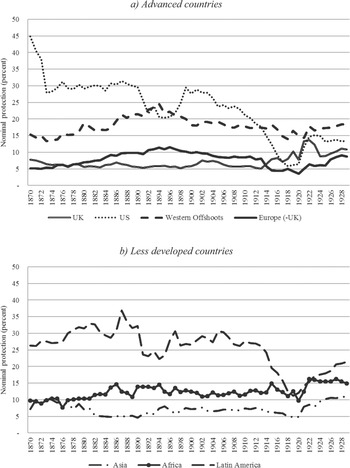
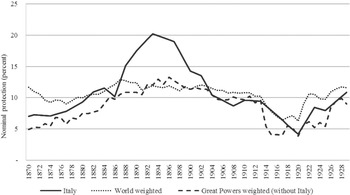
The two series are highly correlated (0.875), but the level of protection of the unweighted series is about 30 percent higher than the trade-weighted average (14.1 relative to 11.1 percent). The United Kingdom accounts for two-thirds of the difference.Footnote 7 In Figure 2, we show the trade-weighted series by groups of countries.Footnote 8 What this shows is that NT was high in Latin America (25.5 percent), United States (23.1 percent), and Australia, Canada, and New Zealand (Western Offshoots with an average of 17.9 percent). It was, low in Africa (12.3 percent) and in mainland Europe (7.8 percent) and Asia (7.2 percent). There appears to be little convergence (divergence) towards (away from) a world level of protection, and very little evidence of common movements. The coefficient of NT variation by country remained constant around 0.7 throughout the period and, out of 528 simple coefficients of correlation, for the period 1870–1913, only one-fifth (118) exceeds 0.5 and less than one-tenth (46) exceeds 0.75. The highest coefficients cluster in a group, featuring Austria-Hungary, France, Germany, Russia, and Italy, which can be considered the Great Powers of Continental Europe. For Italy NT grew along with the other Great Powers until the late 1880s, zoomed ahead in the 1890s, reaching a peak of 20.2 percent in 1893, and returned in the group at the end of the century (Figure 3). Then NT fell by one-half to 9.5 percent on the eve of WWI—still higher than France or Germany, but decidedly lower than Russia. We can only speculate on the causes of this common pattern. It may reflect the imitation between similar countries, or the waves of trade treaties, or the autonomous strategic interaction between trading partners, strengthened by the MFN clauses (Clemens and Williamson Reference Clemens and Williamson2004). Regardless, Italy appears representative, at least in terms of timing, of the evolution of protection on the European continent. Of course, relative to some of the other powers, Italy was too small to affect world prices: on average it accounted for 3.5 percent of world imports; Italian imports of wheat, cotton, and coal accounted for less than one-sixth of world trade of these goods. However, sugar did account for 32 percent of world sugar trade in 1870, but fell in the subsequent years.Footnote 9
NOMINAL PROTECTION BY GROUPS OF COUNTRIES (1870–1929)

NOMINAL PROTECTION: ITALY, THE OTHER GREAT POWERS AND THE WORLD (1870–1929)

THE TRI: SOURCES AND METHODS
As noted earlier, unlike NT, the TRI takes into account the general equilibrium effects of protection. Anderson (Reference Anderson1995, p. 160) defines the TRI as “the uniform tariff factor (domestic price) deflator, which, applied to the new tariff factors, permits the initial level of utility of the representative consumer to be supported in general equilibrium” or, more simply, “the uniform tariff that if applied to imports instead of the current structure of protection would leave home welfare at its current level” (Kee, Nicita, and Olarreaga Reference Kee, Nicita and Olarreaga2009, p. 179). His general equilibrium version is data-intensive, needing detailed data on production and consumption by product in each year and elasticities of substitution in consumption and production. It has been estimated in historical perspective by Giovanni Federico and Antonio Tena-Junguito (1998, Reference Tena-Junguito1999) for Italy and by Tena-Junguito (Reference Tena-Junguito1999) for Spain, but only for few benchmark years and with simply assumed elasticities. In contrast, in this article we make two distinct contributions: first, we compute yearly series of TRI and second we estimate a new set of time variant product specific elasticities.
To this aim, we use the much less data-intensive Feenstra (Reference Feenstra, Grossman and Rogoff1995) approximation:
![\[
\begin{array}
{\text{TRI}}^{{\text{p}}}=[\Sigma {\text{S}}_{\text{n}} \varepsilon_{\text{n}} \tau_{\text{n}}^2 /\Sigma {\text{S}}_{\text{n}} \varepsilon_{\text{n}}]^{0.5}
\end{array}
\](https://static.cambridge.org/binary/version/id/urn:cambridge.org:id:binary:20160921010151552-0225:S0022050715001552:S0022050715001552_eqn1.gif?pub-status=live)
where ε is the own-price elasticity of imports, S is the share of imports on GDP, τ is the ad valorem duty and subscript n refers to a tradable good. Hiau Looi Kee, Alessandro Nicita, and Marcelo Olarreaga (Reference Kee, Nicita and Olarreaga2008, Reference Kee, Nicita and Olarreaga2009, Reference Kee, Nicita and Olarreaga2010) show that, under the Armington assumption of imperfect substitutability between imports and domestic production, elasticities can be computed with coefficients from the regression:

where Pn is the price of the n-th good, P-n is a product-specific price index (–n = “all the rest”) and vm/vl is the ratio of the endowment of capital and labour to endowment of land (i.e., capital/land and labour/land). The own-price elasticity εnn can then be computed as:

Tariff protection will generally decrease imports and the quantity supplied in the market with a resulting increase in price to the consumer. In this framework, deadweight loss associated with protection (DWL/GDP) can be computed by substituting TRI to NT in the formula for the Haberger triangles:

The deadweight loss informs us about the loss in a given year or a given period. But when examining the impact of protection over time, we are interested in the effects of specific trade policy measures on the level of protection. To this aim, we use the Overall Trade Restrictiveness Index (OTRI).Footnote 10
![\[
\begin{array}
{\text{OTRI}} = [\Sigma {\text{S}}_{\text{n}} \varepsilon_{\text{n}} \tau_{\text{n}} /\Sigma {\text{S}}_{\text{n}} \varepsilon_{\text{n}}]
\end{array}
\](https://static.cambridge.org/binary/version/id/urn:cambridge.org:id:binary:20160921010151552-0225:S0022050715001552:S0022050715001552_eqn5.gif?pub-status=live)
Thus, the change in OTRI from one year to another (Var-OTRI) measures the change in tariffs which would have maintained imports at their actual level in both years—that is a measure of the pure change in tariffs (Kee, Nicita, and Olarreaga Reference Kee, Nicita and Olarreaga2010).
The Feenstra approximation of TRI is bound to understate the true level of protection relative to the Anderson-Neary general equilibrium version of TRI. It neglects the effects on consumption of other goods (via the substitution effects) and the effects on production costs of protection on inputs. Peter Lloyd and Donald MacLaren (2010) show that the TRIP underestimates TRI if effective protection rates are lower than nominal ones and/or if more products are substitutes than complements (and own price elasticities exceed cross-product ones). Furthermore the TRIP neglects the general equilibrium effects on factor markets. By definition, protection is aimed at increasing the returns to factors used in import-competing sectors either because they are scarce or because sector-specific (e.g., skilled labour). Thus, the general equilibrium TRI would be higher than any partial equilibrium version, unless factors are perfectly substitutable and perfectly mobile across sectors. Additionally, the TRI does not take into account the welfare effect of changes in the variety of imported goods, which have been substantial in the final decades of the twentieth century (Broda and Weinstein Reference Broda and Weinstein2006; Chen and Ma Reference Chen and Ma2012).Footnote 11
We obtain yearly data on values and quantities of imports from the Italian trade statistics (Movimento Commerciale del Regno d'Italia) for the period 1862–1929.Footnote 12 In addition, we have collected, from the same source, data on custom revenues by product for 24 benchmark years.Footnote 13 The revenues were collected in gold liras. Thus, when necessary, we adjust the figures to make them comparable to import values, expressed in paper liras.Footnote 14 We then compute nominal tariffs (τ) by product for the 24 years and we fill the gaps between benchmark years with linear interpolation. Finally, we have re-classified products according to the SITC Revision 2.0 at four-digit level and computed unit values and tariff rates for each of them. The number of these four-digit “products” vary across time from a minimum of 208 in 1863 to 433 in 1924.
We use the nominal GDP estimates by Alberto Baffigi et al. (Reference Baffigi, Stephen and Giordano2013) while we estimate the product specific domestic prices for the indexes Pn and P–n by adding the tariff rates to import prices. The series for labor and capital endowments come from Stephen Broadberry, Claire Giordano, and Francesco Zollino (Reference Broadberry, Giordano, Zollino and Toniolo2013), while the series of land is estimated by Federico from official sources. We run equation (2) for 21 years rolling windows, as well as for the whole period 1862–1929, separately for nine SITC-1 and 59 SITC 2-digit categories. We obtain yearly series of elasticities from 1873 to 1919, which we extend backwards to 1862 and forward to 1929 by assuming the parameters to have remained constant—that is, we use the average for 1873–1875 for all years before 1873 and the average for 1917–1919 for the period 1919–1929.
A NEW QUANTITATIVE HISTORY OF ITALIAN PROTECTION
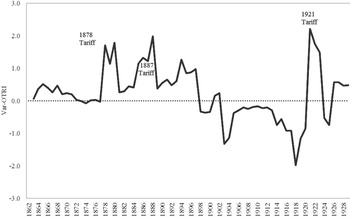
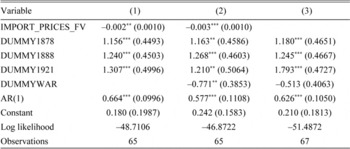
Much of the literature on Italian protection assumes that changes in protection was the result of policy decisions, notably the tariffs of 1878, 1887, and 1921 and the trade treaties of 1863 and 1904–1906. Indeed, the Var-OTRI shown in Figure 4 peaks at these dates but also shows a near continuous stream of changes.Footnote 15 Some of these changes reflect minor changes in duties, but many others are the result of changes in prices. Italy, as most countries of continental Europe, preferred to set duties in terms of physical units (specific duties), rather than as a proportion of the value of the good (ad valorem). With specific duties, any decline (increase) in prices cause, ceteris paribus, protection to rise (fall).Footnote 16 To disentangle this price effect from the effect of main policy decisions, we estimate the change in OTRI as a function of prices and a set of dummies X for major policy changes:

where PM is the index of import prices from Federico and Michelangelo Vasta (Reference Vasta2010) and X is a set of dummies for major policy changes. This latter includes the three tariffs and a dummy for war years, while dummies for the 1906 treaties are not significant. The results are reported in Table 1. The impact of each major tariff change is significant, but, contrary to the conventional wisdom, the difference between their coefficients is very small and not significant.Footnote 17
VARIATIONS (VAR-OTRI) IN ITALIAN TRADE POLICY (1862–1929)

EFFECT OF TARIFFS POLICIES ON PROTECTION

Notes:
Least Squares (dependent variable is VAROTRI), standard errors in parentheses. *** p < 0.01; ∗∗ p < 0.05; ∗ p < 0.1.
Sources:
Our own elaborations on FTVplus dataset.
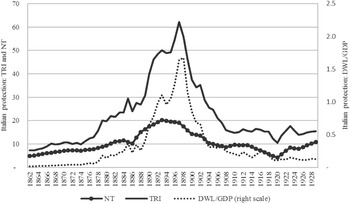
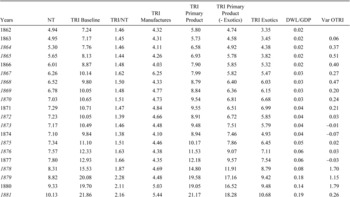
The estimates for our TRIP measure of Italian protection over the period 1862–1929 are plotted in Figure 5: TRIP increases almost constantly from about 10 percent to a peak (62 percent) in 1897 and then declines to the late 1900s and then remains fairly stable up to 1929. The levels of protection are considerably higher than those given by the more generally used measure of NT, which shows a more gradual increase and decline. The corresponding welfare losses estimated from TRIP are given on the right-hand scale as a percentage of GDP.
ITALIAN PROTECTION: TRIP, NT AND DWL (1862–1929)

As already hinted by Federico and Tena-Junguito (Reference Federico1998, Reference Federico1999), these results suggest that the literature overstates the relevance of protection. The nominal and effective protection remained fairly low, but for the spike of the 1890s, and thus cautiously they suggest that its effects on aggregate welfare and allocation of resources could not be as large as traditionally assumed. Federico and Tena-Junguito (Reference Federico1998) use NT, but the coefficient of correlation between the TRIP and the (revised) NT series is 0.95. This said, there are some relevant differences. Before discussing the economic implications, we focus on the historical evidence.
As a starting point, we conducted a Jushan Bai and Pierre Perron (Reference Bai and Perron2003) test for structural breaks in both series. Both the NT and TRIP series features breaks at the end of the 1880s (respectively, in 1888 and 1890) and at the turn of the century (in 1898 and 1900), which mark the beginning of the period of fast rise in protection and of its retreat, respectively, and conform to the historical discussion of these dates reflecting important transitions in Italian trade protection. However, the TRIP has a significant break in 1878, which tallies well with the high and significant coefficient of the dummy (Table 1). This runs counter to the conventional wisdom, which has maintained the limited impact of the 1878 tariff. Furthermore, the timing of the last break in the series differs: 1910 in the TRIP series and 1919 for NT. If the break is in 1919, this suggests that protection fell during the war and its aftermath, and rebounded in the 1920s, with the combined effect of the 1921 tariff and the duty on wheat. On the eve of the Great Depression, the NT measure was more than double its 1919 level. In contrast, the TRIP implies that protection remained constant from the end of the 1900s to the Great Depression. In other words, the effect of the 1921 tariff was transitory and that of the duty on wheat limited (cf. Figure 4).
Consistent with the low level of protection, the welfare losses from protection were generally small. They remained below 2 percent of GDP and exceeded 1 percent only for a few years in the 1890s: the total losses from protection from 1862 to 1929 were equivalent to 22 percent of the GDP, but two-thirds was concentrated in the period from 1890 to 1902.
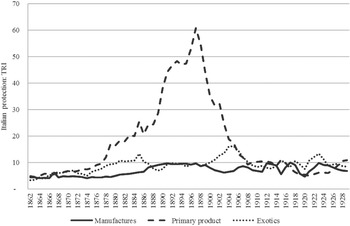
It is also possible to estimate the level of aggregate protection (and thus the total welfare losses) from duties on a particular product or group of products, by assuming that all other goods were imported free of duty. The welfare costs could then be compared with the dynamic benefits of the development of the protected activity. Following Sybille Lehmann and O'Rourke (Reference Lehmann and O'Rourke2011), Figure 6 distinguished manufactures (i.e., the counterfactual is zero duties on primary products and exotics), primary products (zero duties on manufactures and exotics), and exotics (assuming zero duties on all other goods).
TRIP, BY MAIN CATEGORY OF PRODUCTS (1862–1929)

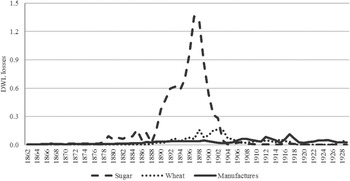
Duties on manufactures correspond to a uniform protection below 10 percent throughout the whole period; duties on exotics (mostly on coffee) were barely higher and similarly stable, with small peaks in 1885, 1905, and 1923. Thus, changes in aggregate TRIP reflect mostly trends in protection of primary products—that is, on wheat and above all of sugar. The sugar industry was tiny and sugar imports never exceeded 10 percent of total imports, but, as Figure 7 shows, it accounted for most of the losses from protection in the late nineteenth century.Footnote 18
DWL LOSSES: COUNTERFACTUAL ESTIMATES (1862–1929)

The losses from the duty on sugar in the whole period 1862 to 1929 account for about one-half the total losses from trade protection. Almost all these losses were cumulated in the 25 years from the first sharp increase in sugar duties in 1877 to the Brussels convention (1902), when bounties on export of sugar were ended.Footnote 19 Losses from wheat duties were relevant only in a short period of time around the turn of the twentieth century, while those from the protection on manufactures were below 0.1 percent of GDP in all years but 1917. In a famous book published in 1903, the free trader polemist, Edoardo Giretti (Reference Giretti1903) called wheat growers, iron industrialists, and sugar producers I trivellatori (parasites) of the Italian economy. He was wrong: sugar producers were in a class of their own.
HOW ROBUST IS THE FEENSTRA APPROXIMATION?
As said earlier, the Feenstra's approximation (TRIP) might underestimate the level of protection relative to the general equilibrium TRI. Unfortunately, the necessary data for a comprehensive comparison are not available in this case. However, we present some rather partial evidence on this underestimation in Appendix 1. In this section, we focus on the robustness of the Feenstra's approximation to the level of disaggregation of the product categories and to different methods of estimating elasticities.
As a starting point, Kee, Nicita, and Olarreaga (Reference Kee, Nicita and Olarreaga2008) show that the Feenstra approximation can be written as:
![\[
\begin{array}
{\text{TRI}}^{\text{P}}= [{\text{NT}}^2 +\sigma +\rho]^{0.5},
\end{array}
\](https://static.cambridge.org/binary/version/id/urn:cambridge.org:id:binary:20160921010151552-0225:S0022050715001552:S0022050715001552_eqn7.gif?pub-status=live)
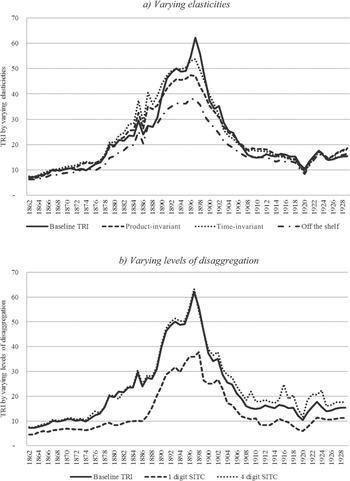
where NT is the import-weighted (with shares s) nominal tariff, σ2 the import-weighted variance of tariff rates and ρ=cov(εn/ε, τn 2), where ε is the (import-weighted) average elasticity of the value of imports to relative prices. Thus, TRIP is positively related to the variance of tariff rates (σ2) and to the covariance between tariffs and elasticities (ρ). As a first approximation, one would surmise that higher SITC codes correspond to a higher dispersion of rates, and thus cause the TRIP to be higher as well. However, this is by no means certain, as the variance must be weighted with shares on imports. Likewise, it is impossible to assess the effect of different elasticities on the parameter ρ. We thus adopt a pragmatic approach and we compute five alternative series: (1) aggregate series, at one-digit Standard International Trade Classification (SITC) —that is, ten products; (2) very detailed series, at four-digit SITC, featuring a maximum of 586 categories;Footnote 20 (3) time-invariant elasticities (same elasticity throughout the whole period for each two-digit category); (4) product-invariant elasticity (same coefficient for all two-digit category in each year); and (5) “Off-the-shelf” elasticities for 17 categories (Stern, Francis, and Schumacher Reference Stern, Francis and Schumacher1976)—the same set used by Irwin (Reference Irwin2010).
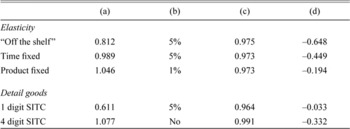
A visual inspection of trends (Figure 8) shows that most differences between the estimates are relatively small and Table 2 confirms this impression with some pairwise comparisons between the baseline and each alternative series.
THE SENSITIVITY OF ESTIMATES OF TRIP

ESTIMATES OF TRIP (1862–1929): ROBUSTNESS TESTS

Notes:
(a) average ratio of the alternative series to the baseline TRIP; (b) cointegration of alternative series with the baseline TRIP; (c) coefficient of correlation between each alternative measure and the baseline TRIP; (d) coefficient of correlation between the ratio of each alternative measure (column (a)) to the baseline TRIP.
Sources:
Our own elaborations on FTVplus dataset.
Column (a) reports the average ratio of the alternative series to the baseline over the whole period 1862–1929. As expected, the TRIP is positively related to the level of disaggregation, as measured by SITC, but the difference is substantially greater between one- and two-digit SITC (almost 40 percent) than between two- and four-digits (about 8 percentage points). In the baseline estimate, the parameter ρ is negative on average and in 38 years out of 68 years. In other words, Italy protected low-elasticity goods (such as vegetable oils (43), dyeing tanning and colouring materials (53), and petroleum (33)) more. The “Off the shelf” TRI is lower than the baseline because these elasticities are even more negatively correlated with tariffs than in our baseline set (the covariance is negative in 52 years and its absolute value is about double). The “product fixed” TRIP is bound to be higher than the baseline because in this case ρ is zero by definition. It is impossible to predict the differences between the baseline and the “time fixed” as TRIP is independently computed each year.
If levels differ, trends are fairly similar: all alternative estimates but one are co-integrated with the baseline TRI (column (b)) and the pairwise correlations (column (c)) are very high. In column (d), we report the coefficient of correlation between the ratio of each alternative measure to the baseline TRIP (i.e., column (a)) and the level of protection, as measured by our baseline TRIP. The coefficient is fairly low in most cases and always negative. This implies that the difference between estimates is proportionally greater when protection is low.
As a whole, the results are reassuring. The baseline estimate is fairly robust and because the biases are more likely in times of low protection, errors in measurement are less damaging to historical interpretation. On the other hand, the test suggests that one should be very prudent in endorsing estimates at a low level of disaggregation. This conclusion is buttressed by the results of similar tests by Douglas Irwin (Reference Irwin2010) and Eugene Beaulieu and Jevan Cherniwchan (Reference Beaulieu and Cherniwchan2014). According to the former, an increase in number of products from 15–17 (his baseline estimate) to some thousands increases TRIP by up to one-third.Footnote 21 The number of products (“varieties”) in baseline estimate by Beaulieu and Cherniwchan (Reference Beaulieu and Cherniwchan2014) increases from 255 in 1870 to 964 in 1910. Cutting the number to about 200 (corresponding to three-digit SITC) reduces somewhat the TRI and the one-digit estimate seems to be less than one-half the baseline estimate (Beaulieu and Cherniwchan 2014, Figure 11). Summing up, the Feenstra approximation is reasonably robust but it is likely to undervalue the level of protection relative the “true” TRI. However, it does capture the main historical facts—the peak in protection of the 1890s and the relatively small amount of welfare losses.
HOW BIASED IS A NT MEASURE?
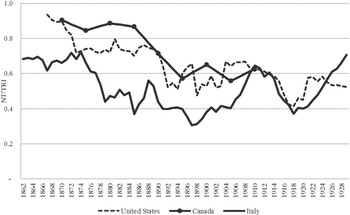
The Feenstra approximation TRIP is arguably a less biased, or a more precise, measure of protection than the more generally used NT. If the ratio NT/TRI were constant in time, the coefficient of NT in the growth regression (equation 1) would be unbiased. If the two measures were linked by a stable relation, the bias would be less of an issue. In theory, one could look for such a relation by regressing NT on TRIP for a panel of representative countries. Since we do not have enough data, in Figure 9 we compare the available series of TRIP and NT for Italy and the United States, adding a series for Canada, which we obtain as linear interpolation between the benchmark estimates by Beaulieu and Cherniwchan (Reference Beaulieu and Cherniwchan2014, Tab. 2). As expected, NT is always lower than TRIP—on average by 27 percent for Canada, by 37 percent for the United States, and by 48 percent for Italy. However, these figures are not directly comparable. They each refer to slightly different time periods and different levels of disaggregation and, above all, the estimates for the United States and Canada use “off-the-shelf” import demand elasticities from the 1970s rather than historical micro-constructed elasticities as in our Italian estimate. In fact, the ratio for Italy would jump to 0.80 if we compute TRIP series with the same level of detail (17 groups of goods) and the same set of elasticities, which Irwin (Reference Irwin2010) uses.Footnote 22
THE BIAS FROM NOMINAL PROTECTION: NT/TRIP (1862–1929)

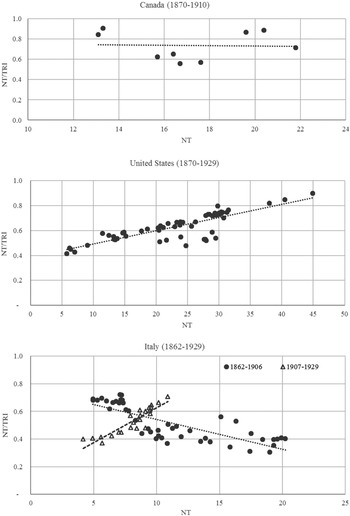
The key information from Figure 9 is not the difference in levels between NT and TRIP, but their change in time. The ratio declined fairly steadily in Canada, declined with fluctuations in the United States, while in Italy it decreased in the nineteenth century, rebounded in the early twentieth century and ended up in 1929 almost as high as in the 1870s.Footnote 23 Ceteris paribus, one would expect the bias to be inversely related to NT—that is, NT/TRIP to be positively related to NT. In fact, Kee, Nicita, and Olarreaga (Reference Kee, Nicita and Olarreaga2008) show that:

where, as before, σFootnote 2 and ρ are trade-weighted variance and covariance. This expectation is met in the United States and in Italy after 1907, but the ratio is negatively related to NT in Italy before 1907 and it is not related to NT in Canada (Figure 10).
THE BIAS IN MEASURING PROTECTION AND THE NT

These differences across countries and in time may be explained by changes in the trade-weighted variance and covariance. The variance would increase whenever changes in the tariff (i.e., in the list of products and/or in the duty on each of them) or in prices (for specific duties) causes the dispersion of duties to grow or changes in composition of imports increase the share of goods at the extreme of the distribution (i.e., with very high or very low protection). For instance, in the case of Italy, the change in composition account for about one-eighth of the increase in σFootnote 2 from 1886 to 1897 and for about two-thirds of the decline to 1913.Footnote 24 Likewise, the covariance would increase if duties grow more on elastic goods, but the effects on ρ depend on the composition of trade. In short, it is impossible to predict a priori the sign of the bias and thus suggest a procedure to correct it. Unfortunately, these biases differ across countries according to the structure of protection and thus their aggregate effect is unpredictable. In a nutshell, there is no easy fix for the problem of the bias in the NT.
PROTECTION AND ECONOMIC GROWTH IN THE NINETEENTH CENTURY: A NEW VIEW?
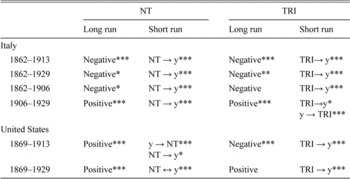
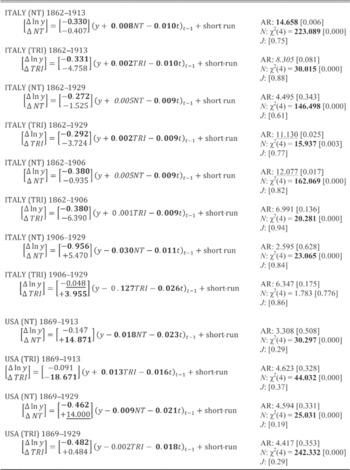
Our examination of differences in varying measures of trade protection has shown that NT measures and a trade restriction index can generate somewhat differing descriptions of the underlying events. We are also interested in the overarching issues of whether trade protection fosters or hinders economic growth. Because we have only TRI for two countries is not possible to answer this in a growth regression framework. In contrast, it is possible to replicate the co-integrated VAR approach by Lampe and Sharp (Reference Lampe and Sharp2013) for Italy and the United States, in order to check whether changing the measure of protection affects the results. Table 3 sums up the results in their compact notation, while we report the full outcome in the Appendix 2 (Appendix Table 6). For both countries, we run the model for the period up to 1913 and for the whole period up to the Great Depression. We test also separately the two periods 1862–1906 and 1906–1929 for Italy, as there is evidence of a different relation (Figure 10).Footnote 25
RESULTS OF THE COINTEGRATED VAR MODEL, ITALY AND THE UNITED STATES

Sources:
* = Significant at the 10 percent level.
** = Significant at the 5 percent level.
*** = Significant at the 1 percent level.
Sources:
Our own elaboration on FTVplus dataset for Italy and on Irwin (Reference Irwin2010) for United States.
Substituting TRIP for NT does change the results, and the impact is greater for the United States than for Italy. Using this better measure of protection, TRIP, confirms that the relation between trade policy and economic growth was complex. The relation for the United States is either negative or not significant, rather than consistently positive as suggested by the NT measure. Protection affected GDP negatively in Italy before 1906, subsequently the long-run relation is positive but with income causing protection rather than the other way round. Without overstressing the point, one could observe the broad coincidence in timing between this change and the change in taxation on sugar. In both countries, welfare losses were fairly small. Over the whole period from 1867 to 1929, American consumers lost the equivalent of two-fifths of a year's GDP. Irwin (Reference Irwin2010, p. 130) points out that “the cost of protection has been low for the United States because international trade has been a relatively small part of the overall economy.” The losses for Italy were lower (Figure 5), even if the country was decidedly more open than the United States.Footnote 26
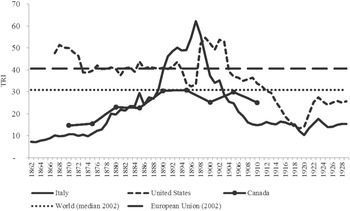
This conclusion does not hold for the period after 1929. The big rise in overall protection during the Great Depression entailed large welfare losses and probably very little if any dynamic gains. It is widely assumed that the liberalization of exchanges after the war helped the advanced economies to achieve unprecedented rates of growth during the golden age, while the inward-looking strategy of industrialization in less developed countries by and large failed. Unfortunately, it is impossible to buttress this claim with estimates of levels of protection. There are some estimates for the most recent period. The average TRI, according to the (general equilibrium) estimates by Anderson (Reference Anderson1995) was 19.5 percent for a sample of 26 countries in the late 1980s and early 1990s, while according to Kee, Nicita, and Olarreaga (Reference Kee, Nicita and Olarreaga2009) the TRIP, inclusive of their estimate of the tariff-equivalent of the Non-Tariff Barriers to trade (NTBs), was 33.2 percent for 76 countries in 2002.Footnote 27 The two samples overlap for 21 countries and a comparison shows a 40 percent decline of protection (partly accounted for the different measure of TRI).Footnote 28 By the early 2000s liberalization of trade of goods was well advanced, but the level of protection was comparable if not higher than before WWI and in the 1920s (Figure 11).
COMPARATIVE TRIP

CONCLUSION
The methodological message of this article is simple: the ratio of custom duties to the value of imports (NT), although simple to compute, is a flawed measure of protection and it should not be relied on. The TRI is better, although also not a perfect measure. The Anderson and Neary (Reference Anderson1995) version is too data intensive to be useful for most economic history research. The Feenstra approximation, or TRIP, needs only data on trade and import elasticities, which could be estimated, as we have done, or obtained from other papers. As we have shown the TRIP is fairly robust to the details of computation. Admittedly, it still undervalues protection relative to the TRI, but by definition the bias is smaller than for NT.
The historical message of the article is more complex. It focuses on Italy but also tries to draw some implications for the global history of trade policy before the Great Depression. Our results suggest that Italian protection was fairly low, except for very few years in the 1890s, and that this peak reflected mostly the very heavy duties on sugar. The duty on sugar accounted for a sizeable share of total welfare losses from protection, but its benefits for economic growth seem questionable, to say the least. The level of protection on manufactures, which, accordingly to Lehmann and O'Rourke (Reference O'Rourke2011) is positively related to economic growth, was very low. Furthermore, the rates of effective protection on manufacturing (Federico and Tena-Junguito Reference Tena-Junguito1999) were quite haphazard and it is extremely difficult to detect any clear strategy for industrialization. In a nutshell, Italy was not very good at implementing the “standard model” at least for protection (Allen Reference Allen2011).
We tentatively argue that this overall view may hold also outside Italy. The anecdotal evidence about the history of trade policy and, for what they are worth, the series of NT suggest that Italy could be representative of a more general pattern for Great Powers of Continental Europe. The series of TRIP for the United States and Canada confirm that nineteenth century protection was low in comparison with the levels of the early twenty-first century. It is thus highly likely that protection was substantially lower before the Great Depression than in any time after WWII, including the “golden age” of the 1950s and 1960s, which coincided with the period of import-substituting industrialization in many Less Developed Countries (LDCs). In a long-term perspective, this highlights the role of the Great Depression (and WWII) as the long-lasting shock of the twentieth century, while downplaying the impact of WWI on the international economy (Federico and Tena-Junguito 2Reference Federico and Tena-Junguito015a). Inferring the effect of trade policy on economic growth from levels of protection is clearly tricky. However, the cointegrated VAR tests, although somewhat crude, point towards a negative long-run effect. It also shows that results are sensitive to the measure of protection. In other words, the economic history of trade policy needs a systematic re-estimating of protection.
Appendix 1 The Feenstra Approximation (TRIP) and the General Equilibrium TRI
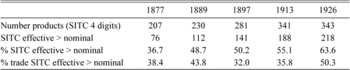
Lloyd and MacLaren (Reference Lloyd and MacLaren2010) put forward two conditions for detecting the underestimation of the Feenstra approximation relative to the general equilibrium TRI, but the lack of data prevents to test the first one, about demand elasticities. The second states that TRIP would undervalue the TRI if effective protection exceeds the nominal one, and Appendix Table 1 shows this was the case in a substantial number of instances.
The UNDERVALUATION OF TRIP: A COMPARISON WITH TRIS

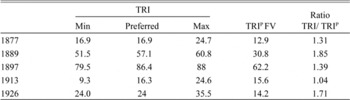
As an alternative and more comprehensive test, we compare our estimates of TRIP with the general-equilibrium ones by Federico and Tena-Junguito (Reference Federico1998, Tab. A3). They try a wide range of elasticities of substitution and transformation and Appendix Table 2 reports the maximum and minimum estimate range possible, jointly with their preferred (baseline) estimate.Footnote 29 As expected, all estimates of general-equilibrium TRI but one are higher than the TRIP, on average by 45 percent. The difference is quite small in 1877, but the TRIP undervalues the growth of protection to 1897 (especially in the first period) and misses the (small) increase in the 1920s. Consequently, the TRIP underestimates the welfare losses, which, according to the CGE estimate by Federico and O'Rourke (Reference O'Rourke2000), were equivalent to 2.4 percent of GDP in 1911 and possibly to 3.1 percent in 1897.
THE UNDERVALUATION OF TRIP: A COMPARISON WITH THE GENERAL EQUILIBRIUM TRI

Appendix 2 Statistical Appendix
LIST OF POLITIES

SOURCES OF DATA ON NOMINAL PROTECTION

PROTECTION IN ITALY, VARIOUS SERIES (1862–1929)


COINTEGRATED VAR, FULL RESULTS