Introduction
It has been long established that the visual system of mammals is integrated structurally, whereby different forms of visual information are processed by distinct specialized areas in the brain (Calabretta & Parisi, Reference Calabretta, Parisi, Callebaut and Rasskin-Gutman2005). Consistent with this view, it has been proposed that orientation and motion information are processed by separate neural pathways originating in the primary visual cortex, known as the ventral stream and dorsal stream; the ventral stream processing mainly form information and the dorsal stream mainly encoding motion information (Benson & Greenberg, Reference Benson and Greenberg1969; Ungerleider & Mishkin, Reference Ungerleider, Mishkin, Ingle, Goodale and Mansfield1982; Zihl et al., Reference Zihl, Von Cramon and Mai1983, Reference Zihl, Von Cramon, Mai and Schmid1991; Van Essen & Gallant, Reference Van Essen and Gallant1994; Braddick et al., Reference Braddick, O’Brien, Wattam-Bell, Atkinson and Turner2000).
Recent evidence, however, is inconsistent with the recognised view of two parallel, integrated processing streams for form and motion. Evidence instead provides support for the notion that there is widespread interaction between orientation and motion pathways and that these are not separate (Krekelberg et al., Reference Krekelberg, Dannenberg, Hoffmann, Bremmer and Ross2003; Kourtzi et al., Reference Kourtzi, Krekelberg and van Wezel2008; Or et al., Reference Or, Khuu and Hayes2010; Pavan et al., Reference Pavan, Casco, Mather, Bellacosa, Cuturi and Campana2011, Reference Pavan, Marotti and Mather2013, Mather et al., Reference Mather, Pavan, Bellacosa and Casco2012, Reference Mather, Pavan, Bellacosa Marotti, Campana and Casco2013). For instance, Lennie (Reference Lennie1998) found that while many MT cells in macaque monkey cortex respond strongly to motion information, they also respond to a smaller degree to orientation, implying cells aggregate visual information and interact early on. Other evidence comes from research using Glass patterns (GPs; Glass, Reference Glass1969), comprising an ensemble of randomly positioned dot-pairs (i.e., dipoles). The pooling of local orientation information, given from the way the dipoles are aligned within the GP, affords the perception of global form (Wilson & Wilkinson, Reference Wilson and Wilkinson1998). Using dynamic GPs (a series of static GPs shown in rapid succession, differing randomly in position), apparent motion can also be perceived along an axis parallel to dipole orientation (Ross et al., Reference Ross, Badcock and Hayes2000), which cannot be differentiated from real motion (Krekelberg et al., Reference Krekelberg, Vatakis and Kourtzi2005). By conveying different angles for motion direction and orientation, GPs can be constructed to produce a conflict between motion and orientation signals (i.e., a conflict angle; the dipoles are given a spatial displacement over time along an axis that is not parallel to dipole orientation). Krekelberg et al. (Reference Krekelberg, Dannenberg, Hoffmann, Bremmer and Ross2003) found that in both humans and macaque monkeys the perceived motion direction of GPs was significantly attracted toward dipole orientation at a small conflict angle (between 10 deg and 45 deg). This indicates that perceived motion is established from the weighted average of the real motion direction of the GP and global orientation of the texture.
Later studies reported that judgements of GP motion direction become less accurate when there is a small conflict angle with dipole orientation, accompanied by an attraction. In addition, findings also demonstrate that perceived global orientation is influenced by motion direction, but to a lesser degree (Or et al., Reference Or, Khuu and Hayes2010). These results suggest that motion and orientation information interact asymmetrically, whereby the influence of global orientation information on perceived global motion direction is stronger than the reverse. On the basis of such research it cannot be disputed that motion and orientation information are processed by completely independent systems. Instead they interact at early stages within the visual system (Wilson & Wilkinson, Reference Wilson and Wilkinson1998; Dakin & Bex, Reference Dakin and Bex2001; Or et al., Reference Or, Khuu and Hayes2010).
Over time, summation of responses to a moving visual object, when it is moving with adequate speed, produces “speed” lines that extend backwards across the retina from the object and display the character of the movement (Burr, Reference Burr1980; Burr & Ross, Reference Burr and Ross2002), due to temporal integration (Geisler, Reference Geisler1999). The aforementioned findings support the proposition made by Geisler (Reference Geisler1999): the dipoles within dynamic GPs simulate “motion streaks” offering cues as to the axis of the motion and influencing the observer’s perception of direction, resulting in deflection, and attraction effects (Ross et al., Reference Ross, Badcock and Hayes2000; Burr & Ross, Reference Burr and Ross2002; Ross, Reference Ross2004). In this way, the processing orientation and motion information supplement one another to make precise direction judgements, particularly for stimuli with higher temporal frequency (Geisler, Reference Geisler1999).
Although previous studies of perceived GP motion and orientation, as a function of conflict angle, indicate an asymmetrical interaction (Krekelberg et al., Reference Krekelberg, Dannenberg, Hoffmann, Bremmer and Ross2003; Or et al., Reference Or, Khuu and Hayes2010), the neural mechanisms of the two effects (i.e., how motion affects orientation judgments and vice versa) are still unclear. Using oriented and moving GPs, and varying the angle between dipoles’ motion direction and their orientation we assessed the underlying mechanisms of motion-form and how these mechanisms interact. The duration of the stimuli was also manipulated to assess whether the integration between motion and form depends on exposure time.
Experiment 1
Methods
Participants
Two of the authors (AP and MGG) and seven naïve participants took part in the experiment with no compensation. All participants had normal or corrected to normal visual acuity. Viewing was binocular. Methods conformed with the Declaration of Helsinki (1964). The experiment was approved by the ethical committee of the University of Lincoln (reference number: PSY1415124). All participants gave written informed consent prior to their inclusion in the experiment.
Apparatus
Stimuli were displayed on a 20-inch HP p1230 monitor with a refresh rate of 85 Hz. Stimuli were generated with Matlab PsychToolbox (Brainard, Reference Brainard1997; Pelli, Reference Pelli1997). The screen resolution was 1280 × 1024 pixels. Each pixel subtended 1.6 arcmin. The minimum and maximum luminances of the screen were 0.08 and 74.6 cd/m2 respectively, and the mean luminance was 37.5 cd/m2. A gamma-corrected lookup table was used so that luminance was a linear function of the digital representation of the image. Observers sat in a dark room at a distance of 57 cm from the screen. The participant’s head was stabilized by asking her/him to rest her/his chin on a chinrest.
Stimuli and procedure
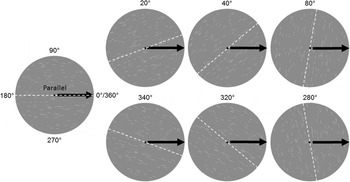
Stimuli were oriented translational GPs made up by 134 pairs of white dots (dipoles) with an inter-dot separation of 0.27 deg. The contrast of each dot was 0.99 (Weber contrast). The diameter of each dot was 0.07 deg. The dipoles were randomly placed in a circular window with a radius of 5.7 deg. The dipole density of the GPs was 1.31 dipoles/deg2 (Or et al., Reference Or, Khuu and Hayes2010). All dipoles had the same orientation (i.e., 100% coherence). In each trial dipoles moved either leftward or rightward. The motion sequence was computed as follows: on the first frame dipoles were randomly positioned within the circular window and were displaced by 0.063 deg on each subsequent frame, producing a speed of 5.33 deg/s (similar to Or et al., Reference Or, Khuu and Hayes2010). Dipoles had a limited lifetime; that is, after three frames (i.e., ∼0.035 s) each dipole vanished and was replaced by a new dipole, with the same orientation, at a different randomly selected position within the circular window. Dipoles appeared asynchronously on the display. Limited lifetime and asynchronous presentation were implemented to minimize the presence of local “motion streaks” (Geisler, Reference Geisler1999) that could interfere with orientation judgements. In addition, moving dipoles that traveled outside the circular window were also replaced by a new dipole at a different randomly location within the circular window, thus always maintaining the same dipole density. On a trial-by-trial basis the GP orientation was varied. For rightward motion GP orientations were: 0 deg (i.e., motion direction and GP orientation were parallel), 20 deg, 40 deg, 80 deg, 340 deg, 320 deg, 280 deg (Fig. 1; dashed line was not actually presented). For leftward motion GP orientation were: 180 deg (parallel), 160 deg, 140 deg, 100 deg, 200 deg, 220 deg, and 260 deg. Stimulus duration was also varied on a trial-by-trial basis and could be of 6, 12, 24, 48, 96, and 192 frames (corresponding to 0.070, 0.141, 0.282, 0.565, 1.129, and 2.259 s).
Representation of the stimuli used in Experiment 1. Only rightward motion is showed (thick black arrow) and the relative orientation of the Glass patterns. The white dashed line indicates the orientation of the Glass patterns, and was not shown during the experiment.

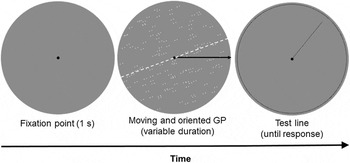
Following presentation of a fixation point for 1 s, the moving GP was presented. There were 16 orientations × 6 stimulus durations. Each condition was repeated 6 times. The horizontal orientations (i.e., 0/360 deg and 180 deg) were repeated twice, to have the same number or repetitions as the other orientations. Each observer performed a total of 576 trials split over 12 blocks. The observers performed either orientation judgments or motion direction judgments in a given block (576 trials each). The type of task (i.e., either orientation or motion judgements) was randomized across observers; that is, participants completed first the orientation blocks and then the motion blocks, or vice versa. Observers judged the perceived orientation or motion direction of the GP by setting the position of a line (Fig. 2) around a circumference. The initial position of the line was randomized on a trial basis and could be located at any angle between 0 deg and 359 deg.
Procedure used in Experiment 1. After initial fixation for 1 s, a rightward moving Glass pattern oriented 20 deg from horizontal is presented (variable duration; the white dashed line and the black arrow were not present during the experiment). Observers had to set the line shown in the rightmost panel according to the perceived Glass pattern’s orientation or motion direction.

Data from symmetrical orientation were pooled to get four conflict angles: 0 deg, 20 deg, 40 deg, and 80 deg. The 0 deg conflict angle was created by pooling data from the parallel conditions (i.e., 0 deg and 180 deg), the 20 deg conflict angle was created by pooling data from 20 deg, 340 deg, 200 deg, and 160 deg, the 40 deg conflict angle was created by pooling data from 40 deg, 320 deg, 220 deg, 140 deg, and the 80 deg conflict angle was created by pooling data from 80 deg, 260 deg, 280 deg, and 100 deg GP orientation.
Results
Orientation
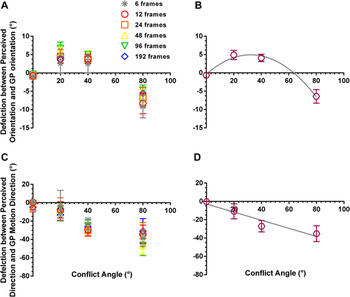
Fig. 3A and 3B reports the deflection (i.e., the difference in angular orientation) between the perceived orientation and the actual GP orientation as a function of the conflict angle. Positive values indicate repulsion from the axis of motion, and negative values indicate attraction. A repeated measures ANOVA including as factors the stimulus duration and the conflict angle reported only a significant effect of the conflict angle (F 1.52,12.17 = 16.15, P = 0.001, partial-η 2 = 0.67). Simple within-subjects contrasts reported that the deflection estimated for conflict angles of 20 deg, 40 deg, and 80 deg was significantly different from the deflection estimated for the 0 deg conflict angle (i.e., parallel condition) (20 deg vs. 0 deg: F 1,8 = 19.19, P = 0.002, partial-η 2 = 0.71; 40 deg vs. 0 deg: F 1,8 = 17.84, P = 0.003, partial-η 2 = 0.69; 80 deg vs. 0 deg: F 1,8 = 10.55, P = 0.012, partial-η 2 = 0.57). Repeated contrasts did not report a significant difference between deflections at 20 deg and 40 deg (F 1,8 = 0.155, P = 0.70, partial-η 2 = 0.019). In particular, for 20 deg and 40 deg conflict angles we found repulsion effects (values above zero); that is, the perceived orientation of the GP was repelled away from the axis of motion (conflict angle 20 deg: Mean = 4.9 deg, s.e.m. = 1.26 deg; conflict angle 40 deg: Mean = 4.08 deg, s.e.m. = 0.99 deg), whereas for 80 deg conflict angle we found an attraction effect (values below zero), i.e., the perceived orientation of the GP was attracted toward the horizontal motion direction (Mean = −6.41 deg, s.e.m. = 1.87 deg).
Results of Experiment 1. Panels A and B: orientation judgments. Deflection, i.e., difference (deg) between the perceived orientation and the actual GP orientation is shown as a function of the conflict angles used. (A) Deflection values are reported separately for each stimulus duration (in frames). (B) Mean deflection across the stimulus durations used. The gray curve indicates a quadratic polynomial fitted on the mean data [f(x) = ax 2 + bx + c; a = −0.005 (95% CI = −0.014, 0.004), b = 0.327 (95% CI = −0.43, 1.08), c = −0.367 (95% CI = −12.3, 11.56)]. Panels C and D: motion judgments. (C) Deflection values are reported separately for each stimulus duration. (D) Mean deflection across the stimulus durations used. The continuous gray line indicates a linear regression on mean data [f(x) = ax + b; a = −0.44 (95% CI = −0.839, −0.045), b = −2.87 (95% CI = −21.5, 15.3)]. Values above zero indicate repulsion whereas values below zero indicate attraction. Error bars ± s.e.m.

An additional analysis of variance for repeated measures with trend analysis on data pooled across the stimulus durations, revealed significant linear (F 1,8 = 8.28, P = 0.021, partial-η 2 = 0.51) and quadratic (F 1,8 = 22.85, P = 0.001, partial-η 2 = 0.74) trends. Higher order trends were not significant. In order to estimate the peak deflection of the perceived orientation, we fitted a quadratic polynomial on mean data (R 2 = 0.98). The peak (vertex) was estimated at a conflict angle of 32.4 deg with a deflection between perceived orientation and GP orientation of 4.93 deg.
Motion
Fig. 3C and 3D reports the deflection between the perceived motion direction and the actual motion direction of the GP as a function of the conflict angle. A repeated measures ANOVA including as factors the stimulus duration and the conflict angle reported only a significant effect of the conflict angle (F 3,24 = 6.67, P = 0.002, partial-η 2 = 0.46). Simple within-subjects contrasts reported that deflections estimated for conflict angles of 40 deg and 80 deg were significantly different from the deflection estimated for the 0 deg conflict angle (40 deg vs. 0 deg: F 1,8 = 13.13, P = 0.007, partial-η 2 = 0.62; 80 deg vs. 0 deg: F 1,8 = 23.39, P = 0.001, partial-η 2 = 0.75). Repeated contrasts pointed out a significant difference between conflict angles of 20 deg and 40 deg (F 1,8 = 5.35, P = 0.05, partial-η 2 = 0.4). An analysis of variance for repeated measures with trend analysis revealed a significant linear trend only for the conflict angle (F 1,8 = 22.97, P = 0.001, partial-η 2 = 0.74). A linear regression on mean data (Fig. 3D) confirmed a linear relationship between estimated deflections on motion judgments and conflict angle (R 2 = 0.92).
Discussion
The results of Experiment 1 show that apparent GP motion is attracted toward dipole orientation, and the attraction increases monotonically with conflict angle; apparent GP orientation is repulsed from GP motion, with repulsion peaking at intermediate conflict angles. The effect of orientation on motion was much more marked than the effect of motion on orientation (note the y-axis scales in Fig. 3), consistent with the data of Or et al. (Reference Or, Khuu and Hayes2010).
One could argue that such a strong asymmetry between orientation and motion, with orientation dominating over motion direction, could be due to the weaker global motion signals originating when using a very short lifetime (i.e., 0.035 s). In a control experiment, we tested for this possibility by measuring the strength of the motion signals from globally moving random dot kinematograms (RDKs), in which dots had the same spatiotemporal characteristics of the moving dipoles used in Experiment 1.
Control experiment
Methods
Participants
Two of the authors (AP and FG) and four naïve participants took part voluntarily to the experiment with no compensation. All participants had normal or corrected to normal visual acuity. Viewing was binocular. All participants gave written informed consent prior to their inclusion in the experiment.
Stimuli and procedure
Stimuli and procedure were the same as in Experiment 1, but instead of moving and oriented GPs, observers had to judge the motion direction of RDKs composed by globally moving dots with the same spatiotemporal characteristics of the moving dipoles reported in Experiment 1. It should be noted that RDKs had the same density of GPs, but dipoles were no longer present. Observers had to set the line (Fig. 2, rightmost panel) accordingly to the perceived motion direction. There were only two motion directions (i.e., leftward and rightward motion), but observers were not informed about the possible motion directions of the RDKs. We considered a correct response when the line was set in the half circle consistent with the RDK’s motion direction.
Results
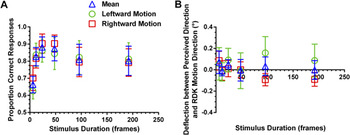
Fig. 4 shows the results of the control experiment. A repeated measures ANOVA on proportion of correct responses including as factors the motion direction and the stimulus duration, reported only a significant effect of the duration (F 1.6,8.01 = 6.59, P = 0.024, partial-η 2 = 0.57). Post hoc comparisons using a false discovery rate (FDR) at 0.05 (Benjamini & Hochberg, 1995; Benjamini & Yekutieli, 2001, 2005) reported that the 6-frame duration was significantly different from the 12, 24, and 48-frame conditions (adjusted-P = 0.005, 0.005, and 0.022, respectively). In order to assess whether mean proportion of correct responses were significantly above the chance level (0.5), we performed a series of one-sample t-tests using a FDR at 0.05. The t-tests reported that mean proportion of correct responses were significantly above chance for all the durations used (adjusted-P values: 0.049, 0.015, 0.015, 0.015, 0.049, and 0.049, respectively for 6, 12, 24, 48, 96, and 192-frame conditions).
Results of the control experiment. (A) Proportion of correct judgements for leftward and rightward motion. (B) Mean deflection angles (deg) between the perceived motion direction and 180 deg for leftward motion, and 0 deg/360 deg for rightward motion. Deflection values are reported only for correct responses. Error bars ± s.e.m.

A repeated measures ANOVA conducted on the deflection angles (Fig. 4B, i.e., angular difference between the perceived motion direction and the actual RDKs’ motion direction) for correct responses, did not report any significant effect or interaction (motion direction: F 1,5 = 0.34, P = 0.59, partial-η 2 = 0.063; duration: F 2.18,10.89 = 0.34, P = 0.74, partial-η 2 = 0.064; interaction motion direction x duration: F 2.20,11 = 1.60, P = 0.25, partial-η 2 = 0.24). In addition, one-sample t-tests using a FDR at 0.05 reported that no deflections values were significantly different from zero (adjusted-P > 0.05).
Discussion
The results of the control experiment suggest that global motion signals were reliable across all the durations employed. Observers could discriminate above chance the motion direction of the globally moving RDKs, though for the shortest duration the mean proportion of correct responses was 0.66 (s.e.m.: 0.05), but still significantly different from chance. Therefore, the orientation dominance reported in Experiment 1 was unlikely to be due to weak and negligible global motion signals.
However, in Experiment 2 we increased the dipole lifetime (from 0.035 to 0.494 s) in order to induce stronger “motion streaks” from moving dipoles (Geisler, Reference Geisler1999; Apthorp & Alais, Reference Apthorp and Alais2009). The rationale was to assess the interaction between orientation and motion with dipoles inducing motion streaks along their axis of motion, thus further aiding the extraction of motion. If the induction of motion streaks was successful, one would expect a greater influence of motion on orientation judgements, and only a weak or no effect of orientation on motion judgments.
Experiment 2
Methods
Four of the authors (AP, LMB, MGG, and FG) and seven naïve observers participated to Experiment 2. Apparatus, stimuli, and procedure were the same as Experiment 1, except that dipole lifetime was 42 frames (i.e., 0.494 s). Moreover, we used five of the stimulus durations used in Experiment 1 (i.e., 12, 24, 48, 96, and 192 frames, corresponding to 0.141, 0.282, 0.565, 1.129, and 2.259 s). All the other spatiotemporal characteristics of the stimulus were the same to that of Experiment 1. Based on Geisler (Reference Geisler1999) if the speed of a dot exceeds about 1 dot width per 0.1 s, it produces a greater response in the population of neurons whose receptive fields are oriented parallel to the direction of motion. In our case, the speed of the dots composing a dipole exceeded the width of a dot (0.07 deg) in 0.1 s (∼0.53 deg in 0.1 s), therefore the speed and the dipoles’ lifetime employed were likely to generate motion smear.
Results
Orientation
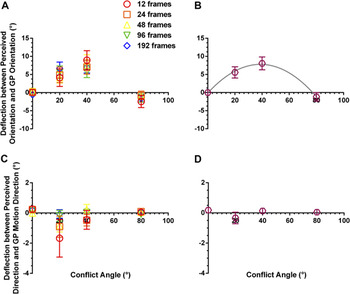
Fig. 5A and 5B reports the deflection angles between the perceived orientation and the actual GP orientation as a function of the conflict angles used. A repeated measures ANOVA including as factors the stimulus duration and the conflict angle reported only a significant effect of the conflict angle (F 3,30 = 10.62, P = 0.0001, partial-η 2 = 0.52). Simple within-subjects contrasts reported that the deflection estimated for conflict angles of 20 deg and 40 deg was significantly different from the deflection estimated for the 0 deg conflict angle (20 deg vs. 0 deg: F 1,10 = 10.13, P = 0.010, partial-η 2 = 0.50; 40 deg vs. 0 deg: F 1,10 = 13.48, P = 0.004, partial-η 2 = 0.57). However, deflections estimated for 80 deg and 0 deg conflict angles were not significantly different (F 1,10 = 0.95, P = 0.35, partial-η 2 = 0.087). Repeated contrasts did not report a significant difference between deflections estimated at 20 deg and 40 deg conflict angles (F 1,8 = 0.155, P = 0.70, partial-η 2 = 0.019). In particular, we found repulsion effects for 20 deg and 40 deg conflict angles (values above zero); that is, the perceived orientation of the GP was repelled away from its actual orientation (conflict angle 20 deg: Mean = 5.56 deg, s.e.m.: 1.55 deg; conflict angle 40 deg: Mean = 8.05 deg, s.e.m.: 1.77 deg), whereas for 80 deg conflict angle we did not find any significant repulsive or attractive effects. An additional analysis of variance for repeated measures with trend analysis on data pooled across the stimulus duration, revealed a significant quadratic trend (F 1,10 = 23.57, P = 0.001, partial-η 2 = 0.70). In order to estimate the peak deflection of the perceived orientation, we fitted a quadratic polynomial (R 2 = 0.99). The peak (vertex) was estimated at a conflict angle of 38.8 deg with a deflection between perceived orientation and GP orientation of 7.8 deg.
Results of Experiment 2. Panels A and B: orientation judgments. (A) Deflection values are reported separately for each stimulus duration (in frames). (B) Mean deflection across the stimulus durations used. The gray curve indicates a quadratic polynomial fitted on the mean data [a = −0.0053 (95% CI = −0.009, 0.001), b = 0.408 (95% CI = 0.043, 0.774), c = −0.139 (95% CI = −5.904, 5.625)]. Values above zero indicate repulsion whereas values below zero indicate attraction. Panels C and D: motion judgments. (C) Deflection values are reported separately for each stimulus duration. (D) Mean deflection across the stimulus durations used. Values above zero indicate repulsion whereas values below zero indicate attraction. Error bars ± s.e.m.

Motion
Fig. 5C and 5D reports the deflection between the perceived motion direction and the actual motion direction of the GP as a function of the conflict angle. A repeated measures ANOVA including as factors the stimulus duration and the conflict angle reported only a significant interaction between duration and conflict angle (F 12,120 = 1.88, P = 0.043, partial-η 2 = 0.16). Post hoc comparisons using a FDR at 0.05 reported only a significant difference between durations of 24 and 48 frames at conflict angle of 40 deg (adjusted-P = 0.048).
Discussion
The results of Experiment 2 show that apparent repulsion of orientation was greater in conditions which produced stronger orientation signals from streaks. In addition, the stronger streaks from the GP motion allowed the orientation signals they generated to dominate over the signals provided by conflicting dipole orientation.
General discussion
In two experiments, we investigated the integration between motion and form and its temporal dynamics. Considered together, our results are consistent with the presence of two separate mechanisms that contribute to our perception of Glass patterns which contain conflicting orientation and motion information.
The effect of dipole orientation on apparent GP motion direction is likely to be mediated by Geisler’s (Reference Geisler1999) “spatial motion-direction sensor” (SMD sensor), in which signals from motion sensors are combined with excitatory input from orientation-tuned sensors, which are tuned to orientations that are parallel to the axis of GP motion. This model predicts that the perceived GP motion direction should be attracted toward dipole orientation, and that the bias in apparent direction should increase with the conflict angle due to the increasing bias introduced at larger conflict angles (Krekelberg et al., Reference Krekelberg, Dannenberg, Hoffmann, Bremmer and Ross2003). The results of Experiment 1 are consistent with this model showing that the bias in apparent GP direction monotonically increases as the conflict angle increases. Besides, the same model predicts that the attraction should be weaker (or absent) in conditions which are optimal for producing streaks generated by the motion itself (the parallel streak signals become dominant over the non-parallel signals from the dipole orientation). The results of Experiment 2 for motion judgements are also consistent with this prediction. Findings suggest that SMD sensors may therefore be present at both low- and intermediate levels of visual processing. Albright (Reference Albright1984) investigated the orientation selectivity of 89 MT cells of macaque monkey and found that 29% of the cells exhibited an orientation preference that is roughly parallel to the preferred motion direction. More recently, a human brain imaging study by Apthorp et al. (Reference Apthorp, Schwarzkopf, Kaul, Bahrami, Alais and Rees2013) showed that motion streaks are likely to be extracted at early stages of visual analysis, implying that motion and form, while seemingly separate, are processed and combined as early as the primary visual cortex. In addition, there is brain imaging and psychophysical evidence that early visual areas can encode and pool the sparse local orientation cues in translational GPs (Ohla et al., Reference Ohla, Busch, Dahlem and Herrmann2005; Ostwald et al., Reference Ostwald, Lam, Li and Kourtzi2008; Mannion et al., Reference Mannion, McDonald and Clifford2009, Reference Mannion, McDonald and Clifford2010; Pavan et al., Reference Pavan, Hocketstaller, Contillo and Greenlee2016).
On the other hand, the effect of GP motion on apparent dipole orientation is likely to be mediated by interactions between orientation-tuned cells responding to the orientations of the dipole and the streak generated by dipole motion (Geisler, Reference Geisler1999; Apthorp & Alais, Reference Apthorp and Alais2009). This mechanism predicts that apparent dipole orientation should be repulsed away from the axis of GP motion due to mutual inhibition between orientation-tuned sensors, but the repulsion should peak at intermediate conflict angles, as expected on the basis of data from studies of orientation interactions and adaptation (Apthorp et al., Reference Apthorp, Cass and Alais2011). The results of Experiment 1 for orientation judgments showed a repulsion effect peaking at a conflict angle of 32.4 deg, with a bias of 4.93 deg (see Fig. 3A and 3B). Furthermore, this model predicts that the repulsion should be even stronger in conditions which are optimal for producing streaks (orientation signals) generated by the motion itself. The results of Experiment 2 are also consistent with this model and showed a larger bias of approximately 8 deg at a conflict angle of 39 deg (see Fig. 5A and 5B). Or et al. (Reference Or, Khuu and Hayes2010) found a similar repulsion effect with conflict angles higher than 30 deg when observers were required to judge the perceived orientation of moving GPs. The repulsion effects reported are similar to those present in motion and orientation domain (Marshak & Sekuler, Reference Marshak and Sekuler1979; Mather & Moulden, Reference Mather and Moulden1980; Burke & Wenderoth, Reference Burke and Wenderoth1993; Qian & Geesaman, Reference Qian and Geesaman1995; Hiris & Blake, Reference Hiris and Blake1996; Kim & Wilson, Reference Kim and Wilson1996; Rauber & Treue, Reference Rauber and Treue1998; Wishart et al., Reference Wishart, Braddick and Curran1998; Benton & Curran, Reference Benton and Curran2003; Chen et al., Reference Chen, Meng, Matthews and Qian2005). When two random fields of dots drift in two different directions, or two intersecting lines are presented, the perceived directions and orientations repel each other for conflict angles between 20 and 40 deg, but attract each other at larger conflict angles (Marshak & Sekuler, Reference Marshak and Sekuler1979; Rauber & Treue, Reference Rauber and Treue1998). Accordingly, in the first experiment, we found a repulsion effect of ∼5 deg at a conflict angle of approximately 32 deg, however, for the highest conflict angle used (80 deg) we found an attraction effect of 6.41 deg (Fig. 3A and 3B). Such form and form-by-motion interaction is likely to occur at a low level of visual analysis, where neurons are more selective for the orientation, and with repulsion between orientations occurring only for small acute angles (Marshak & Sekuler, Reference Marshak and Sekuler1979).
Importantly, in all the experiments we did not find any effect of the stimulus duration; this could depend on feedforward and feedback connections between low- and high-level visual areas encoding and combining orientation and motion signals. For instance, a number of physiological studies on monkeys and brain stimulation studies in humans, suggest the presence of feedback connections from high level visual areas (e.g., MT) to low level areas (e.g., V1/V2). These feedback signals may influence the transfer of ascending input when or before the input arrives to the visual cortex, shaping the perception of moving contours and textures (Sillito et al., Reference Sillito, Cudeiro and Jones2006; Laycock et al., Reference Laycock, Crewther, Fitzgerald and Crewther2007). Moreover, feedback connections have an important role in the formation of the inhibitory center–surround interactions (for moving surrounds) present at low level of visual analysis and mediate the integration of visual information (Lamme et al., Reference Lamme, Supèr and Spekreijse1998; Bullier et al., Reference Bullier, Hupe, James and Girard2001).
In summary, our findings suggest that motion and form information are likely to be encoded in parallel and then combined. Moreover, they are subserved by two discrete mechanisms (SMD sensor and orientation-tuned cells) revealed by the different effects of conflict angle and dipole lifetime on perceived orientation and motion direction.
Acknowledgments
AP, MGG and GM designed the experiments. AP implemented the experiments. MGG, LMB and FG collected the data. AP analyzed data. AP and GM interpreted the results. AP, LMB and GM wrote the main manuscript. All authors reviewed the manuscript. The study was supported by the University of Lincoln.