1. INTRODUCTION
Panel unit root tests are proposed to improve the power of standard univariate unit root tests. However, an important problem with the application of panel data methods to regional data is that the data usually exhibit substantial cross-sectional dependence. In recent years, different approaches have been suggested to cope with such situations. Chang (2002, 2004) and Harvey and Bates (2003) assume that the errors are cross-correlated with an arbitrary covariance matrix and present the limiting distribution as the number of time periods T tends to infinity and the number of cross-section units N is fixed. Breitung and Das (2005) assume weak error dependence that can be characterized by the fact that all eigenvalues of the error covariance matrix are bounded as the number of cross-section units tend to infinity. Using a sequential limit theory where T → ∞ is followed by N → ∞, they show that the ordinary least squares (OLS) t-statistic with “panel corrected standard errors” (PCSE) (Jönsson, 2005) and the generalized least squares (GLS) t-statistic possess a standard normal limit distribution.
Choi (2002), Phillips and Sul (2003), Bai and Ng (2004), Moon and Perron (2004), and Pesaran (2005) consider a strong form of dependence that is due to common factors. In this case the largest eigenvalue of the covariance matrix tends to infinity as the cross-section dimension (N) increases.1
For a recent review of the literature see Breitung and Pesaran (2007).
Recently, Banerjee, Marcellino, and Osbat (2005) have studied the performance of so-called first generation panel data unit root tests that ignore the cross-section dependence among the panel units. Their findings suggest that in this situation standard panel unit root tests suffer from severe size distortions. In this paper, we confirm their findings by employing a joint limit theory to analyze the asymptotic properties of first generation panel unit root tests. Moreover, we also consider second generation panel unit root tests suggested by Harvey and Bates (2003), Chang (2004), Moon and Perron (2004), and Breitung and Das (2005). In contrast to the approach suggested by Bai and Ng (2004), these test procedures are based on the “reduced form representation” of the factor model. It is well known (e.g., Harvey, 1989) that unobserved component models (the structural form) possess an ARIMA(p,d,q) representation (the reduced form). The Panel Analysis of Nonstationarity in Idiosyncratic and Common Components (PANIC) approach suggested by Bai and Ng (2004) is based on two steps. First, the structural factor model is estimated by principal components. In a second step, the estimated factors and idiosyncratic components are tested by using cointegration and panel unit root tests. If the tests indicate that the factors and idiosyncratic components are stationary, it is concluded that at least some time series in the panel are stationary. If one or both tests accept the null hypothesis, the joint hypothesis that all time series are I(1) cannot be rejected. Using Monte Carlo simulations, Gengenbach, Palm, and Urbain (2005) investigate the small-sample properties of the test procedure proposed by Bai and Ng (2004) and the second generation panel unit root tests of Moon and Perron (2004) and Pesaran (2005). They observe that the latter tests tend to (wrongly) indicate stationary series if the common factor is I(1) and the idiosyncratic component is I(0). In this paper we explain this finding by resorting to asymptotic theory.
In our theoretical analysis we study four panel unit root tests in situations where the cross-section dependence is due to common factors. The OLS t-statistic is a first generation panel unit root test that simply ignores possible cross-section dependence. The robust OLS t-statistic suggested by Breitung and Das (2005) and Jönsson (2005) was found to perform well in the case of weak cross-section dependence. In this paper we show that in the presence of common factors the test has a nonstandard limiting distribution. We also study test statistics based on suitable transformations of the variables. Two different approaches are considered. First, the inverse of the estimated residual covariance matrix is used to compute the GLS t-statistic. The second approach employs a transformation of the data that eliminates the common factors. Such test procedures are suggested by Phillips and Sul (2003) and Moon and Perron (2004).2
There exist several other panel unit root statistics that we do not consider in our analysis. For example, we leave out the test suggested by Im, Pesaran, and Shin (2003), which was suggested only for the case of independent panel units. Furthermore, the test of Harris and Tzavalis (1999) is not considered as it assumes that T is fixed. In addition, there is no variant of this test that is applicable for cross-section-dependent units.
These test statistics are used to test the null hypothesis that all time series in the panel are I(1). This null hypothesis may be the result of three different situations. In case A we assume that both the common and idiosyncratic components are nonstationary. In case B it is assumed that the common factors are I(1) and the idiosyncratic components are I(0), i.e., the time series are cointegrated across the panel units, whereas in case C the common factors are I(0) and the idiosyncratic components are I(1). In this paper we study the asymptotic properties of alternative panel unit root tests in these three situations. We show that no test procedure is able to cope with case B, where the series are cross-cointegrated. In the other cases at least some of the tests are valid.
The rest of the paper is organized as follows. In Section 2, the details of the panel data setup are presented, and in Section 3 the test statistics are defined. The asymptotic properties of the test statistics are analyzed in Sections 4–6. The results of some Monte Carlo experiments are presented in Section 7. Section 8 concludes.
Finally, some notational conventions used in this paper. We denote by W1(a),…,WN(a) a collection of N independent standard Brownian motions defined on the interval [0,1]. Following Phillips and Moon (1999) we indicate the joint limit by (N,T → ∞). Weak convergence is denoted by ⇒, and

means convergence in probability.
2. THE TESTING PROBLEM
Consider a collection of time series {yi0,…, yiT}i=1,…, N that is generated by the composite process


where ft is an r × 1 vector of unobservable common factors, γi is an r × 1 vector of nonrandom factor loadings, Γ = [γ1,…, γN]′ is the N × r matrix of factor loadings, and uit is an idiosyncratic error component. The eigenvalues of the r × r matrix A are on or inside the unit circle. Specifically, we will focus on the special case A = ρIr with |ρ| ≤ 1.3
As pointed out by a referee, the assumption of identical short-run dynamics of the factors is not without loss of generality. In particular, if the vector of innovations of the factors has a singular covariance matrix (which is a reasonable assumption in dynamic factor models), then the covariance matrix of the factors has a reduced rank, which is excluded by Assumption 1.
To simplify the exposition we focus on the case without deterministic terms and short-run dynamics. The inclusion of constants, time trends, and short-run dynamics is straightforward (cf. Breitung and Das, 2005; Breitung and Pesaran, 2007) and will be briefly discussed in Section 3.
For the errors vt and εit we make the following assumption.
Assumption 1. The vector εt = [ε1t,…, εNt]′ is independent and identically distributed (i.i.d.) with E(εt) = 0, E(εtεt′) = Σ = diag(σ12,…, σN2), and Ψ = limN→∞ N−1Γ′Γ a positive definite matrix. The r × 1 error vector vt is i.i.d. with E(vt) = 0, E(vt vt′) = Ir, and E(εt vt′) = 0. Furthermore, E(εit4) < ∞ for all i and t, and E(vjt2vkt2) < ∞ for all j,k,t.
Remark 1. Phillips and Sul (2003), Moon and Perron (2004), and Pesaran (2005) consider the special case with A = θIr such that the data generating process (1)–(3) reduces to

In this special case the common factors and the idiosyncratic components are generated by similar autoregressive processes. In our analysis we follow Bai and Ng (2004), who assume that the common factors and the idiosyncratic components may be generated by different processes.
In contrast to the PANIC approach suggested by Bai and Ng (2004), we consider unit root tests based on the “reduced form” autoregression

In general, Δyit = γi′Δft + Δuit is a linear combination of r + 1 ARMA(1,1) processes, and therefore Δyit has an autoregressive moving average (ARMA) representation given by αi(L)Δyit = βi(L)ξit, where αi(L) and βi(L) are lag polynomials of order r + 1 and ξit = Δyit − E(Δyit|Δyi,t−1,Δyi,t−2,…). Under the null hypothesis yit ∼ I(1) all roots of the polynomials αi(L) and βi(L) are outside the unit circle for all i = 1,…, N.
An important advantage of testing the reduced form (4) is that no factor representation needs to be estimated. Furthermore, the multiple testing problem resulting from separate tests of the factors and idiosyncratic components is avoided.
3. TEST STATISTICS
Following Levin, Lin, and Chu (2002) the test of the unit root hypothesis φ = 0 against the homogeneous alternative φ < 0 is based on the pooled OLS regression

where Δyt = [Δy1t,…, ΔyNt]′, yt−1 = [y1,t−1,…, yN,t−1]′, and et = [e1t,…, eNt]′. The pooled OLS t-statistic is

where

and

denotes the residual vector of regression (5).
Following Breitung and Das (2005) and Jönsson (2005) we will also consider the robust t-statistic that employs PCSE. The test statistic results as

where

As the GLS estimator of φ in (5) is more efficient than the OLS estimator, a more powerful test can be constructed based on the GLS estimator of φ. The GLS t-statistic is given by

(cf. Harvey and Bates, 2003; Breitung and Das, 2005). It is important to note that this test statistic can only be computed if T > N as otherwise the estimated covariance matrix

is singular. This is an important drawback compared to the OLS-based test statistics.
An attractive feature of the GLS t-statistic is that it does not require an assumption about the structure of the covariance matrix (e.g., the number of common factors). On the other hand, this generality gives rise to poor small-sample properties (see Section 7). To improve the small-sample properties of the test it is therefore desirable to impose some structure on the covariance matrix. Assume that the innovations admit a (strict) factor structure such that Ω = ΓΓ′ + Σ. Using the well-known result on the inverse of a sum of two matrices, we obtain

To estimate Ω−1 consistent estimators of Γ and Σ are required. Following Bai and Ng (2004) and Moon and Perron (2004) a principal component approach can be adopted. Let

denote the matrix of r eigenvectors (νj, j = 1,…, r) of

associated with the r largest eigenvalues. The matrix Γ is estimated as

, where

is a diagonal matrix with the largest r eigenvalues on the leading diagonal and

is a diagonal matrix with the diagonal elements of the matrix

on the leading diagonal.
Another approach to deal with cross-section dependence due to common factors is the elimination of the common factors by employing a transformation matrix Q with the property QΓ = 0. From the transformed regression

with ζt = Qyt and ηt = Qεt we obtain the t-statistic for the hypothesis φ* = 0 as

Phillips and Sul (2003) suggest using an estimated version of the matrix

where Γ⊥ is the orthogonal complement of Γ, which can be estimated by using a least-squares approach. Moon and Perron (2004) employ the estimated analogue of the matrix

where Vr = [ν1,…, νr] is the matrix of r eigenvectors (νj, j = 1,…, r) associated with the largest r eigenvalues of Ω. If the transformation matrix QMP is used to construct ζt, the resulting statistic tQMP depends on the variances σ12,…, σN2. As shown by Moon and Perron (2004) the statistic tQMP has to be multiplied by the factor

to obtain an asymptotically similar test statistic. If σ12 = ··· = σN2 = σ2 then this factor simplifies to 1/σ, and the ordinary form of the t-statistic results.
So far we have assumed that E(yit) = 0 for all t. In empirical practice, however, the inclusion of individual specific constants and time trends is important. Levin et al. (2002) have suggested eliminating individual specific constants by running a pooled OLS regression of the transformed series Δyit* = Δyit − Δyi on yi,t−1* = yi,t−1 − yi,−1, where

and

. To correct for the negative mean of the t-statistic, the numerator and denominator of the test statistic are adjusted by applying correction terms. However, this approach is valid only if the test of Levin et al. (2002) is applied to the GLS transformed series

in case A (see Section 4). In all other cases, the correction terms that have to be applied to the t-statistics depend on nuisance parameters, i.e., the elements of the covariance matrix Ω.
To sidestep this difficulty, Breitung and Das (2005) suggest subtracting the first observation to remove the individual specific constants.4
Other transformations are available for the model with individual specific time trends (cf. Breitung, 2000).
4. CASE A: BOTH COMPONENTS ARE I(1)
First we analyze the asymptotic properties of the alternative tests by letting A = Ir and θ = 1; i.e., the common and idiosyncratic components are nonstationary. This case is similar to the situation considered in Phillips and Sul (2003), Moon and Perron (2004), and Pesaran (2005). From (1)–(3) and Assumption 1 it follows that under the null hypothesis

the reduced form representation (4) implies φ = 0 and eit = γi′vt + εit is white noise. Because E(eit ejt) = γi′γj ≠ 0, in general, the pooled OLS statistic tols is invalid. Using a sequential limit theory, Breitung and Das (2005) show that if all eigenvalues of the covariance matrix Ω are bounded, this test statistic is distributed as

, where vΩ = limN→∞ tr(Ω2/N)/[tr(Ω/N)]2. However, if Ω has a factor structure, then r eigenvalues are O(N), and therefore the limiting distribution is no longer standard normal.
In the following theorem the limiting null distributions of the test statistics are given.
THEOREM 1. Assume that yit is generated as in (1)–(3) with A = Ir and θ = 1. Let λi* = limN→∞ N−1λi denote the limit of the ith (ordered) eigenvalue of the covariance matrix Ω = E(et et′).
(i) As (N,T → ∞) and N/T → ∞ we have

where σ2 = limN→∞ tr(Σ/N) and ω2 = limN→∞ tr(Ω/N),

and tQ has a standard normal limiting distribution.
(ii) If (N,T → ∞) and N2/T → 0 the test statistic tgls has a standard normal limiting distribution.
Remark 2. The limiting distribution of N−1/2tols implies that for the single-factor model with r = 1 the actual size of the OLS statistic tends to the probability

where cα is the critical value of a standard normal distribution with significance level α (cf. Evans and Savin, 1981). Thus, the OLS t-statistic is severely biased.
Remark 3. For the single-factor model with r = 1 the limiting distribution of the robust OLS statistic is identical to the limiting distribution of the Dickey–Fuller test statistic. Indeed, in this case, the test is asymptotically equivalent to a Dickey–Fuller test applied to the first principal component

, where

is the eigenvector associated with the largest eigenvalue of

. Thus, the limiting behavior of this test statistic is dominated by the common factor, and the idiosyncratic components do not affect the limiting distribution.
Remark 4. For the (feasible) GLS statistic tgls given in (9) the relative rates of N and T are important. This is due to the fact that replacing Ω by

implies an additional term Op(NT−1/2) and therefore the assumption N2/T → 0 is required. This explains the poor small-sample properties of the statistic tgls if T is only slightly larger than N (cf. Breitung and Das, 2005).
5. CASE B: ft ∼ I(1) AND uit ∼ I (0)
In this case we assume that the N time series share r common trends, whereas the idiosyncratic components are stationary. Accordingly, there exists an N × (N − r) matrix B such that B′yt is stationary. Following Banerjee et al. (2005) this situation is called cross-unit cointegration. Under the null hypothesis

the process Δyit = γi′vi + (1 − θL)−1(1 − L)εit has an ARMA(1,1) representation with all roots outside the unit circle. Accordingly, the unit root test has to account for serial correlated errors by augmenting the equation with lagged differences (cf. Said and Dickey, 1984), by using the prewhitening approach proposed by Breitung and Das (2005), or by using the nonparametric approach suggested by Moon and Perron (2004). In the following theorem we nevertheless analyze the limiting behavior of the original test statistics introduced in Section 3. The effects of an adjustment for serial correlation are considered in Remark 5.
THEOREM 2. Assume that yit is generated as in (1)–(3) with A = Ir and |θ| < 1.
(i) If (N,T → ∞) and N/T → 0, then

where λi*, σ2, and ω2 are defined in Theorem 1,


(ii) If in addition N2/T → 0, we have

Remark 5. There are alternative ways to account for the serial correlation of the errors eit. As shown by Chang (2004) the augmented Dickey–Fuller test, where lagged differences are included in the regression, is invalid in a panel data setup. Breitung and Das (2005) suggest an alternative approach where the test is applied to the prewhitened series

and the autoregressive coefficients are the least-squares estimators of the individual specific regressions

Under the null hypothesis the prewhitened series

is a pure random walk series, and the test statistic suggested in Section 3 can be applied. Moon and Perron (2004) adopt a nonparametric approach that eliminates the nuisance parameters from the limiting distribution.
In a factor model, the prewhitening approach may fail if the short-run dynamics are individual specific. Under the null hypothesis H0(b) the errors in (4) can be represented as eit = γi′vi + wit, where wit = θwi,t−1 + εit − εi,t−1. Because the parameters of the ARMA(1,1) representation of eit depend on γi, the ARMA representation is different across the panel units, in general. The prewhitening approach uses an autoregressive approximation to the ARMA(1,1) process yielding

However, if αi(L) is different across i the factors are no longer common to all units. As noted by Stock and Watson (2002) the dynamic factor model (14) can be represented as a factor model with

as the vector of common factors, where p* = max{p1,…, pN}.
Moreover, even if the number of factors is increased and the autoregressive representation is generous enough to yield sufficient approximations of the ARMA(1,1) processes, the GLS approach remains invalid. First, the prewhitening procedure removes the serial correlation of eit but does not yield serially uncorrelated idiosyncratic errors uit (which would eliminate the nuisance parameter θ). Second, if the idiosyncratic errors are stationary, the numerator of the GLS test statistic has a larger stochastic order than the denominator regardless of the serial correlation in eit.
Remark 6. It is not surprising that the defactoring approach (i.e., the test statistic tQ) is invalid in case B. Because the nonstationary factors are removed, the test applied to the defactored series tends to reject the null hypothesis of nonstationary time series.
6. CASE C: ft ∼ I(0) AND uit ∼ I(1)
In the third case we assume that the common factors are stationary, whereas the idiosyncratic components are nonstationary. Accordingly, the null hypothesis is

As in case B, this assumption implies that the errors eit in regression (4) have an ARMA(1,1) representation, yet this time of the form eit = γi′ ft* + εit, where ft* = (1 − ρL)−1(1 − L) ft. In the following theorem, the asymptotic properties of the test statistics are summarized.
THEOREM 3. Assume that yit is generated as given in (1)–(3) and H0(c). As (N,T → ∞) and N/T → 0, tols and trob diverge to −∞,

, and, if N2/T → 0,

.
It turns out that the GLS and the defactorization approach tQ are valid in this case, whereas the OLS-based test statistics tend to indicate stationary time series as N and T tend to infinity.
7. SMALL-SAMPLE PERFORMANCE
In this section, we present the results of some Monte Carlo experiments performed to investigate the finite-sample performance of the four tests analyzed in Sections 4–6, i.e., the pooled OLS t-statistic (tols), the robust test (trob), the GLS t-statistic (tgls), and the test statistic tQ defined in (12) using the transformation matrix QMP given in (13), where Ω is replaced by

. This test is denoted by

. In addition we have included the GLS statistic that imposes the factor structure by using the (estimated) inverse covariance matrix given in (10). This test statistic is denoted by tgls*.
In the first set of our Monte Carlo simulations, the data are generated as in (1)–(3) with r = 1 (the single-factor model). All starting values are set equal to zero, and vt is drawn from an

distribution. The factor loadings γi are drawn from a U(0,2) distribution, and the error vector εt = [ε1t,ε2t,…,εNt]′ is independently drawn from an

distribution.
5We also investigate the small-sample properties of the tests in a model with individual specific constants, where the individual specific means are removed by subtracting the first observations (see Section 3). The results are quite similar to the case without a constant (see also Breitung and Das, 2005, where both cases are presented). The results for the model with individual specific constants are available from the authors on request.
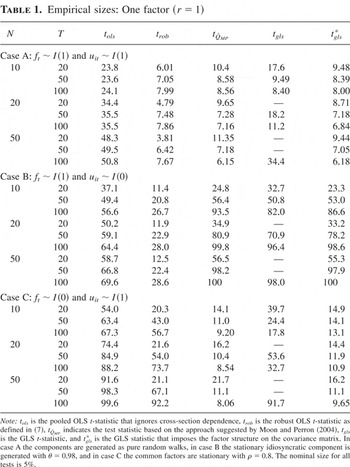
Table 1 reports the actual sizes of the tests. In the top part of the table the results for case A are presented, where both components are generated as random walks (i.e., θ = 1 and ρ = 1). Our theoretical findings summarized in Theorem 1 suggest that in this situation the OLS-based test statistics are biased, whereas the GLS test (tgls), the modified GLS test (tgls*), and the

test are asymptotically valid. These results are confirmed by the simulation results presented in Table 1. According to Remark 2, we expect that the actual size of the test converges to 0.6827 as N and T tend to infinity. Indeed, this test statistic is severely biased, with an actual size exceeding 0.5 if N = 50 and T = 100.
Empirical sizes: One factor (r = 1)

Theorem 1(i) indicates that in a single-factor model the robust t-statistic is distributed as the Dickey–Fuller t-statistic. The 5% critical value of this distribution is −1.95 compared to the critical value of −1.645 for the standard normal distribution. Therefore, we expect a moderate positive size bias of the robust OLS t-statistic. Indeed, our Monte Carlo simulations suggest that this test statistic slightly overrejects as T becomes large.
As suggested by our Monte Carlo simulations, the actual sizes of the test statistics that impose the factor structure (

and tgls*) are close to the nominal size. In contrast, the general GLS t-statistic is severely biased if T is only slightly larger than N. Our results suggest that the nominal size is attained when T is at least 10 times larger than N. This result is in line with our theoretical results that require N2/T → 0 for the distribution to be asymptotically standard normal.
The second part of Table 1 presents the actual sizes of the test if the panel units are cross-cointegrated (case B). We set θ = 0.98 to generate “near-integrated” errors, which seems plausible for many economic applications.
6We also tried other values of θ. For smaller values of θ the results are much more pronounced, and the asymptotic properties are apparent in smaller sample sizes also.

statistic tend to −∞ and therefore the actual size tends to one. This is confirmed by our Monte Carlo simulations, where in large samples the rejection frequencies are close to unity.
The theoretical considerations of Section 6 suggest that in case C the actual sizes of the OLS-based statistics tend to one, whereas the actual sizes of the

and tgls statistics are expected to converge to the nominal ones as N and T tend to infinity. Setting ρ = 0.8 yields a stationary factor with long-run dynamics that are clearly different from the idiosyncratic components, and the theoretical findings should be relevant in fairly small samples also. The results of our Monte Carlo simulation presented in the third part of Table 1 show that this is indeed the case, as the GLS statistic suffers from size distortions in small samples. It generally has a larger size bias than the

statistic that disappears slowly as T increases.
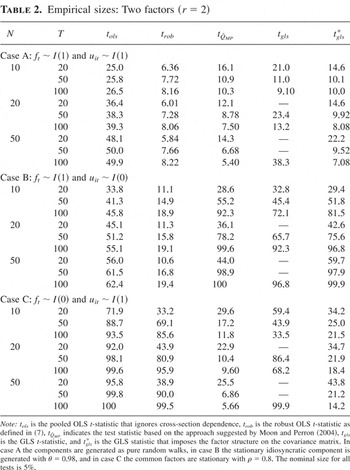
Next we consider a factor model with r = 2, where the factors are generated as fjt = ρfj,t−1 + vjt (j = 1,2) and the idiosyncratic errors are generated as in the single-factor model. The results of the Monte Carlo simulations for the three situations considered in Sections 4–6 are presented in Table 2. In general, the results are similar to the findings based on the single-factor model. A notable difference is that the tests that impose the two-factor structure (

and tgls*) perform substantially worse in small samples. Furthermore, it is important to note that these tests are computed assuming that the correct number of factors is known. If the number of factors is estimated, e.g., by using the information criteria suggested by Bai and Ng (2002), one can expect that the performance will be even worse.
Empirical sizes: Two factors (r = 2)

8. CONCLUSIONS
In this paper we analyze the size properties of various unit root tests in panels where the cross-section dependence is due to common factors. Banerjee et al. (2005) demonstrate that first generation panel unit root tests may be severely biased. In this paper we also consider the asymptotic properties of second generation panel unit root tests that were suggested to cope with cross-section dependence. We analyze three different situations. First, the common factors and idiosyncratic components may both be nonstationary. In this case the GLS test and tests that apply a transformation for removing the common factors possess a standard normal limiting distribution, whereas the OLS-based test statistics are invalid. Second, if the common component is I(1) and the idiosyncratic component is stationary (the case of cross-unit cointegration), then all tests are invalid. Finally, if the idiosyncratic components are I(1) but the common factors are stationary, then the OLS-based test statistics are not applicable, whereas GLS test procedures that remove the cross-section dependence are asymptotically valid. These findings are confirmed by our Monte Carlo simulations.
APPENDIX
Proof of Theorem 1. The matrix Ω = E(Δyt Δyt′) = ΓΓ′ + Σ is decomposed as Ω = VΛV′, where Λ = diag(λ1,…, λN), λ1 > ··· > λN are the ordered eigenvalues and V = [ν1,…, νN] is the matrix of orthonormal eigenvectors. Let zt = Λ−1/2V′yt denote an N × 1 vector of random walks with unit covariance matrix. We have

where

. Because ξiT is independent of ξjT for i ≠ j and other regularity conditions that are implied by Assumption 1, it follows from Theorem 1 of Phillips and Moon (1999) that

as (N,T → ∞) and N/T → 0, where we have used the fact that λi is bounded for i ≥ r + 1. It follows that

as (N,T → ∞).
In a similar manner it follows that

as (N,T → ∞), where

.
Under the null hypothesis the least-squares estimator

is Op(T−1N−1/2) (see, e.g., Moon and Perron, 2004), and therefore

. It follows for the elements of the estimated covariance matrix

that

where ωij denotes the (i,j)th element of Ω. Let

. We have

Because λi is bounded for i ≥ r + 1 we have

, and therefore, as (N,T → ∞),

Using

it follows that


Next we consider the GLS t-statistic. Let

, where the elements of ΔNT are Op(T−1/2). We make use of the following expansion (e.g., Zellner, 1962):

where asymptotically negligible terms are suppressed. It follows that

where we have used the fact that ∥Ω−1/2yt−1∥ = Op(N1/2), ∥Ω−1/2Δyt∥ = Op(N1/2), and ∥Ω−1/2ΔNTΩ−1/2∥ = Op(N1/2T−1/2). Thus, if (N,T → ∞) and N2/T → 0 we obtain

Similarly, we have for (N,T → ∞) and N/T → 0

It follows that

as (N,T → ∞) and N2/T → 0.
Finally, as shown by Phillips and Sul (2003) and Moon and Perron (2004), the statistic tQ has a standard normal limiting distribution under the conditions of case A. █
Proof of Theorem 2. We define aNT as in the proof of Theorem 1 and write

Because ft and ut are independent we obtain


as (N,T → ∞). Let Δzt(r) = [Δz1t,…, Δzrt]′ = Λ(r)−1/2V(r)′Δyt, where Λ(r) is a diagonal matrix with the first r eigenvalues of E(Δyt Δyt′) on the leading diagonal and V(r) is an N × r matrix with the associated r eigenvectors. Because N−1Λ(r)1/2Δzt(r) = V(r)′ΓΔft + Op(N−1/2) it follows that

, and therefore

as (N,T → ∞).
Because E(Δut′ut−1) = E {[(θ − 1)ut−1′ + εt′]ut−1} = −(1 − θ)(1 − θ2)−1tr(Σ) we have

as (N,T → ∞). Therefore,

As in Theorem 1 it can be shown that

Thus,


Next we consider the GLS t-statistic. As (N,T → ∞) and N2/T → 0 we have

Because ut is stationary we obtain as N2/T → 0

It follows that as (N,T → ∞) and N2/T → 0

Finally, we consider the defactorization approach proposed by Phillips and Sul (2003) and Moon and Perron (2004). Let ζt = Qyt, where QΓ = 0. As for dNT we obtain as (N,T → ∞)

and

This implies that

Proof of Theorem 3. As in Theorems 1 and 2 we obtain as (N,T → ∞) and N/T → 0

and

Furthermore,

Because SiT is Op(T−1) for i = 1,…, r and E(SjT) = ½ for j = r + 1,…, N it follows that cNT = Op(T−1/2) + O(N−1). Therefore,

and

tend to −∞ as N and T tend to infinity.
Using similar results as in Theorems 1 and 2 we obtain as N2/T → 0

The first term of the right-hand side is Op(N−1/2), whereas for the second term we have

where

and vi is the ith eigenvector of Ω. Thus dNT is asymptotically normally distributed with E(dNT) = 0 and var(dNT) → ½.
In a similar manner we obtain as (N,T → ∞) and N/T → 0

It follows that

.
Finally, because in the defactorization approach the factors cancel out, the test is applied to the (estimated) nonstationary idiosyncratic components. In this case Moon and Perron (2004) showed that the test statistic has a standard normal limiting distribution. █