


INTRODUCTION
Temperature is a key environmental influence that is known to affect parasites and host–parasite relationships in several ways, from killing the parasite to hindering its transmission and disrupting the synchronization between its life cycle and that of the host (Feder et al. Reference Feder, Stolz, Lewis, Perry, Roethele and Rogers1997; Poulin, Reference Poulin1998; Wharton, Reference Wharton1999; Randolph, Reference Randolph2004). Temperature can be particularly influential for some parasites and/or life stages. For instance, arthropod ectoparasites that remain attached to their host throughout their life are protected against external temperatures. By contrast, species which leave the host during the free-living phase of their life cycle are exposed to ambient temperatures most of the time (Wharton, Reference Wharton1999; Bush et al. Reference Bush, Fernandez and Esch2001), and thus run the risk of dying.
Whereas some authors have addressed the effect of temperature during the parasitic phase on several parameters of ectoparasites (see, for instance, Merino and Potti, Reference Merino and Potti1996; Dawson et al. Reference Dawson, Hillen and Whitworth2005), much less information is available about the influence of temperature during the free-living life-cycle stages of parasites and whether this influences host–parasite interactions (but see Wall et al. Reference Wall, French and Morgan1992; Pitts and Wall, Reference Pitts and Wall2006; van Dijk and Morgan, Reference van Dijk and Morgan2008). Further research is needed on some basic aspects for which the free-living phase is critical, such as the effect of temperature on the rates of growth or the emergence of adult parasites (Dawson et al. Reference Dawson, Hillen and Whitworth2005). A particularly important topic in this regard is the role of environmental factors in the regulation of synchronization of host–parasite life cycles. Despite the likely influence of abiotic factors on various (free and parasitic) phases of the life cycle of parasites, the mechanisms underlying host–parasite synchronization are still poorly understood (Hodek, Reference Hodek2002; Thomas and Blanford, Reference Thomas and Blanford2003; but see Langer and Hance, Reference Langer and Hance2000; Hance et al. Reference Hance, van Baaren, Vernon and Boivin2007; Calero-Torralbo and Valera, Reference Calero-Torralbo and Valera2008).
Diapause is a form of dormancy determined both by genetic and environmental factors that allows individuals to survive when circumstances are adverse, and ensures synchronization of active stages with favourable conditions (Lees, Reference Lees1950; Tauber et al. Reference Tauber, Tauber and Masaki1986; Danks, Reference Danks1987). It is an important part of the life cycle in many invertebrate species and, as such, it is studied to model and predict population responses to the environment at an evolutionary scale (Kostal, Reference Kostal2006). Environmental factors are known to regulate various phases of diapause. For instance, temperature and photoperiod are the main abiotic factors regulating diapause termination (William and Adkisson, Reference William and Adkisson1964; Anderson, Reference Anderson1970; Tauber and Tauber, Reference Tauber and Tauber1975; Masaki et al. Reference Masaki, Ando and Watanabe1979; Kato and Sakate, Reference Kato and Sakate1981; Tauber et al. Reference Tauber, Tauber and Masaki1986) since they are reliable cues for the organisms to time emergence with the occurrence of favourable periods. Environmental temperature is an important predictor in species with seasonal diapauses of several months and may have a principal role in those habitats where photoperiodic signals are less distinct or available (e.g. some tropical habitats, soil, caves) (Danks, Reference Danks1987; Kostal, Reference Kostal2006). The effect of temperature on diapause length and resumption of direct development has been studied for a long time (Lees, Reference Lees1950; Tauber et al. Reference Tauber, Tauber and Masaki1986; Leather et al. Reference Leather, Walters and Bale1993; Hodek, Reference Hodek1996, Reference Hodek2002; Gray et al. Reference Gray, Ravlin and Braine2001; Teixeira and Polavarapu, Reference Teixeira and Polavarapu2002, Reference Teixeira and Polavarapu2005). A period of low temperature (chilling) also may be essential for diapause termination (Tauber et al. Reference Tauber, Tauber and Masaki1986) even though the assumption that it is a general prerequisite for completion of diapause development in all insects is subject to controversy (Hodek, Reference Hodek2002). Identification of specific conditions/stimuli participating in the termination of diapause is meaningful since such conditions may have a synchronizing effect preventing untimely diapause termination and premature resumption of development (Kostal, Reference Kostal2006; Pitts and Wall, Reference Pitts and Wall2006).
Carnus hemapterus Nitzsch 1818 (hereafter C. hemapterus) is a 2-mm long blood-sucking fly that parasitizes nestlings of a variety of bird species whose breeding phenology varies considerably (Grimaldi, Reference Grimaldi1997). The system formed by this ectoparasite and its avian host species provides an interesting scenario for research on the influence of temperature on diapause termination and its ecological and evolutionary consequences within the framework of host–parasite relationships because: (i) C. hemapterus parasitizes cavity-nesting species (Grimaldi, Reference Grimaldi1997), where the luminosity is very limited. Thus, it is possible to decouple the effect of photoperiod and temperature in this system; (ii) C. hemapterus overwinters in the nest as a pupa and therefore has a long free-living phase exposed to ambient temperature; (iii) diapause in C. hemapterus seems to be polymorphic since three different types (a short diapause, a winter diapause and a diapause that may prolong itself for years) have been described (Guiguen et al. Reference Guiguen, Launay and Beaucournu1983; Valera et al. Reference Valera, Casas-Crivillé and Calero-Torralbo2006; Amat-Valero et al. Reference Amat-Valero, Vaclav, Martínez and Valera2012); (iv) host temperature and habitat type have been shown to influence C. hemapterus diapause and emergence (Calero-Torralbo and Valera, Reference Calero-Torralbo and Valera2008; Calero-Torralbo et al. Reference Calero-Torralbo, Václav and Valera2013); and (v) some degree of synchronicity has been recorded between the appearance of the host and its parasite's emergence (Liker et al. Reference Liker, Markus, Vozár, Zemankovics and Rózsa2001; Valera et al. Reference Valera, Casas-Crivillé and Hoi2003; Calero-Torralbo et al. Reference Calero-Torralbo, Václav and Valera2013). These facts suggest that some environmental signs regulate such synchronicity and that temperature may be one of these ambient cues.
Whereas it has already been shown that temperature changes during spring (the period when hosts are available) influence diapause termination (Calero-Torralbo and Valera, Reference Calero-Torralbo and Valera2008) we do not know the thermal responsiveness of diapausing pupae in winter. Here we hypothesize that ambient temperature during the free-living phase of C. hemapterus regulates its diapause and acts as a synchronizing stimulus with regard to emergence date. Specifically we address the following questions: (i) Are free-living, winter-diapausing carnid pupae sensitive to thermal environment? (ii) If so, how does temperature variation during this phase influence the emergence phenology of the parasite? (iii) Is chilling a prerequisite for completion of diapause development? To answer these questions we experimentally exposed diapausing pupae from different host species to contrasting vernal temperatures with and without cold shocks and studied the emergence pattern of the infective phase.
MATERIALS AND METHODS
Study species
Carnus hemapterus is a generalist bird ectoparasite and it is distributed around a wide region in the world (Bequaert, Reference Bequaert1942; Guiguen et al. Reference Guiguen, Launay and Beaucournu1983; Grimaldi, Reference Grimaldi1997). Its life cycle takes place completely in the nest and comprises an adult parasitic stage, 3 larval phases encompassing around 21 days at 22 °C and 95% relative humidity (RH) and a pupal stage (Guiguen et al. Reference Guiguen, Launay and Beaucournu1983). Flies usually overwinter as pupae in their hosts' nests. After a diapause usually lasting several months (Guiguen et al. Reference Guiguen, Launay and Beaucournu1983), imagines emerge the following spring both in occupied and unoccupied nests, with a certain synchronization with the presence of the host (Liker et al. Reference Liker, Markus, Vozár, Zemankovics and Rózsa2001; Calero-Torralbo and Valera, Reference Calero-Torralbo and Valera2008), thus allowing the perpetuation of C. hemapterus in the nest. Nonetheless, both a short diapause (Guiguen et al. Reference Guiguen, Launay and Beaucournu1983; Amat-Valero et al. Reference Amat-Valero, Vaclav, Martínez and Valera2012) and a long diapause that may prolong itself for years (Valera et al. Reference Valera, Casas-Crivillé and Calero-Torralbo2006) have been described for this parasite. Adults are initially winged after their eclosion and can disperse when searching for an occupied nest, but they typically lose their wings once they find a suitable host (Roulin, Reference Roulin1998).
In southern Spain the Spotless starling Sturnus unicolor begins breeding in early March and some pairs have a second clutch at the end of May. Incubation lasts about 11 days and fledglings leave the nest between 18–25 days after hatching (Cramp and Perrins, Reference Cramp and Perrins1994). The Common kestrel Falco tinnunculus breeds in our study area from April to June. Incubation lasts about 25 days and nestlings stay in the nest 26–30 days. The breeding period of the European roller Coracias garrulus lasts from early May until approximately mid-July. Eggs are incubated about 20 days and fledglings leave the nest approximately 20–22 days after hatching (Václav et al. Reference Václav, Valera and Martínez2011). These three species breed in cavities and frequently occur in sympatry in steppe and semiarid areas in Spain.
Study area and material collection
The main study area (∼50 km2) lies in the Desert of Tabernas (Almería, SE Spain, 37°05′N, 2°21′W). The climate in this area is semi-arid with high annual and seasonal rainfall variability (mean annual rainfall c. 218 mm), and strong thermal oscillations with inter-annual differences. Summers are long and hot and winters are usually mild. A second study area lies in Jaén province (S Spain, range 37°49′N, 3°39′W to 38°2′N, 3°36′W), approximately 200 km northwest from the one in Almería. The climate in this area is Mediterranean, with dry and hot summers and rainy and mild winters.
Nests of various bird species were sampled in different localities in both study areas during November 2008, December 2009 and July 2010 (Table 1). The samples were kept in transparent plastic bags and were moved to the Estación Experimental de Zonas Áridas (EEZA, Almería 36°50′N 02°28′W) after collection.
Sampling effort: number of samples collected from different hosts and locations for each experimental treatment. The number of samples yielding carnid flies in each experimental group (control, spring and chilling+spring) and the range of emerged flies are also shown for each experiment (except for samples collected in 2008, see text)

Experimental design
It is accepted that carnid pupae have a winter diapause (Guiguen et al. Reference Guiguen, Launay and Beaucournu1983) although it is not known when it ends. Winter diapauses of insects inhabiting temperate regions usually end when the ambient temperatures attain their seasonal minimum (Hodek, Reference Hodek1983, Reference Hodek1996, Reference Hodek2002); in our study area that is reached in January. Our experimental design consisted of exposing carnid pupae to different abiotic conditions during November–December and, thus, we assume that pupae were in dormancy when they entered the experimental treatments. At this time of the year, experimental groups of pupae were subjected to increased temperature resembling spring conditions (experiments in 2008, 2009 and 2010, hereafter spring treatment) and chilling and increased spring temperature (experiment in 2010, hereafter chilling treatment). Control groups were simultaneously maintained at ambient winter temperature (either in outdoor locations – 2008 and 2009 – or in indoor locations – 2010) (Table 1). The emergence pattern of control and experimental groups was then compared (see below).
Samples for the experiments in 2008–2009 and 2009–2010 were split in two subsamples of the same mass after collection. Each subsample, placed in an open plastic bag and then kept in a gauze bag, was randomly assigned to experimental and control treatments.
In 2008–2009 we studied the effect of temperature increase during winter time on the start of emergence of carnid flies. Experimental subsamples were collected in mid-November 2008, stored indoors in replicated natural conditions (i.e. ambient temperature moderated by partial enclosure and darkness) and, from mid-December onwards, they were subjected to spring conditions in darkness. Meanwhile, control subsamples were kept in natural holes in the study area. Date of first emergence was recorded in all subsamples until the end of April.
During the next wintering season (2009–2010) we also explored the effect of premature temperature increase on carnid pupae, but this time we studied the whole emergence period. Experimental subsamples were collected in mid-December, and entered the experimental treatment (spring conditions in darkness) a few days after collection (see Fig. 1 and below). Control subsamples, also collected in mid-December, were moved to an outdoor room in Almería, stored in a cardboard box and kept in the shade and in darkness (Fig. 1).
Experimental design of the study. For each experiment year, host species and sampling date are given. For each treatment sample size (in brackets), and details of the manipulation (dates, setting and environmental conditions) are given.

In 2010–2011 we studied the effect of premature temperature increase and chilling on the emergence pattern of carnid flies. Samples were collected in July 2010 and sieved through 8, 4, 1 and 0·4 mm sieves, and pupae in the last sieve together with fine sand were collected. Samples were stored indoors, in replicated natural conditions at the EEZA until 12 November 2010 when they were split in groups with equal mass. Not all samples had enough material, so we allocated 11 samples to each of the 3 treatments, 8 samples to 2 treatments (chilling and spring) and 3 samples were kept undivided and assigned to the control treatment. Every subsample/sample was kept in open plastic bags and then maintained in closed gauze bags. On 15 November 2010 each sample/subsample (when available) was assigned to the following treatments: (i) control: kept indoors at the EEZA during the whole experiment; (ii) spring temperature: stored indoors (with control subsamples) and on 30 November 2010 entered the spring treatment; (iii) chilling: exposed to low temperature (see below) during 15 days from mid-November 2010 and then to spring conditions in darkness from 30 November onwards (Fig. 1).
The experimental conditions used to resemble spring and chilling temperatures were established after data collection in the field. Temperature and humidity data-loggers (Maxim/Dallas Integrated Products, Inc.) placed in cavity nests showed that during April–May (when C. hemapterus emergence naturally starts in our study area for most of the studied species; Calero-Torralbo and Valera, Reference Calero-Torralbo and Valera2008) temperature and humidity ranges were 15–25 °C and 50–80% respectively (in prep.). During winter (from December to March) the data showed a range of temperature around 6–13 °C. Concerning humidity, it is highly variable at this period, and depending on the type of nest (in prep.), ranging from around 60% to saturation. On the basis of such information we therefore set the experimental spring conditions as 21–23 °C and 60–65% RH and chilling conditions as 10 °C and 85% RH.
Experimental subsamples for the 2008–2009 and 2009–2010 experiments were placed in a climatic test chamber model Ineltec-CCSP©, programmer PR-920 and software PROCAM WIN 2000, precision: ±1 °C and ±3% RH. Experimental subsamples for the 2010–2011 experiment were placed in a climatic test chamber model Solatron-CCI©, Interface RS-232, precision: ±0·1 °C and ±1% RH. In 2008–2009 the experimental conditions were registered every minute by the sensors installed in the chamber. However, during 2009–2010 and 2010–2011 data-loggers recording temperature and humidity every 15 min were additionally placed in the climatic chamber. Data-loggers were also placed together with the control subsamples for all years to check the conditions they were subjected to.
During the 2009–2010 experiment the chamber worked inadequately during 9–14 April, so that temperature rose to 30 °C on 12–13 April and humidity dropped to 40–50%. This period coincided with the 9th and 10th emergence weeks (see Results). Figures 4 and 5 suggest that they did not affect the overall emergence pattern.
All subsamples were monitored every 3–4 days (starting on 7 January 2009 for the 2008 experiment, 2 January 2010 for the 2009 experiment and 7 December 2010 for the 2010 experiment) until at least 10 days after the last emerged fly was recorded. After each checking the location of subsamples in the chamber was randomized. Flies emerging from each subsample and date were separately preserved in 70% ethanol and subsequently counted and identified with the aid of a stereoscopic microscope.
In summary, pupae in the experimental spring groups were subjected for at least 33 days (from the start of the experiment until emergence of the first fly) to higher temperatures than pupae in control groups. Differences in temperature between both groups depended on ambient conditions and on the date of the start of the experiment (see Table 2). Additionally, in 2010–2011 an experimental group was subjected to a cold shock for 15 days before entering the spring conditions (Table 2).
Mean (±s.e.) temperature and humidity in experimental and control subsamples in all three procedures for the period when the experimental subsamples were under laboratory conditions until emergence of the first fly in any subsample (in parentheses)

Statistics
For 2008–2009 prevalence (percentage of samples in which C. hemapterus emergence was recorded with respect to the total number of samples) and first emergence date (1 = 1 January) were registered for control and experimental subsamples. For the 2009–2010 and 2010–2011 experiments prevalence, abundance (the number of emerged flies per subsample), first and last emergence date, length of the emergence period (days between the emergence of the first and the last fly), mean emergence date, emergence pattern (percentage of flies emerged in each subsample in 1-week periods) and the cumulative percentage of emerged flies per week were calculated for all subsamples. Samples where fewer than 5 flies emerged were discarded in all cases except for prevalence calculation.
Tests were chosen according to the number of experimental groups and the sample size. Thus, differences in prevalence were tested by means of the Exact Unconditional Tests (Reiczigel et al. Reference Reiczigel, Abonyi-Tóth and Singer2008) for data from 2008–2009 and 2009–2010 and by Fisher Exact tests for data from 2010–2011. Paired comparison tests were used to examine differences in flies abundance (Wilcoxon tests for data from 2008–2009 and repeated measures ANOVAs for data from 2010–2011) and differences in emergence dates and duration (t-test for 2008–2009, Wilcoxon tests for 2008–2009 and repeated measures ANOVAs for 2010–2011) among experimental and control subsamples. To check the assumption of sphericity in repeated measures ANOVAs, we used Mauchly's test and when the sphericity was not met, Greenhouse–Geisser estimator was used to adjust the degree of freedom (von Ende, Reference von Ende, Scheiner and Gurevitch2001). Post-hoc tests (Fisher's LSD) were used to look for differences among treatments in 2010–2011.
In order to compare the emergence rate among experimental and control subsamples we represented the mean weekly cumulative emergence, calculated the slopes of each curve (within the range 10–90% emergence) by means of simple regressions and, finally, compared the slopes (t-test, ANOVA and multiple comparisons) following Zar (Reference Zar1984).
All values reported are means±s.e. and all P-values are two-tailed. Statistical tests were done with the programs Quantitative Parasitology 3.0 (Reiczigel and Rozsa, Reference Reiczigel and Rozsa2005) and Statistica (version 10).
RESULTS
Effect of temperature on prevalence and abundance of C. hemapterus
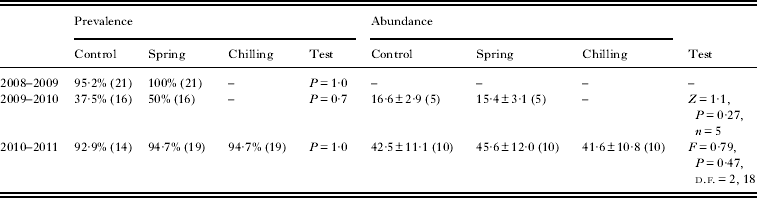
The experimental treatments did not influence either the prevalence or abundance of carnid flies (Table 3). The number of subsamples where fewer than 5 flies emerged (2009–2010: 1 and 3 subsamples in control and spring treatments respectively; 2010–2011: 1 subsample in both chilling and spring treatment) did not vary among treatments either (2009–2010: Exact unconditional test, P = 1·0; 2010–2011: Fisher's test, P = 1·0).
Prevalence and abundance of control and experimental subsamples in each experiment. Differences in prevalence were tested by means of Exact unconditional tests (for 2008–2009 and 2009–2010 data) and Fisher's exact test (for 2010–2011). Abundance data were tested by means of Wilcoxon test (2009–2010) and repeated measures ANOVA (2010–2011 data). Means and s.e. are shown (sample size in parentheses)
Effect of temperature on the length of the emergence period
Emergence of carnid flies in the 2009–2010 experimental subsamples lasted significantly longer (Wilcoxon test: P = 0·04) (on average 36 days) than in the corresponding control subsamples (Table 4). Similarly, both experimental treatments in 2010–2011 produced a significantly longer emergence period (Repeated Measures ANOVA: adjusted P<0·001, Table 4) in comparison to the one observed in the control group (on average 75·9 days longer in the spring subsample and 46·9 days longer in the chilling subsample). Post hoc tests showed that the length of the emergence period also differed between the spring and chilling treatment (on average 29 days longer in spring subsamples, P = 0·02).
Date of first and last emergence (1 = 1 January) of carnid flies and length of the emergence period in each experiment. T-tests for dependent samples (2008–2009), Wilcoxon tests (2009–2010) and repeated measures ANOVAs (2010–2011) were used. Means and s.e. are shown; coefficients of variation are in square brackets and sample sizes in parentheses. When sphericity is not met, Adjusted P values referring to the Greenhouse–Geisser corrected probability are shown for each repeated measures ANOVA test

The protracted emergence period in the experimental subsamples is mainly due to a significantly earlier emergence of flies in comparison with control subsamples in all experiments (Table 4). The date of first emergence did not differ between chilling and spring subsamples (Post-hoc test: P = 0·8). The date of first emergence was more variable (see CVs in Table 4) in experimental subsamples for 2008–2009, 2009–2010 and only for the spring subsample in 2010–2011.
Concerning the date of last emergence, there were no differences in 2009–2010 (Wilcoxon test: P = 0·12, Table 4), whereas in 2010–2011 flies from spring subsamples emerged significantly later than flies from chilling and control subsamples (Repeated Measures ANOVA: adjusted P = 0·002, post hoc tests: P<0·05 in both cases). Experimental subsamples (spring in 2009–2010, spring and chilling in 2010–2011) also had a greater variability than control ones in the date of last emergence (Table 4).
Effect of temperature on the emergence pattern
Experimental manipulations influenced both the emergence pattern and emergence rate of carnid flies. Whereas emergence in control subsamples was quite steady and unimodal, it was more irregular (even with a saw-tooth shape) in spring and chilling subsamples (Figs 2 and 3 for 2009–2010 and 2010–2011 respectively).
Mean weekly percentage of emergence (±SE) of carnid flies in experimental and control subsamples in 2009–2010 (week 1 = 12–19 February, week 18 = 3–10 June) (n = 5 subsamples for each group).

Mean weekly percentage of emergence (±SE) of carnid flies in experimental and control subsamples in 2010–2011 (week 1 = 3–9 January, week 30 = 25–31 July) (n = 10 subsamples for each group).

The mean emergence date of carnid flies in 2009–2010 was 1 month earlier in spring subsamples than in control ones (5 March and 9 April respectively, Wilcoxon test, Z = 2·0, P = 0·043, N = 5). In 2010–2011 the mean emergence date also differed among treatments (Repeated Measures ANOVA, F 2,18 = 90·0, adjusted P<0·001), being earliest in the chilling treatment, then in the spring one and latest in the control treatment (10 March, 11 April and 13 May respectively, post hoc tests: P<0·01 in all cases).
Moreover, in 2009–2010 the cumulative percentage of emerged flies (within the 10–90% range) in control subsamples encompassed 5 weeks whereas it took 11 weeks in spring subsamples. Thus, the slope of the regression line of the mean weekly cumulative emergence in control subsamples was significantly higher in comparison to the one of spring subsamples (β = 17·6 and 7·9 for control and spring respectively, t = 9·5, d.f. = 12, P<0·001; Fig. 4). This was also the case for the experiment in 2010–2011, when cumulative emergence in spring subsamples took 13 weeks, with 9 weeks for chilling subsamples and only 5 weeks for control subsamples. The slopes of each regression line differ significantly from the others (F 2,21 = 7·78, P<0·01), being highest for the control subsamples and lowest for the spring ones (β = 16·8, 9·5 and 6·9 for control, chilling and spring treatment respectively, post hoc tests: P<0·001 in all cases, Fig. 5).
Lineal regressions of the mean (±SE) weekly cumulative emergence (in %) curves of experimental and control subsamples in 2009–2010 (week 1 = 15–21 February, week 13 = 3–9 May). Sample size is 5 nests for each subsample.

Lineal regression of the mean (±SE) weekly cumulative emergence (in %) curves of experimental and control subsamples in 2010–2011 (week 1 = 28 February–6 March, week 14 = 30 May–5 June). Sample size is 17 nests for both chilling and spring subsamples and 13 nests for control subsamples.

DISCUSSION
Our experiments did not influence either the prevalence or abundance of carnid flies. However they did demonstrate that the free-living, winter-diapausing pupal stage of C. hemapterus is sensitive to thermal changes and that temperature variation at this stage influences the emergence pattern of the parasite since: (i) pupae under experimental conditions emerged earlier; (ii) a protracted emergence at the end of the season was observed in subsamples subjected to the spring treatment; (iii) the mean emergence date of experimental subsamples occurred earlier when compared with the one in control subsamples; (iv) the emergence pattern was more irregular in both types of experimental subsamples; (v) the emergence rate was also lower in the experimental subsamples in comparison to the control ones, and (vi) as a result, the emergence period of carnid flies in experimental subsamples lasted significantly longer than in the corresponding control subsamples.
We also found that chilling had an effect over C. hemapterus emergence: this treatment produced an earlier mean emergence date, a shorter duration of the emergence period and a higher emergence rate when compared with the spring treatment. In contrast, the first emergence date was similar in chilling and spring treatments. These findings agree with previous studies in other insects (Anderson and Kaya, Reference Anderson and Kaya1975; Nechols et al. Reference Nechols, Tauber and Helgesen1980; Shimoda and Kiuchi, Reference Shimoda and Kiuchi1997), supporting that chilling accelerates diapause development and reduces the pupal period. More specifically, Milonas and Savopoulou-Soultani (Reference Milonas and Savopoulou-Soultani2000) reported that cold periods followed by subsequent temperature increases favoured enhanced and synchronous reactivation. This is indeed our case, since: (i) variability in the date of first emergence in chilling subsamples was similar to the one reported for control subsamples and was the half that found in spring subsamples, and (ii) the length and variability in the emergence period in chilling subsamples was lower than in spring subsamples, suggesting a more homogeneous emergence in the former treatment.
Our understanding of the phases and mechanisms involved in diapause termination is still very incomplete (Kostal, Reference Kostal2006). We do know that the control of development and the diapause intensity programming regulate a suitable diapause termination and that both mechanisms are influenced by changes in environmental conditions or token signals (see, for instance, Masaki, Reference Masaki2002; Kostal, Reference Kostal2006). Chilling is a common factor terminating many winter diapauses even though it is not a general prerequisite (Hodek, Reference Hodek2002; Kostal, Reference Kostal2006). Our results suggest that chilling is not necessary for diapause completion in C. hemapterus but it did accelerate diapause completion and served as a synchronizing stimulus limiting premature termination of diapause (see Kostal, Reference Kostal2006). Then, favourable temperature triggered some internal regulator of the speed of development (Tauber et al. Reference Tauber, Tauber and Masaki1986; Broufas and Koveos, Reference Broufas and Koveos2000; Kemp and Bosch, Reference Kemp and Bosch2005; Teixeira and Polavarapu, Reference Teixeira and Polavarapu2005) so that pupae subjected to temperature increase emerged more than 1 month earlier than control pupae and a high percentage of flies emerged in experimental subsamples before emergence started in the control ones (2009–2010: 57%; 2010–2011: 42·6% in chilling subsamples and 14·2% in spring subsamples, before the second fly emerged in control samples; a first fly emerged bizarrely early, see Fig. 3).
A key role of diapause is to overlap the active phases of the life cycle of insects with their seasonally available food supply. This is important for short-lived parasites that, like C. hemapterus, feed on ephemeral resources. Calero-Torralbo and Valera (Reference Calero-Torralbo and Valera2008) experimentally found that overwintering carnid pupae subjected to an increased temperature in spring (27·5 °C, resembling an early occupancy of the nest by a host) advanced the mean date of emergence and produced an earlier and faster rate of emergence in comparison with control pupae (without a temperature increase). Thus, whereas an earlier start of C. hemapterus emergence has been consistently found regardless of the time when temperature is manipulated (this study and Calero-Torralbo and Valera, Reference Calero-Torralbo and Valera2008), the emergence rate increased or decreased depending on the time the temperature rise occurs: a premature temperature increase produced a low emergence rate whereas a temperature increase during the time the hosts are available (spring) produced a fast emergence rate. This finding suggests that temperature increases promote rapid responses in C. hemapterus pupae and that these responses aim to overlap the most likely period of host availability.
It is known that diapause termination and direct development resumption may be based on heat accumulation (Tauber et al. Reference Tauber, Tauber and Masaki1986; Kostal, Reference Kostal2006) but we still do not know the underlying mechanisms regulating differential responses to the same stimulus. Since individuals may enter diapause in different periods of the year there is place for a plastic phenotypic diapause intensity that may vary in response to environmental signals (Masaki, Reference Masaki2002). Seemingly, C. hemapterus has a polymorphic diapause and there could exist different emergence phenotypes (e.g. early and late) with different diapause duration or post-diapause degree day requirements (Waldbauer, Reference Waldbauer1978; Waldbauer and Sternburg, Reference Waldbauer and Sternburg1986; Biron et al. Reference Biron, Langlet, Boivin and Brunel1998), pupae of different generations or with different life cycle strategies (Amat-Valero et al. Reference Amat-Valero, Vaclav, Martínez and Valera2012).
Whatever the mechanism, the potential significance of the thermal sensitivity and plasticity of diapause in C. hemapterus is meaningful. This fly is able to parasitize a wide range of host species whose availability (i.e. period of hatching of various bird species) encompasses several months (from March to July). Therefore, selection for ability to respond to eventual alternative host appearance by means of phenotypic plasticity in diapause traits could be advantageous (Calero-Torralbo and Valera, Reference Calero-Torralbo and Valera2008). Whereas some degree of synchronization between C. hemapterus emergence and the occurrence of their hosts has been reported (Liker et al. Reference Liker, Markus, Vozár, Zemankovics and Rózsa2001; Valera et al. Reference Valera, Casas-Crivillé and Hoi2003), variation in synchronization at the nest and population level has also been found (Calero-Torralbo et al. Reference Calero-Torralbo, Václav and Valera2013). A high sensitivity to temperature (both ambient and host-related) during the final phases of diapause together with a remarkable plasticity in the termination of diapause could result in polymodal emergence (see Figs 2 and 3) suggesting a bet-hedging strategy against environmental uncertainty, by which at least a proportion of the population could ensure host encounter (Hopper, Reference Hopper1999; Menu et al. Reference Menu, Roebuck and Viala2000). For a generalist species such as C. hemapterus, thermal phenotypic plasticity in diapause traits could be a result of natural selection (Blanckenhorn, Reference Blanckenhorn1998).
ACKNOWLEDGEMENTS
We thank Vladimir Kostal, Raul Bonal and Radovan Václav for constructive comments on earlier versions of this manuscript. Teresa Martínez kindly helped during fieldwork. Pedro A. Jódar, Francisco J. Pulpillo, Francisco J. Martín and Iberus Medioambiente S.L. generously shared with us their infrastructure and knowledge of the study area in Jaén province. Junta de Andalucía kindly granted permissions for fieldwork.
FINANCIAL SUPPORT
During the elaboration of this paper the authors received financial support from the Programa de Incentivos de Carácter Científico y Técnico de la Junta de Andalucía. FV also received financial support from the Spanish Ministry of Science and Innovation (CGL2008-00562) and the European Regional Development Fund. MA-V was funded by the program JAE-Predoc run by the CSIC and cofinanced by the European Social Fund.



