



INTRODUCTION
Parasites of the genus Eimeria cause chicken coccidiosis resulting in significant economic losses worldwide. Eimeria has been used as a model to study macrogametocyte maturation and oocyst wall biogenesis due to the fact that the sexual stages are easily harvested from the infected chicken intestine. Accordingly, numerous microscopic and molecular approaches have been utilized over the last several decades to characterize the basic aspects of the developmental biology of maturing male (micro-) and female (macro-) gametocytes (Mehlhorn, Reference Mehlhorn1971; Pittilo and Ball, Reference Pittilo and Ball1979; Ferguson et al. Reference Ferguson, Belli, Smith and Wallach2003). This research includes studies on the morphology and biochemical make-up of the two types of wall-forming bodies (Fried et al. Reference Fried, Mencher, Sarshalom and Wallach1992; Belli et al. Reference Belli, Lee, Thebo, Wallach, Schwartsburd and Smith2002, Reference Belli, Mai, Skene, Gleeson, Witcombe, Katrib, Finger, Wallach and Smith2004; Mouafo et al. Reference Mouafo, Weck-Heimann, Dubremetz and Entzeroth2002; Frölich et al. Reference Frölich, Johnson, Robinson, Entzeroth and Wallach2013) as well as the fine structure and biochemistry of the oocyst wall (Belli et al. Reference Belli, Ferguson, Katrib, Slapetova, Mai, Slapeta, Flowers, Miska, Tomley, Shirley, Wallach and Smith2009; Mai et al. Reference Mai, Sharman, Walker, Katrib, De Souza, McConville, Wallach, Belli, Ferguson and Smith2009, Reference Mai, Smith, Feng, Katrib, Slapeta, Slapetova, Wallach, Luxford, Davies, Zhang, Norton and Belli2011; Bushkin et al. Reference Bushkin, Motari, Carpentieri, Dubey, Costello, Robbins and Samuelson2013, Reference Bushkin, Motari, Magnelli, Gubbels, Dubey, Miska, Bullitt, Costello, Robbins and Samuelson2012; Katrib et al. Reference Katrib, Ikin, Brossier, Robinson, Slapetova, Sharman, Walker, Belli, Tomley and Smith2012; Rieux et al. Reference Rieux, Gras, Lecaille, Niepceron, Katrib, Smith, Lalmanach and Brossier2012; Matsubayashi et al. Reference Matsubayashi, Hatta, Miyoshi, Anisuzzaman, Sasai, Yamaji, Shimura, Isobe, Kita and Tsuji2014).
The process of oocyst wall formation involves the transport of wall-forming bodies (WFBs) to the parasite's cell surface where the type 1 wall-forming bodies (WFB1s) exocytose their cargo neutral (acid-fast) lipids into the outer layer of the oocyst wall (Bushkin et al. Reference Bushkin, Motari, Carpentieri, Dubey, Costello, Robbins and Samuelson2013; Frölich et al. Reference Frölich, Johnson, Robinson, Entzeroth and Wallach2013), while the WFB2s give rise to the inner oocyst wall containing cross-linked, tyrosine-rich glycoproteins (Belli et al. Reference Belli, Lee, Thebo, Wallach, Schwartsburd and Smith2002, Reference Belli, Wallach, Luxford, Davies and Smith2003), respectively. These molecules that are delivered to the developing oocyst wall are processed using an array of enzymes, including polyketide synthase (Bushkin et al. Reference Bushkin, Motari, Carpentieri, Dubey, Costello, Robbins and Samuelson2013), peroxidase and subtilisin (Belli et al. Reference Belli, Smith and Ferguson2006; Katrib et al. Reference Katrib, Ikin, Brossier, Robinson, Slapetova, Sharman, Walker, Belli, Tomley and Smith2012), glucan synthase and hydrolase (Bushkin et al. Reference Bushkin, Motari, Magnelli, Gubbels, Dubey, Miska, Bullitt, Costello, Robbins and Samuelson2012). As a result, a waxy, lipid-rich outer oocyst wall is produced along with an inner wall layer composed of di-tyrosine cross-links and a trabecular scaffold of β-1, 3-glucans.
Scholtyseck and Mehlhorn proposed in the 1970s the concept that the transport of cargo lipids, sugars and proteins contained within the type 1 and 2 WFBs is mediated by the parasite's ‘tubules’, each having a width of 75 Å (Mehlhorn, Reference Mehlhorn1971). However, since that report, little work has been done to elucidate the involvement of the parasite's cytoskeleton in regulating the changes in macrogametocyte morphology during oocyst wall formation and biogenesis.
In the present study, three-dimensional (3D) scanning laser confocal microscopy was employed using probes specific to the macrogametocyte WFBs type 1 and the actin cytoskeleton for studying macrogametocyte and oocyst differentiation at various developmental time points. Results from this study indicated that the actin cytoskeleton is directly involved in WFB1 transport to the periphery of the parasite during oocyst biogenesis. Furthermore, studies using inhibitors of actin polymerization to treat macrogametocytes in vitro indicated that both WFB1 integrity and oocyst wall biogenesis is dependent upon an intact actin cytoskeleton.
MATERIALS AND METHODS
Parasite maintenance and gametocyte harvest
The Houghton strain of Eimeria maxima used throughout these experiments was originally provided by Professor Martin Shirley (Institute for Animal Health, Compton, Newbury, Berkshire, UK). The oocysts were periodically passaged in 4-week-old Australorp chickens, and cleaned as described previously (Wagenbach et al. Reference Wagenbach, Challey and Burns1966). Gametocytes were prepared using techniques published previously (Frölich et al. Reference Frölich, Shahparee, Wasinger and Wallach2014) with a slight modification. Briefly, chickens were infected at 4 weeks of age with 10 000 sporulated oocysts per os. They were sacrificed 132–134 h post-infection (pi) and their intestines were removed and immediately washed with ice-cold phosphate-buffered saline (PBS; pH 7·4). The intestines were slit open lengthwise and the mucosa scraped using a glass coverslip and the contents collected. The collected material, containing all stages of gametocytes development, including oocyst wall formation, was placed on the top of a 17 μm polymon filter and washed with PBS at room temperature. The material on the filter was discarded and the flowthrough, containing the gametocytes, was filtered through a 10 μm polymon filter. The gametocytes which accumulated on the filter were washed with PBS and counted in a counting chamber. The average yield obtained was in the range of 0·5–1 × 10⁵ gametocytes/infected intestine.
Actin staining with phalloidin-Alexa514
Isolated sexual stages were fixed with 3% formaldehyde in SAC buffer (170 mM NaCl, 10 mM Tris pH 7, 10 mM glucose, 5 mM CaCl2, pH 7.4) at room temperature for 15 min. After three washing steps in SAC buffer, the cells were resuspended in 1 ml of SAC containing 1% Triton X-100 and incubated at room temperature for 5 min to allow Permeabilization. Permeabilized cells were washed with SAC buffer, resuspended in 100 μL phalloidin-Alexa514 (1/100 dilution, Life technologies 30/32 Compark Circuit, Melbourne VIC 3170) and incubated for 45–60 min at room temperature. The cells were washed twice by centrifugation (1000 g , 5 min) and macrogametocyte wall forming bodies type 1 (WFB1s) and the outer oocyst wall material were visualized by incubating parasites in the presence of Evans blue, as described previously (Ferguson et al. Reference Ferguson, Belli, Smith and Wallach2003; Frölich et al. Reference Frölich, Shahparee, Wasinger and Wallach2014). Finally, samples were mounted on a glass slide with Vecta-Shield anti-fade medium (Vector Laboratories) and analysed by confocal microscopy.
In vitro experiments with drugs
Isolated gametocytes were immediately incubated with microfilament disorganizing drugs Cytochalasin D (Cyt D; Sigma, cat no: C8273) or Latrunculin (LAN; Sigma, cat no: L5163) dissolved in 0·1% dimethyl sulfoxide (DMSO) in SAC buffer (170 mm NaCl, 10 mm Tris pH 7, 10 mm glucose, 5 mm CaCl2, pH 7·4). Each inhibitor was tested at 1 μ m concentrations selected according to previous studies in protozoan parasites (Castillo-Romero et al. Reference Castillo-Romero, Leon-Avila, Perez Rangel, Cortes Zarate, Garcia Tovar and Hernandez2009, Reference Castillo-Romero, Leon-Avila, Wang, Perez Rangel, Camacho Nuez, Garcia Tovar, Ayala-Sumuano, Luna-Arias and Hernandez2010; Angrisano et al. Reference Angrisano, Riglar, Sturm, Volz, Delves, Zuccala, Turnbull, Dekiwadia, Olshina, Marapana, Wong, Mollard, Bradin, Tonkin, Gunning, Ralph, Whitchurch, Sinden, Cowman, McFadden and Baum2012; Herrera-Martinez et al. Reference Herrera-Martinez, Hernandez-Ramirez, Lagunes-Guillen, Chavez-Munguia and Talamas-Rohana2013; Luo et al. Reference Luo, Yu, Lieu, Allard, Mogilner, Sheetz and Bershadsky2013). 0·1% DMSO, the drug diluents, was used as negative control. The experiments were performed in triplicate. All treatments were carried out for 30 min for 37 °C.
Confocal microscopy, image analysis and processing
A Nikon A1 laser scanning confocal microscope (Nikon) equipped with a 100 × oil immersion lens (NA 1·4) objective, blue (ex 405, em 425–475 nm), green (ex 488, em 500–50 nm) and red filter sets (em 640 nm, ex 662–737 nm), NIS Elements software was used to collect image stacks with 0·2–0·5 μm distance between single planes. The z-projections were generated using Bitplane Imaris suite version 7.1·0 (Bitplane Scientific). The ‘spheres’ module was used to determine the number of the Evans blue-stained WFB1s in untreated and drug-treated parasites.
Statistical analysis
Quantitation of WFB1s was performed by randomly selecting ten microscopic fields of view at 100 × magnification. Statistical analysis was performed using GraphPad Prism 6 (GraphPad Software, San Diego, CA, USA). Data are expressed as means ± se unless otherwise stated. Data from two groups were compared using Student's 2-tailed t-test for paired samples and data between groups were compared using a one-way analysis of variance (ANOVA). Values of P≤0·05 were considered statistically significant.
RESULTS
Three stages of oocyst wall assembly
Oocyst wall assembly during maturation of Eimeria macrogametocytes occurs by incorporation of precursors transported by the WFBs to the plasma membrane of the parasite. To follow the incorporation of WFB precursors, we used Evans blue stain as a marker of WFB1 vesicles and the outer oocyst wall (Ferguson et al. Reference Ferguson, Belli, Smith and Wallach2003). We performed 3D confocal microscopy to analyse the spatial distribution of different steps of this process. This showed that three distinct stages in oocyst biogenesis could readily be distinguished in the isolated gametocytes: synthesis of the WFB1 vesicles, exocytosis of the precursors stored within the WFB1 vesicles and incorporation of the released material to form the outer oocyst wall (Fig. 1, supplementary Movies S1, S2).
The spatial distribution of WFB1s and the outer oocyst wall in macrogametocytes at different time points of oocyst wall biogenesis. (A, B, C) 3D projections with deconvolution of E. maxima mature macrogametocytes (A), early stage (B) and unsporulated oocysts (C) showing WFB1s and the outer oocyst wall (labelled in red). Quadrants correspond to 10 μm. (A1, B1, C1) Top and side (A2, B2, C2) views of same samples as shown in A, B, C generated using the Isosurface tool in Imaris. Labelling shows 37 WFB1s with more than 80% of them situated in the periphery of mature macrogametocyte. In late-stage macrogametocytes, a total of 23 very large WFB1s in macrogametocytes at early stages of oocyst wall formation, and a full staining of the outer oocyst wall in unsporulated oocysts. (A3, B3, C3) Magnification of the regions depicted in A2, B2, C2. Scale bars are indicated.

Initially, oocyst wall precursors can be detected in the cytoplasm of gametocytes at around 132 h p.i. when the first cells in the population start to synthesize large WFB1 vesicles. As can be seen in Fig. 1, the top view (x-, y-, z-axis) of a rounded mature macrogametocyte (Fig. 1A) shows a total of 37 Evans-blue positive WFB1s located in the cytoplasm of the parasite. At this stage, WFB1 appear as large vesicles reaching 2·5 μm in diameter (Fig. 1, supplementary Fig. S1A2). The number of WFB1 vesicles varies from cell to cell and is in the range of approximately 15–40. The top view in Fig. 1, supplementary Fig. S1A1, and the side view in Fig. 1, supplementary Fig. S2A2, of the WFB1s revealed narrow bridges extending laterally from each organelle linking adjacent WFB1s together (Fig. 1, supplementary Fig. S1A2 and arrows in S1A3). The surfaces of these organelles were nodular in appearance (Fig. 1, supplementary Fig. S1A3).
The top view of an early oocyst (Fig. 1B) revealed an ovoid parasite with approximately 23 WFB1s grouped in patches, presumably undergoing exocytosis. At this point, most of the WFB1s reached a maximum of 5 μm in diameter, were located in the periphery, were fused together and were flattened on their surface revealing a homogeneous content (Fig. 1, supplementary Fig. S1B1-B2, arrows in B3). Statistical analysis of Evans blue positive WFB1 showed that, in mature macrogametocytes, the number of WFB1s with a minimum 2·5 μm in diameter was 29·20 ± 2·878. The Evans blue labelled outer oocyst wall of formed tissue oocysts showed that the wall material was patchy in appearance with areas that were unstained by the dye (Fig. 1C, arrows). Based on isosurface rendering (Fig. 1, supplementary Fig. S1C1) we observed nodules on the surface and areas of patchiness where the wall was still being formed (Fig. 1, supplementary Fig. S1C2 and arrows in S1C3). The 3D shape and the spatial distribution of WFB1 s at various developmental stages are also shown in supplementary Movies S1–S2, which enables visualization of the parasites from all angles.
Morphological changes in the oocyst biogenesis involves actin remodelling
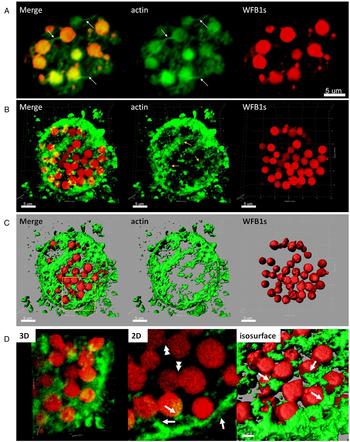
We used the fluorescent probe phalloidin to analyse the localization of polymerized F-actin in the cytoplasm of macrogametocytes at various developmental time points. Evans blue-stained macrogametocytes were subsequently incubated with fluorescent phalloidin and analysed by two-dimensional (2D) and 3D confocal microscopy. As shown in Fig. 2A, phalloidin localized to microfilaments of various length comprising the fibrous network in the cytoplasm of mature macrogametocytes (Fig. 2, supplementary Fig. S2A, arrows). The microfilaments ranged from 3 to 5 μm in length. At this stage, F-actin was seen linking the WFB1s into structures that resemble ‘beads-on-a-string’ (Fig. 2, supplementary Fig. S2A, arrows). Figure 2B and C shows in 3D the labelled F-actin forming a complex web-like meshwork in the cytoplasm of mature macrogametocytes with WFB1s trapped inside. Figure 2D shows a zoomed in top view of a 3D reconstruction, a corresponding single focal slice (Fig. 2, ‘2D’) and the corresponding isosurface rendering (Fig. 2, ‘isosurface’). It can be seen that labelled F-actin filaments are in direct contact with the WFB1s (Fig. 2, supplementary Fig. S2D, arrows). Double arrows in Fig. 2D illustrate fusion taking place between the WFB1s vesicles.
Spatial distribution of actin and WFB1s in mature E. maxima macrogametocytes. (A) Conventional 2D confocal scanning laser microscopy of mature E. maxima macrogametocytes labelled with markers for F-actin (green) and for WFB1s (red). Note the labelling of long F-actin filaments physically connected to the WFB1s. (B) 3D reconstruction, (C) isosurface rendering, (D) magnification of the region depicted in C with corresponding 2D focal slice and surface rendering. Single arrows mark areas where the F-actin threads are physically associated with the WFB1s linking them together. Arrowheads point to WFB1s undergoing fusion. Scale bas is indicated.
In mature macrogametocytes which are commencing oocyst wall formation (Fig. 3), all of the Evans Blue-stained WFB1s were situated in the periphery of the parasite (Fig. 3, A). The phalloidin-stained microfilaments were localized at the cell surface in alignment with the shape of the egg-like, early stage oocyst (Fig. 3, supplementary Fig. S3A, arrows). At that stage, the central cytoplasm was mostly free from microfilaments. Analysis of 3D micrographs showed the threads connecting the WFB1s to the microfilaments located at the cell periphery (Fig. 3, supplementary Fig. S3B-C). It can be seen that the labelled F-actin filaments are making direct contact with the WFB1s (Fig. 3, supplementary Fig. S3D, arrows), while several of the WFB1s had undergone fusion and released their contents into the outer layer of the forming oocyst wall (Fig. 2, double arrows in ‘2D’). The distribution of the actin cytoskeleton and the WFB1s at this stage of development is shown in the 3D reconstructions in supplementary material Movie S3 and S4.
Structure and organization of actin filaments and WFB1s in late stage E. maxima macrogametocytes. Confocal micrographs of late-stage macrogametocyte at early stages of oocyst wall formation labelled with Oregon Green phalloidin (green) and Evans blue (red). (A) Single cross-sections from 3D reconstruction of late macrogametocyte. Arrows mark the extensions of F-actin concentrated in the periphery of the parasite associated with large WFB1s vesicles linking them together to resemble ‘beads on a string’. (B, C) 3D reconstructions and projections of (A). (D) Magnification of the region depicted in (C) with corresponding 2D focal slice and isosurface rendering. Scale bars indicated.

Spatial reorganization of the actin cytoskeleton during oocyst biogenesis
In tissue oocysts, we observed the completed exocytosis of the WFB1s to form the outer oocyst wall (Fig. 4, supplementary Fig. S4A). At that point in parasite development, F-actin labelled microfilaments were not found in the cytoplasm of maturing oocysts (Fig. 4, supplementary Fig. S4A). Instead, the F-actin was found lying directly underneath and running in parallel with the formed outer layer of the oocyst wall (Fig. 4, arrows in supplementary Fig. S4A).
The spatial organization of actin cytoskeleton and outer oocyst wall in E. maxima tissue cysts. (A) 2D and (B) 3D confocal microscopy of forming oocysts double stained with phalloidin (green) and Evans blue (red) showing the surface of the forming outer oocyst wall. Lying directly underneath and running in parallel is actin cytoskeleton (green). (C) Computer reconstructions of samples shown in (B). Rotations of the 3D reconstructions are presented in supplementary material Movie 5 and 6. (D) A zoomed view of the oocyst in (C), highlighting the patchiness of the outer oocyst wall in the process of formation. Scale bars indicated.

In top views (x, y, z-axis) of 3D computer reconstructions, intense F-actin fluorescence was observed at the cell surface (Fig. 4, supplementary Fig. S4B and C). The web-like meshwork could no longer be observed in the cytoplasm at this stage of oocyst development. Instead, F-actin was mostly found at the surface of the parasite co-localizing with the outer oocyst wall (Fig. 4, supplementary Fig. S4B).
Figure 4C and D shows that the actin cytoskeleton was located underneath the outer oocyst wall in the periphery of the egg shaped parasite. At places where the wall was incomplete, we were able to observe the actin running underneath the forming oocyst wall (Fig. 4, supplementary Fig. S4D, arrows). The distribution of the actin cytoskeleton and the WFB1s can be also visualized in the 3D reconstructions shown in supplementary material, Movie S5.
Effects of actin inhibitors
Having observed the rearrangement of the actin cytoskeleton over the course of oocyst biogenesis in E. maxima, we investigated whether the F-actin participates in the transport of WFB1s during this process. Freshly extracted parasites were first tested for viability using Trypan blue exclusion (data not shown). They were then incubated in the presence of Cyt D, an inhibitor of actin filament polymerization and elongation (Selden et al. Reference Selden, Gershman and Estes1980; Goddette and Frieden, Reference Goddette and Frieden1986), and LAN, which causes depolymerization of actin filaments (Morton et al. Reference Morton, Ayscough and McLaughlin2000). Following a 30 min incubation period with these drugs, confocal microscopy was used to analyse the F-actin distribution, the number of formed WFB1s and the morphological appearance of formed tissue oocysts. Macrogametocytes incubated in 0·1% DMSO in SAC only were used as a negative control. As can be seen in Fig. 5, control macrogametocytes showed numerous large WFB1s and cytoplasmic actin filaments (Fig. 5, supplementary Fig. S5A, arrows). Macrogametocytes treated with Cyt D and LAN presented irregular morphology and structures of F-actin outlining the cytoplasmic membrane without forming the characteristic cytoplasmic filaments of untreated macrogametocytes (Fig. 5, supplementary Fig. S5B and C, arrows).
Overall actin and WFB1s organization in E. maxima sexual stages treated with actin inhibitors. Freshly harvested E. maxima sexual stages were incubated with drugs, washed and fixed and F-actin and WFB1s were stained with Oregon Green-phalloidin (green) and Evans blue (red), respectively. 2D confocal micrographs show representative images of control (untreated; A) E. maxima macrogametocytes and those treated with Cyt D (B) and LAN (C), respectively. All treatments were carried out at 37 °C for 30 min. Scale bar represents indicated. Note the lack of actin filaments in the cytoplasm of drug-treated parasites and faint labelling of cytosolic WFB1s.

In order to quantitate the effect of the drugs on maturing macrogametocytes, the total number of WFB1s was counted in ten drug-treated vs ten control parasites, which were randomly selected. As can be seen in Fig. 6A, untreated cells had an average of 29 ± 2·87 WFB1s [with a diameter of at least 2·5 μm; a characteristic of fully formed WFB1s (Mehlhorn, Reference Mehlhorn1971; Ferguson et al. Reference Ferguson, Belli, Smith and Wallach2003; Frölich et al. Reference Frölich, Johnson, Robinson, Entzeroth and Wallach2013)) per macrogrametocyte, whereas in the presence of Cyt D and LAN, the number of mature WFB1s was found to be significantly lower (13 ± 1·26 for Cyt D and 11 ± 1·2 for LAN WFB1s on average per parasite, P < 0·001). Corresponding examples of drug-treated and control macrogametocytes is shown in Figure 6B. Furthermore, oocysts in the drug-treated parasite suspension appeared misshapen and displayed collapsed oocyst walls, suggesting an alteration in oocyst wall formation (Fig. 6, supplementary Fig. S6B).
Effect of actin cytoskeleton inhibitors on the maturation of WFB1s vesicles and the outer oocyst wall. The cells were treated with 1 μ m Cyt D or 1 μ m LAN for 30 min and stained with a marker for WFB1s (red). DMSO was used as a control (untreated). (A) Quantitative analysis of WFB1s with ≥2·5 μm in diameter. Results were analysed by one-way ANOVA comparison tests between the groups (untreated, Cyt D and LAN treated). Error bars are ±s.e.m. ***P < 0·001. (B) 3D confocal microscopy showing the shape and size of WFB1s and outer oocyst wall in untreated and treated parasites. Note the misshaped oocyst walls in drug-treated parasite suspension.

DISCUSSION
In this paper, we describe the role of the actin cytoskeleton in E. maxima macrogametocyte development and oocyst wall formation. Using markers specific for WFB1s and F-actin, which were visualized using confocal microscopy, we were able to demonstrate changes in the localization and distribution of F-actin at various stages of macrogametocyte maturation and oocyst biogenesis.
In previous studies, electron microscopy was used to observe mature macrogametocytes, and structures resembling ‘tubules’ were identified. It was hypothesized that these tubules may be involved in the transport of vesicles in maturing gametocytes (Mehlhorn, Reference Mehlhorn1971). In the current study using fluorescent dye markers for F-actin and WFB1s, the actin cytoskeleton organizational changes along with WFB1 localization were observed in freshly harvested gametocytes and early stage oocysts by 3D confocal microscopy. Our results showed that F-actin is in direct contact with WFB1s during their movement from the centre of the parasite to the periphery over the course of oocyst biogenesis. These results indicated that the transport of WFB1s is being actively facilitated by the actin filaments.
We next studied the subcellular localization and size of the actin microfilaments at various time points in macrogametocyte and oocyst development. We observed that in mature macrogametocytes the actin filaments were short and linked the WFB1s together into ‘beads on a string’. This bead-like arrangement of the WFB1 vesicles appears to be typical in mature macrogametocytes (Frölich et al. Reference Frölich, Johnson, Robinson, Entzeroth and Wallach2013). In addition, we found that the actin microfilaments formed a complex web-like meshwork throughout the cytoplasm of the mature macrogametocytes. As development continued to oocyst wall formation, the actin microfilaments were found to be mainly localized at the periphery of the parasite underneath the outer layer of the oocyst wall and that the microfilaments were found to be shorter in length. There is little if any actin remaining in the cytoplasm of the parasite at this stage of development. Throughout this process we were able to discern that the actin filaments were in direct contact with the WFB1s. From the observations in this study, we postulate that the actin microfilaments act to transport the WFB1s to the periphery of the parasite and once they reach that location they form direct bridges between themselves as they unload their cargo into the forming outer oocyst wall. These results indicate that actin may act to help form and stabilize the oocyst wall once the process of wall formation has been completed.
The importance of actin in oocyst biogenesis was shown by inhibitor studies with Cyt D and LAN. Both of these drugs have been used extensively to block the transport function of the actin cytoskeleton (Simon and Pon, Reference Simon and Pon1996) as well as prevent cytoplasmic streaming. Both Cyt D and LAN treatment resulted in a significant reduction in the size and number of the WFB1s and abnormalities in the shape and size of the oocyst wall. These results indicate that actin is essential for both the transport and maturation of the WFB1s, and is required for the synthesis of a properly formed oocyst.
In two other model cyst-forming parasites, Giardia and Entamoeba, actin was also shown to play an important role in encystation based on the morphological changes and decreased cyst yield caused by the drugs Cyt D, LAN and Jasplakinolide (Makioka et al. Reference Makioka, Kumagai, Ohtomo, Kobayashi and Takeuchi2001; Castillo-Romero et al. Reference Castillo-Romero, Leon-Avila, Perez Rangel, Cortes Zarate, Garcia Tovar and Hernandez2009, Reference Castillo-Romero, Leon-Avila, Wang, Perez Rangel, Camacho Nuez, Garcia Tovar, Ayala-Sumuano, Luna-Arias and Hernandez2010). Like in Eimeria, these parasites have encystation specific secretory vesicles containing β glucans, Cyst wall proteins (COWP), GalNac, acid-fast/neutral lipids and enzymes such as glucan synthases and cysteine proteases (Ellis et al. Reference Ellis, Wyder, Jarroll and Kaneshiro1996; Hetsko et al. Reference Hetsko, McCaffery, Svard, Meng, Que and Gillin1998; Bulik et al. Reference Bulik, van Ophem, Manning, Shen, Newburg and Jarroll2000; Gerwig et al. Reference Gerwig, van Kuik, Leeflang, Kamerling, Vliegenthart, Karr and Jarroll2002; Lanfredi-Rangel et al. Reference Lanfredi-Rangel, Attias, Reiner, Gillin and De Souza2003; Chavez-Munguia et al. Reference Chavez-Munguia, Cedillo-Rivera and Martinez-Palomo2004; De Souza, Reference De Souza2006; Ebert et al. Reference Ebert, Bachmann, Nakada-Tsukui, Hennings, Drescher, Nozaki, Tannich and Bruchhaus2008; Chatterjee et al. Reference Chatterjee, Carpentieri, Ratner, Bullitt and Costello2010; Faso et al. Reference Faso, Bischof and Hehl2013; Samuelson et al. Reference Samuelson, Bushkin, Chatterjee and Robbins2013).
In Eimeria, oocyst biogenesis can be divided into three phases – early, mid and late. During the early phase, changes in structure, metabolism, gene expression and protein transport occur (Mouafo et al. Reference Mouafo, Weck-Heimann, Dubremetz and Entzeroth2002; Ferguson et al. Reference Ferguson, Belli, Smith and Wallach2003; Belli et al. Reference Belli, Ferguson, Katrib, Slapetova, Mai, Slapeta, Flowers, Miska, Tomley, Shirley, Wallach and Smith2009; Mai et al. Reference Mai, Sharman, Walker, Katrib, De Souza, McConville, Wallach, Belli, Ferguson and Smith2009; Walker et al. Reference Walker, Slapetova, Slapeta, Miller and Smith2010; Katrib et al. Reference Katrib, Ikin, Brossier, Robinson, Slapetova, Sharman, Walker, Belli, Tomley and Smith2012; Frölich et al. Reference Frölich, Johnson, Robinson, Entzeroth and Wallach2013). The formation of WFB1s occurs in the mid phase (mature macrogametocytes). All of our results suggest that F-actin contributes to WFB1 formation, and that it participates in the mid to late stages by regulating WFB1 localization and transport to the periphery of the oocyst through the actin cytoskeleton. It will be interesting to analyse how molecular motors, which have been identified in the Eimeria maxima genome (Blake et al. Reference Blake, Alias, Billington, Clark, Mat-Isa, Mohamad, Mohd-Amin, Tay, Smith, Tomley and Wan2012; Reid et al. Reference Reid, Blake, Ansari, Billington, Browne, Bryant, Dunn, Hung, Kawahara, Miranda-Saavedra, Malas, Mourier, Naghra, Nair, Otto, Rawlings, Rivailler, Sanchez-Flores, Sanders, Subramaniam, Tay, Woo, Wu, Barrell, Dear, Doerig, Gruber, Ivens, Parkinson and Rajandream2014) and gametocyte proteome (unpublished data) interact with the WFB1s and consider other possible proteins that may regulate WFB1 transport.
Based on the results of the present study, we concluded that the actin cytoskeleton plays a key role in the WFB1s transport and in differentiation of macrogametocytes into oocysts. Therefore, the molecules involved in the transport and proper processing of these organelles represent potential targets for the development of new transmission blocking strategies. Work is currently in progress to identify the relevant proteins involved in these key developmental processes.
SUPPLEMENTARY MATERIAL
To view supplementary material for this article, please visit http://dx.doi.org/S0031182015000207.
ACKNOWLEDGEMENTS
We thank the team at the Ernst Facility for maintaining the chickens. Authors gratefully acknowledge the Faculty of Science, University of Technology, Sydney for funding this work. SF was supported by Australian Postgraduate Award. We are indebted to Associate Professor Cynthia Whitchurch (Director of the Microbial Imaging Facility at the iThree Institute, University of Technology Sydney) for inspiring discussions and her critical assessment of the work presented here. We thank Ms Erin Gloag (University of Technology, Sydney) for her help with statistical analysis.



