Recent events in Europe and the United States have brought issues of inclusion and exclusion to the forefront of political discussions about the place of racial and ethnic minority groups in Western democracies. From the 2011 riots in the UK to the racialized Brexit campaign, the Black Lives Matter Movement in the US, the ascendancy of Donald Trump, and hostility against immigrants in places like France, Belgium and Germany, minorities are facing increased scrutiny and discrimination from policy makers and rank-and-file members of the public. Although previous studies have recognized the central role of race and ethnicity in politics (Bonilla Silva Reference Bonilla Silva2001; Haney Lopez Reference Haney Lopez2000; Hirschman Reference Hirschman2004; Hutchings and Valentino Reference Hutchings and Valentino2004; Myrdal Reference Myrdal1944; Winant and Omi Reference Winant and Omi1994), much less emphasis has been placed on how different experiences of stigmatization may impact citizens’ civic and political engagement. Discrimination is rarely, if ever, considered in the most comprehensive models of political participation. Consequently, extant scholarship has not delved deeply into issues of conceptualization and measurement.
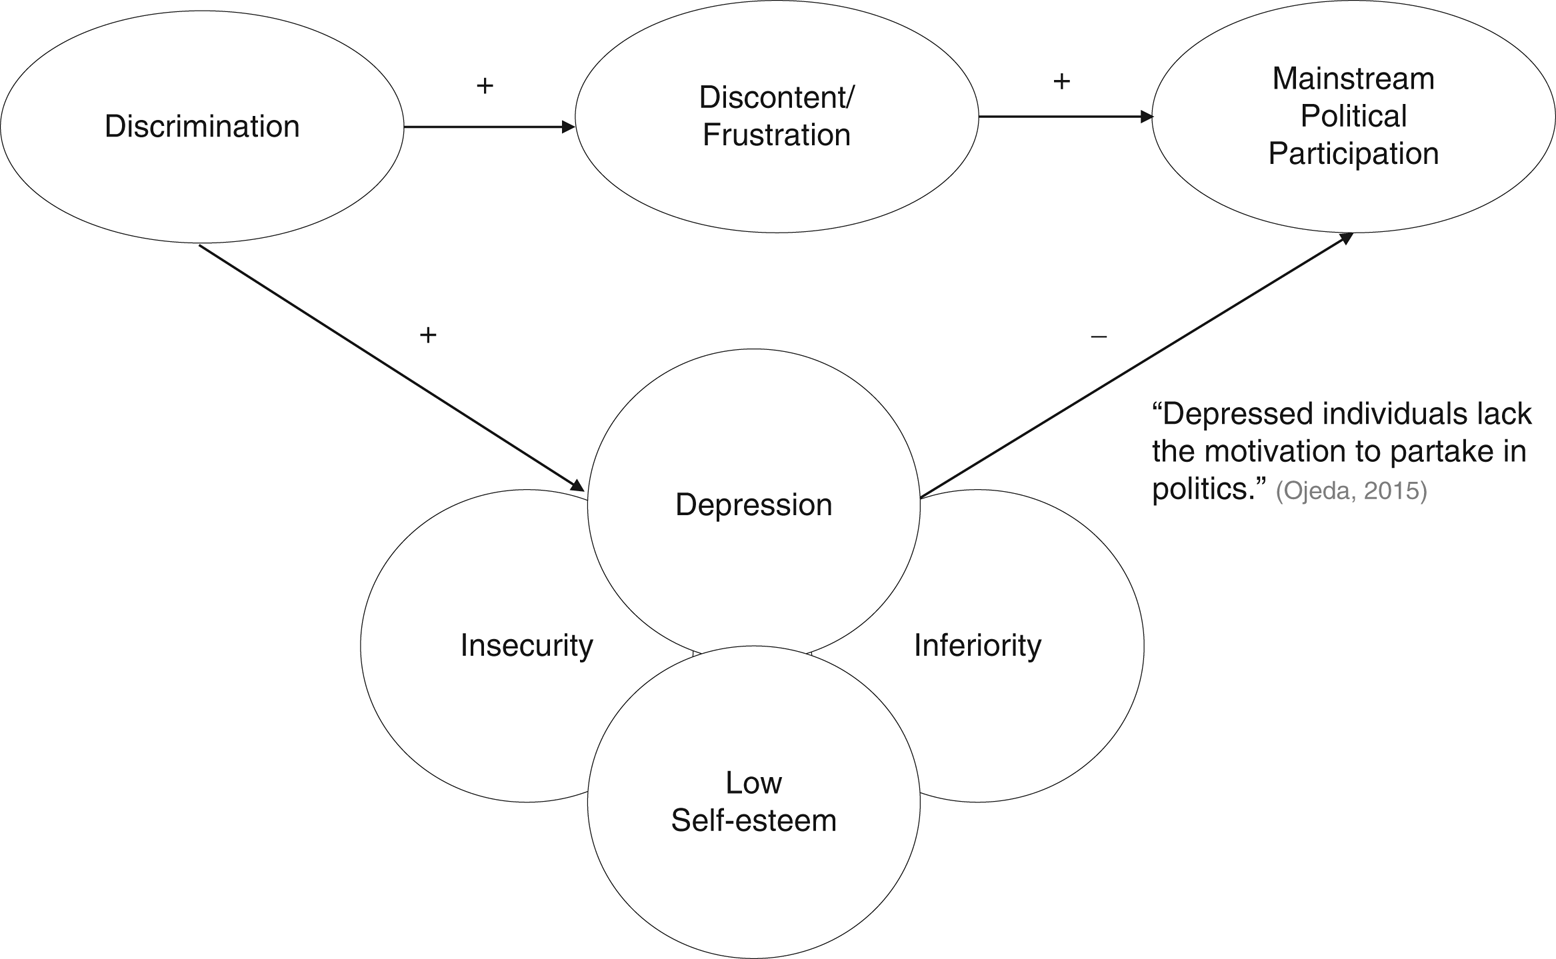
Political science studies that have broadly focused on this topic suggest that discrimination leads to a sense of political discontent, motivating individuals to engage in politics, particularly voting, for substantive or expressive purposes (Barreto and Woods Reference Barreto and Woods2005; Cho, Gimpel, and Wu Reference Cho, Gimpel and Wu2006; Pantoja, Ramirez, and Segura Reference Pantoja, Ramirez and Segura2001; Ramakrishnan Reference Ramakrishnan2005; Ramirez Reference Ramirez2013).Footnote 1 However, a large body of public health research on discrimination and psychological well-being challenges the implied link between discrimination and increased activism (see Figure 1). Numerous studies have shown that exposure to unfair treatment on the basis of race, ethnicity, religious affiliation or sexual orientation is associated with feelings of inferiority, insecurity, powerlessness and depression (Almeida et al. Reference Almeida2009; Banks, Kohn-Wood, and Spencer Reference Banks, Kohn-Wood and Spencer2006; Branscombe, Schmitt, and Harvey Reference Branscombe, Schmitt and Harvey1999; Cano et al. Reference Cano2016; Dion and Earn Reference Dion and Earn1975; Hodge, Zidan, and Husain Reference Hodge, Zidan and Husain2015; Noh and Kaspar Reference Noh and Kaspar2003; Padela and Heisler Reference Padela and Heisler2010), and that adverse mental health outcomes, such as depression, reduce the likelihood of voting (Ojeda Reference Ojeda2015; Ojeda and Pacheco Reference Ojeda and Pacheco2017). How do we reconcile these differences? What role does discrimination play in the overall puzzle of racial and ethnic minority political engagement?
Motivating research puzzle.

This article offers a new perspective on the study of discrimination and political behavior. Crossing disciplinary boundaries, I assert that individuals perceive discrimination from at least two distinct sources, and that the behavioral responses to discrimination depend partly on the qualitative nature of the discrimination perceived. Analysis of the 2010 Ethnic Minority British Election Study (EMBES) provides initial support for the proposed theory, suggesting that context-specific measures should be considered instead of overarching or global discrimination measures.
The first source of discrimination is political discrimination (PD), which can transpire in the form of laws, policies, practices, symbols, or political campaigns and discourse that aim to deprive some citizens of resources or rights based on group membership. Drawing on research on policy threats and minority politics, I claim that PD has the capacity to make politics more salient, motivating individuals to act collectively against institutions or actors that violate notions of equality and fairness embedded within democratic regimes.
In contrast to political or systematic discrimination, societal discrimination (SD) has the capacity to undermine participatory inclinations. This type of discrimination is defined as negative actions taken by individuals in the form of verbal or nonverbal antagonism, intimidation, avoidance or physical assault. SD is disseminated by rank-and-file members of society who are not affiliated with larger systems or institutions; it is a personal attack between peers, colleagues or community members in the course of everyday life. Drawing on the social psychology literature, I contend that citizens who feel rejected due to persistent negative interpersonal encounters are likely to internalize negative evaluations, resulting in a depleted sense of belonging and efficacy. Bridging the gap between research on mental health and political behavior, I then suggest that SD has the capacity to reduce citizens’ willingness to engage in mainstream political activities.
While partaking in mainstream channels of political influence, such as voting, may not appeal to societally marginalized individuals, engaging in ethnic-specific or in-group activities can be appealing as it offers an alternative avenue to register one’s frustrations and to seek acceptance (Branscombe, Schmitt, and Harvey Reference Branscombe, Schmitt and Harvey1999; Perez Reference Perez2015; Sanchez Reference Sanchez2006; Tajfel and Turner Reference Tajfel and Turner2001). As such, I also argue that a distinction between mainstream and in-group measures can further clarify the complex relationship between discrimination and political behavior.
The pages that follow offer a more detailed discussion of perceived discrimination, with examples drawn from the UK, followed by review of extant literature, the theoretical framework and research hypotheses. Next, the data selection process and measurement strategy will be discussed, followed by a detailed accounting of the analysis and results. The article concludes with a discussion of the findings, limitations and areas for future research.
The Multifaceted Nature of Perceived Discrimination
Broadly conceived, discrimination entails drawing a distinction through judgements or actions in favor of or against a person or group based on characteristics such as race, ethnicity, religion, gender, sexuality or disability (Blank et al. Reference Blank2004; Krieger Reference Krieger1999). Discrimination differs conceptually from prejudice in that the latter is a negative attitude or belief that is based on a faulty and inflexible generalization about a person because of group membership (Allport Reference Allport1955). Discrimination, thus, is the manifestation of prejudice. Discrimination is a complex phenomenon because it can be carried out systematically or informally by an array of actors in a multitude of ways ranging from fairly obvious to subtle methods (Essed Reference Essed1991; Jones Reference Jones1997; Kinder and Sears Reference Kinder and Sears1981; Krieger Reference Krieger1999; Ridley Reference Ridley1995). Therefore, a refined evaluation of perceived discrimination and its impact on political behavior requires paying attention to aspects of differential treatment that are not solely bound to structural circumstances (Blank et al. Reference Blank2004).
Building on previous research, I propose that there are at least two conceptually distinct sources of bias to which individuals may attribute negative outcomes. The first source is political and the second is societal. PD, as previously described, refers to actions taken by the state or private institutions/organizations and their affiliated actors intended to delegitimize or marginalize a group of people. Historically, various groups have been systematically denied equal standing on issues such as citizenship, immigration and civil liberties, and have been deprived of socioeconomic and legal resources (Canaday Reference Canaday2009; Holdaway Reference Holdaway1996; Kim Reference Kim1999; Ngai Reference Ngai2014; Smith Reference Smith1993). It is well documented in the UK that racial and ethnic minorities still face systematic barriers to inclusion and fair treatment in housing, education, employment and the criminal justice system (Clancy et al. Reference Clancy2001; Heath et al. Reference Heath2013; Mooney and Young Reference Mooney and Young1999; Solomos Reference Solomos1986, Reference Solomos1989). With respect to policing, for instance, minorities in general, but especially people of African-Caribbean and African descent, are not only more likely than whites to be stopped and arrested, but also six times more likely to be imprisoned and to receive longer sentences (Clancy et al. Reference Clancy2001; Mooney and Young Reference Mooney and Young1999). When reporting a crime, minorities are less satisfied than whites with the police response (Clancy et al. Reference Clancy2001). Concerns over terrorism across Europe have also exposed other minorities, notably Muslims, to increasing levels of scrutiny and profiling by government institutions and actors (Allen and Nielsen Reference Allen and Nielsen2002; Lambert and Githens-Mazer Reference Lambert and Githens-Mazer2010; Sheridan Reference Sheridan2006); the recent Brexit campaign relied on anti-immigrant and anti-Muslim discourse (Bayrakli and Hafez Reference Bayrakli and Hafez2017).
While citizens can recognize discrimination perpetuated by government actors, political elites or public figures, they can also perceive micro-level acts of stigmatization perpetuated by rank-and-file members of society. This is the second major source of discrimination, which refers to the more informal and routine interactions between individuals in public or private spaces (Essed Reference Essed1991). SD, similar to PD, is also a major concern in the UK. Chahal and Julienne’s (Reference Chahal and Julienne1999) investigation of discrimination among ethnic minorities demonstrates that being made to feel different is seen as a routine or even expected part of everyday life for some individuals. As a result of expecting interpersonal discrimination, about a third of respondents in a UK-based study reported that the way they led their lives was constrained by fears of being racially harassed (Virdee Reference Virdee1995). More recent research also demonstrates that up to 20,000 African-Caribbean individuals are exposed to some form of physical assault every year (Modood et al. Reference Modood1997; Parekh Reference Parekh2010), and another study found that South Asians, particularly Pakistani and Bangladeshi individuals, stand a much higher risk of being a victim of a racially motivated crime than whites (Clancy et al. Reference Clancy2001).Footnote 2
As the aforementioned definitions and examples illustrate, political and societal discrimination capture qualitatively distinct dimensions of stigmatization. And as outlined below, there is reason to suspect that these two dimensions may lead to divergent behavioral outcomes. Additionally, distinguishing between types of discrimination by source is necessary because broad discrimination questions may not only underestimate exposure to mistreatment (Krieger Reference Krieger1999), but also elicit imprecise answers since researchers cannot identify what the respondent was thinking about at the time that the question was posed.
Before proceeding to the next section, an important note on the scope of the present conceptualization and ensuing theoretical framework is necessary. While this study focuses on the behavioral consequences of individual attributions to political or societal rejection, there are also less recognizable cases of discrimination. For instance, one may be denied housing, a business permit or given a lower salary without realizing that the outcome is related to factors associated with one’s race or ethnicity. In such scenarios, a person’s propensity to engage in politics could be impacted as a function of depleted socioeconomic status or limited opportunities. Thus, differential treatment can still have a consequential impact on behavior without individuals ‘perceiving’ any discrimination. Furthermore, some cases of perceived discrimination may be difficult to categorize if contextual information about the nature of the interaction is missing or limited. In the case of housing discrimination, individuals may view their experience as a widespread problem of systematic or institutional bias, especially if the issue has been politicized. Alternatively, denial of housing may be perceived as a case of personal rejection such as a homeowner refusing to accept a potential tenant because of his/her race or ethnicity. This example highlights the shortcomings of broad discrimination measures and suggests that behavior can only be predicted to the extent that attributions to the source of discrimination can reasonably be identified by the researcher. Finally, prior work has also distinguished between group-level and individual-level discrimination (Schildkraut Reference Schildkraut2005). The former refers to a mere perception that discrimination against one’s group exists, while the latter involves perceiving personal discrimination against oneself. In this study, I focus on individual-level discrimination because it impacts the person directly, potentially influencing behavior much more meaningfully than the mere perception that inequalities against one’s group members exist in the world.
Political Discrimination and Engagement
Normatively, political participation is an essential element of the democratic process because it presents an avenue for individuals to influence policy making and hold their representatives accountable. It is thus not surprising that the study of political behavior has received extensive scholarly attention (Almond and Verba Reference Almond and Verba1963; Campbell et al. Reference Campbell1960; Putnam Reference Putnam2000; Rosenstone and Hansen Reference Rosenstone and Hansen1993; Verba and Nie Reference Verba and Nie1978; Verba, Nie, and Kim Reference Verba, Nie and Kim1978; Verba et al. Reference Verba1995). While important advancements have been made, dominant theories of participation have mostly focused on who is likely to participate and how much, rather than explaining why and under what conditions individuals are likely to spend their limited time, skills and resources on the political process. The latter question is of particular importance because an abundance of resources does not necessarily translate into increased attention and engagement, given that ambivalence is fairly common among citizens (Dahl Reference Dahl1961). As such, political scientists have increasingly turned to more context-specific factors to account for variations in political engagement in a world of ever-competing interests and distractions.
One key explanation pertains to political threat. Research has demonstrated that undesirable or threatening political contexts can align focus toward politics and motivate individuals to take action for expressive or substantive purposes (Campbell Reference Campbell2003; Marcus, Neuman, and MacKuen Reference Marcus, Neuman and MacKuen2000; Miller and Krosnick Reference Miller and Krosnick2004; Platt Reference Platt2008). According to this line of research, awareness of a threat can motivate people to take action because context interacts with emotions to produce political judgements and behaviors. When citizens encounter threatening actors, events or issues on the political horizon, their emotional system shifts from a sense of calm to increased anxiety. This shift in emotion interrupts ongoing activity, aligns focus toward the intrusive stimuli, and compels people to take action to protect their identities, values or material interests (Marcus, Neuman, and MacKuen Reference Marcus, Neuman and MacKuen2000).
Other studies suggest that a shared identity and a sense that the political system is unjust can lead racial and ethnic minorities to develop strong feelings of group attachment, linked fate or group consciousness (Dawson Reference Dawson1994; Miller et al. Reference Miller1981; Sanchez Reference Sanchez2006; Stokes Reference Stokes2003; Tate Reference Tate1994; Verba and Nie Reference Verba and Nie1978). This sense of connectedness, which partly emanates from perceptions of systemic injustice, encourages group members to become politically cohesive and active (Chong Reference Chong1991; Chong and Rogers Reference Chong and Rogers2005; Dawson Reference Dawson1994; Garcfa Bedolla Reference Garcia Bedolla2005; McAdam and Paulsen Reference McAdam and Paulsen1993; Walker Reference Walker2014). The historical experience of African-Americans is particularly illuminating. Even when highly distrustful of the political system, unfair and illegitimate government practices have motivated many to mobilize (Matthews and Prothro Reference Matthews and Prothro1966; Mcadam Reference Mcadam1982; Parker Reference Parker2009). Similarly, Latinos of different socioeconomic stripes have responded to hostile initiatives such as California’s proposition 187 with increased political activism (Barreto and Woods Reference Barreto and Woods2005; Garcia Bedolla Reference Garcia Bedolla2005; Pantoja, Ramirez, and Segura Reference Pantoja, Ramirez and Segura2001; Ramirez Reference Ramirez2013). Other groups, such as black, Asian and white immigrants (Ramakrishnan Reference Ramakrishnan2005), Arab-Americans (Cho, Gimpel, and Wu Reference Cho, Gimpel and Wu2006), and Muslim-Americans (Oskooii Reference Oskooii2016) have likewise displayed higher levels of political participation when confronted with systematic violations of equality and fairness.
While political scientists have demonstrated that individual-level behavior is partly shaped by the perception of politically threatening circumstances, less emphasis has been placed on how socially hostile contexts could also impact behavior. Consequently, it is not entirely clear how increased anxiety or a sense of deprived status motivates political participation, particularly in contexts in which individuals may face persistent peer stigmatization in the course of everyday life. Marcus, Neuman and MacKuen (Reference Marcus, Neuman and MacKuen2000) contend that some dose of anxiety is considered healthy or even necessary to motivate citizens, especially when the connection between the threatening stimuli and politics is obvious, but they also acknowledge that a shift in the direction of depression weakens one’s motivation to expend effort and undermines one’s confidence that political action will prove successful. This issue is, however, not directly addressed, leaving no clear indication of what circumstances turn moods too gloomy or when enthusiasm for action fades and confidence crumples. While PD can increase a person’s propensity to turn out and vote, individuals who are persistently exposed to SD may not perceive the same value in mainstream democratic activities.
Societal Discrimination and Disengagement
A review of the literature on discrimination and mental health problematizes the notion that discrimination serves as a mobilizing force. Epidemiological studies have shown that peer discrimination is strongly linked to a number of adverse mental health outcomes among numerous minority groups. The evidence is overwhelming: hundreds of studies link depleted self-esteem, feelings of hopelessness, powerlessness, sadness and depression to experiences with interpersonal discrimination (Gee et al. Reference Gee2009; Paradies Reference Paradies2006; Pascoe and Smart Richman Reference Pascoe and Smart Richman2009; Williams and Mohammed Reference Williams and Mohammed2009). Research further suggests that individuals who perceive discrimination by dominant group members tend to internalize negative evaluations and display low levels of self-esteem (Greene, Way, and Pahl Reference Greene, Way and Pahl2006; Leary et al. Reference Leary1995; Umana-Taylor and Updegraff Reference Umana-Taylor and Updegraff2007; Verkuyten Reference Verkuyten1998). Most importantly, the link between interpersonal discrimination and well-being has been found across multiple populations in different contexts, irrespective of some differences in measurement strategy (Almeida et al. Reference Almeida2009; Banks, Kohn-Wood, and Spencer Reference Banks, Kohn-Wood and Spencer2006; Finch, Kolody, and Vega Reference Finch, Kolody and Vega2000; Hodge, Zidan and Husain Reference Hodge, Zidan and Husain2015; Larson et al. Reference Larson2007; Mak and Nesdale Reference Mak and Nesdale2001; Noh et al. Reference Noh1999; Padela and Heisler Reference Padela and Heisler2010; Panchana-deswaran and Dawson Reference Panchana-deswaran and Dawson2010; Whitbeck et al. Reference Whitbeck2002).Footnote 3
In short, extant research suggests that peer stigmatization has the capacity to psychologically harm individuals, most commonly eliciting feelings of sadness and depression. The negative psychological outcomes attributed to experiences of SD challenges the notion that citizens tend to respond to unfair treatment with confrontation or resistance. If anything, feelings of sadness turn attention inward (that is, individuals focus on personal deservingness, failings or shortcomings) rather than outward (Stearns Reference Stearns1993), and have been associated with a perceived lack of control, passivity, withdrawal and reduced attention to external cues (Cunningham Reference Cunningham1988; Ellsworth and Smith Reference Ellsworth and Smith1988; Frijda, Kuipers, and Ter Schure Reference Frijda, Kuipers and Ter Schure1989). Furthermore, depressed individuals tend to be socially isolated (Rubin and Coplan Reference Rubin and Coplan2004), more withdrawn and less talkative (Ainsworth Reference Ainsworth2000). Under these circumstances, citizens may actually see little value in expending their limited time and resources on the political process. Indeed, recent research suggests that depression inhibits political participation (Ojeda Reference Ojeda2015; Ojeda and Pacheco Reference Ojeda and Pacheco2017).
Previous work further suggests that peer stigmatization can lead to depleted psychological well-being due to its adverse effect on one’s sense of belonging. Belongingness is considered a universal emotional need of people to be accepted by members of a group (Baumeister and Leary Reference Baumeister and Leary1995). According to Hagerty et al. (Reference Hagerty1992, 173), a sense of belonging is ‘the experience of personal involvement in a system or environment so that persons feel themselves to be an integral part of that system or environment’. It is the experience of ‘fitting in’ or being ‘valued’ or ‘needed’ with respect to other people, groups or environments. Establishing and maintaining relatedness to others is considered a pervasive human concern (Kohut Reference Kohut1977; Maslow Reference Maslow1954; Thoits Reference Thoits1982). As such, the nature and quality of a person’s relatedness to others can significantly promote or impair health and influence behavior (Anant Reference Anant1966; Anant Reference Anant1967; Anant Reference Anant1969; Baumeister and Leary Reference Baumeister and Leary1995; Hagerty and Patusky Reference Hagerty and Patusky1995; Hagerty et al. Reference Hagerty1992; Hagerty et al. Reference Hagerty1996).
Connecting research on belongingness to political behavior, it follows that individuals who do not feel that they are an integral part of the larger society, due to persistent experiences of interpersonal rejection, may not be as enthusiastic as their counterparts to expend their limited resources on mainstream political processes. Indeed, Garcia Bedolla’s (Reference Garcia Bedolla2005) analysis of the political attitudes and behaviors of two Latino communities in California underscores the importance of context by finding that Latinos in a community with stigmatized identities (Montebello) were much less likely to respond to the threat of Proposition 187 compared to Latinos in a community with positive ethnic identities (East Los Angeles). Similarly, Schildkraut (Reference Schildkraut2005) demonstrates that Latinos who reported receiving poor service at restaurants or stores, called names or insulted, and treated with less respect by others because of their race or ethnicity were much less likely to register and vote than those who did not encounter such discrimination. These findings suggest that socially devalued individuals may develop an inflated sense of pessimism and believe that they are incapable of taking meaningful action (Cunningham Reference Cunningham1987). Consequently, some may acquiesce to unjust social conditions and desist from advocating needed reforms because they assume that the majority of their peers disagree with them and that little can be gained from expressing their dissatisfaction (Miller and McFarland Reference Miller and McFarland1991).
Discrimination and In-group Engagement
When examining the relationship between discrimination and participation, distinguishing between ‘mainstream’ and ‘in-group’ or ‘ethnic-specific’ activities is also important. Mainstream channels of political influence tend to be dominated numerically in membership and leadership positions by the majority/dominant group, and often serve majority rather than minority interests (Strolovitch Reference Strolovitch2008). The lack of attention to and concern about minority-specific issues, whether explicitly or implicitly, differentiates mainstream institutions from ethnic-based or in-group institutions that pay more specific attention to issues that are important to lower-status groups (Wong Reference Wong2008). Perhaps not surprisingly, previous work has found that the perception of discrimination among Latinos promotes attendance of meetings or demonstrations based on Latino issues, though not necessarily participation in mainstream political activities (Sanchez Reference Sanchez2006). This suggests the need to differentiate between different types of activities.
While the theoretical position offered thus far is that SD may decrease the propensity to engage in mainstream activities such as voting, it is certainly possible that such experiences can bring similarly positioned individuals together. Social Identity Theory would expect that to be the case because individuals cope with the pain of rejection by increasing identification with their disadvantaged group members (Tajfel and Turner Reference Tajfel and Turner1986). Research further suggests that individuals who face out-group hostility seek out their group members to fulfill a strong desire for acceptance and belonging that has been undermined by experiences of peer rejection (Branscombe, Schmitt, and Harvey Reference Branscombe, Schmitt and Harvey1999). Similar to SD, perceptions of PD may likewise motivate individuals to gravitate toward ethnic-based community organizations because they are more likely to pay significant attention to the needs of the group. In-group organizations can also be a valuable place to not only talk about salient political issues, but to help group members effectively organize against the challenges that their group faces (Calhoun-Brown Reference Calhoun-Brown1996; McDaniel Reference McDaniel2008; Putnam Reference Putnam2000; Verba et al. Reference Verba1995; Wald and Calhoun-Brown Reference Wald and Calhoun-Brown2014). Considering these dynamics, overarching participation scales that combine traditional measures of political engagement with ethnic-specific or in-group activities may further muddle the relationship between discrimination and political behavior.
Expectations
When faced with systematic injustice, various minority groups have displayed higher levels of political activism. PD may facilitate increased political engagement because it presents violations of democratic norms of equality and fairness, and a potential threat to a group’s political, cultural, or economic status or opportunities. Stated differently, PD serves as an ‘intrusive stimuli’ that aligns political focus (Marcus, Neuman, and MacKuen Reference Marcus, Neuman and MacKuen2000) and facilitates the development of a collective orientation toward politics (Garcia Reference Garcia2011, Reference Garcia2000; Miller et al. Reference Miller1981; Sanchez Reference Sanchez2006). This collective orientation makes individuals more receptive to appeals of collective action, bolsters group pride and efficacy, and can shield citizens from placing blame on personal shortcomings (Chong and Rogers Reference Chong and Rogers2005; Miller et al. Reference Miller1981; Welch and Foster Reference Welch and Foster1992). This argument generates the following hypothesis regarding the behavioral consequences of perceived PD:
Hypothesis 1: On average, exposure to political discrimination increases the likelihood of political participation.
In contrast to PD, peer discrimination is an extremely unpleasant and stressful experience of personal rejection that can severely undermine one’s sense of belonging to the greater polity (Baumeister and Leary Reference Baumeister and Leary1995; Hagerty et al. Reference Hagerty1992). Whether one is intentionally ignored while waiting to be served at a restaurant or disrespected on the way to work, the accumulation of such negative interpersonal experiences can damage self-esteem, undermine self-worth, and leave individuals feeling depressed and pessimistic. If individuals do not feel valued and respected by others, they may become indifferent to or disheartened by the democratic process, and believe that they cannot effectively advocate for needed reforms through mainstream channels of political influence (Cunningham Reference Cunningham1987; Garcia Bedolla Reference Garcia Bedolla2005; Jost Reference Jost1995). Indeed, prior research has shown that among various political outlooks, the belief that one’s actions can have a consequential impact on political outcomes is a particularly important factor shaping political involvement (Abramson and Aldrich Reference Abramson and Aldrich1982; Almond and Verba Reference Almond and Verba1963; Guterbock and London Reference Guterbock and London1983; McCluskey et al. Reference McCluskey2004; Michelson Reference Michelson2000; Rosenstone and Hansen Reference Rosenstone and Hansen1993). This argument generates the following hypothesis regarding the behavioral consequences of perceived SD:
Hypothesis 2: On average, exposure to societal discrimination decreases the likelihood of (mainstream) political participation.
Although societally stigmatized individuals may not see much value in partaking in elections or volunteering in campaigns, it does not mean that they are completely alienated or withdrawn. Discrimination by dominant group members (for example, whites) can increase identification and engagement with in-group members for the purposes of seeking acceptance and reaffirmation (Branscombe, Schmitt, and Harvey Reference Branscombe, Schmitt and Harvey1999; Tajfel and Turner Reference Wald and Calhoun-Brown2001). Individuals exposed to PD may likewise seek out fellow in-group members and partake in ethnic-based associations because such organizations can serve as a welcoming environment to not only talk about salient group issues, but also to effectively organize against systemic injustices. This argument generates the following hypotheses regarding the impact of SD and PD on in-group identification and engagement:
Hypothesis 3: Exposure to societal discrimination, on average, enhances in-group attachment and engagement.
Hypothesis 4: Exposure to political discrimination, on average, enhances in-group attachment and engagement.
Data and Measures
Political scientists may be discouraged by the barriers to studying how discrimination impacts marginalized populations because surveys rarely contain specific discrimination measures. The 2010 Ethnic Minority British Election Study (EMBES) is an exception. EMBES is the most recent and comprehensive survey of ethnic minority adults in the UK. It was administered face to face by computer-assisted personal interviewers and was supplemented by a follow-up mail-back questionnaire in English.Footnote 4 While the dataset is comprised of a number of core questions taken from the British Election Study (BES), the sample design differs considerably from the BES in that it focuses exclusively on the five biggest ethnic minority groups in Britain: black Caribbean, black African, Indian, Pakistani and Bangladeshi. Each ethnic minority group represents roughly 20 per cent of the total sample with the exception of Bangladeshi participants, who only comprise 10 per cent of the total sample given that they are the smallest group of the five.
While the EMBES yielded a high response rate of 58 per cent, with estimated coverage levels of 85–90 per cent for each group, it is limited in that the vast majority of the respondents completed the survey in English.Footnote 5 Only 9 per cent of the respondents took the survey in a different language, which suggests that individuals not proficient in English may have had a lower probability of completing the survey. Aside from this limitation, however, the EMBES is a suitable dataset with which to test the proposed research hypotheses because it contains a number of detailed questions about discrimination and political behavior. Furthermore, its questions regarding discrimination are multi-layered, enabling social scientists to measure not just the presence of racial or ethnic discrimination, but also frequency levels in different domains. Participants were first asked to identify whether they have ‘Experienced discrimination or been treated unfairly by others in the UK’ because of their ethnicity, race or skin color in the past 5 years. Respondents who indicated ‘yes’ were then asked ‘how often’ they have experienced such discrimination or unfair treatment in Britain (none, rarely, sometimes, often). This question format is advantageous because it enables researchers to take into consideration both the occurrence and rate of ethnic or racial discrimination, providing more nuance and variation.
The last and most important layer focuses on the source of discrimination: who discriminated against the subject (and where). Three questions most closely resemble experiences of SD. Respondents were asked whether they have experienced unfair treatment (1) on the street, (2) in a shop, bank, restaurant or bar, or (3) at social gatherings.Footnote 6 These items were combined to create an additive scale that ranges from 0 (no discrimination) to 9 (a great deal of societal discrimination).Footnote 7 About 80 per cent of the respondents indicated that they did not experience discrimination in any of the three domains, while 20 per cent had experienced at least some racial or ethnic discrimination.Footnote 8 Of the three statements, street discrimination is the most obvious example of SD as well as the most prevalent type of discrimination reported by the participants.
Four questions were utilized to capture respondents’ experiences with PD. Participants were asked whether they have encountered discrimination (1) when dealing with immigration or other government offices or officials, (2) when dealing with the police or courts, or (3) in domains such colleges or universities or (4) when applying for a job or promotion. The PD scale ranges from 0 to 12; 81 per cent of participants reported not having experienced any PD.Footnote 9 The preceding questions most closely, but not perfectly, fit the concept of PD, which is defined as systematic, institutional or structural exposure to unfair treatment. Rather than experiencing peer discrimination on the street, individuals were targeted by the government, its actors or organizations that are expected, at least theoretically, to abide by the laws and principles of equal treatment.
Arguably, the education and job market questions are not precise enough to ascertain, without reservation, that they neatly fit into the construct of PD. Contextual information is therefore needed to make the case that both issues are most likely perceived as systematic or institutional problems. An examination of the UK’s political context suggests that inequality in both areas has gained considerable political saliency over the last 15 years. The Labour Party has made numerous efforts to recognize and alleviate differential treatment and outcomes in higher education and the labor market (Heath et al. Reference Heath2013). In 2001, its manifesto promised to tackle work discrimination so that ‘ […] all the people can make the most of their talents’ (Heath et al. Reference Heath2013, 101). Between 2005 and 2010, the Labour Party made specific recommendations to the prime minister to tackle education and promotion inequalities, and the Liberal Democrats proposed combating discrimination with the all-inclusive Equality Act. This act was adopted under the Labour government of Tony Blair, and again in 2010 under Gordon Brown. As such, inequalities in higher education and the labor market have become central political issues that major political parties have paid significant attention to and minority groups have recognized and mobilized around (Heath et al. Reference Heath2013).Footnote 10 Given this context, the operationalization of both items as PD is reasonable despite shortcomings in question wording. Additional analysis with more specific measures of PD (only government/police discrimination) and SD (only street discrimination) were also conducted (see Online Appendix Tables 5 and 6). These results support the main findings regarding the divergent impacts of perceived discrimination on voting.
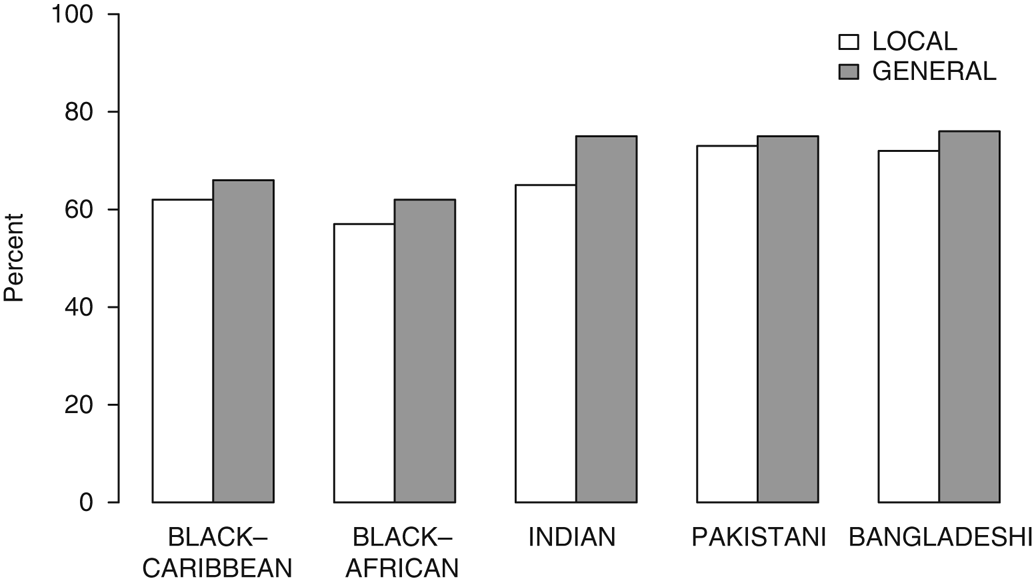
The EMBES dataset contains two questions that can be used to test the impact of PD and SD on engagement in mainstream politics. Respondents were asked if they voted (coded as 1) or not (0) in the 2010 local and general elections. About 64 per cent of all eligible voters (citizens, dual citizens and Commonwealth citizens) voted in the local election and 69 per cent voted in the general election. Both elections were held on 6 May, but not all places in the UK held a local election. Figure 2 presents the rates of self-reported voting by election type and ethnic group classification using original survey weights for each within-group comparison. A glance at the bivariate statistics shows that East Asian participants reported higher rates of turnout than black-Caribbean and black-African respondents. However, an in-depth analysis of the EMBES illustrates that the political attitudes and behaviors of Britain’s ethnic minority citizens are fairly uniform, and that there are more commonalities between them when compared to the majority white population (Heath et al. Reference Heath2013; Sanders et al. Reference Sanders2014).Footnote 11 For instance, issues of immigration, equal opportunity and fair treatment are very important to all the groups regardless of class or other socioeconomic interests (Heath et al. Reference Heath2013). Due to these commonalities, British electoral studies and public opinion surveys have demonstrated since as early as the 1980s that minorities express much higher levels of support for the Labour Party than white Brits (Anwar Reference Anwar1980; Anwar Reference Anwar1984; Anwar Reference Anwar1998; Anwar Reference Anwar2001; Amin and Richardson Reference Amin and Richardson1992; Heath et al. Reference Heath2013).
EMBES electoral participation rates by ethnicity.

In addition to questions about turnout, two questions were selected to assess the impact of discrimination on in-group attachment and engagement. In-group identification is measured with the following question: ‘Some people think of themselves first as British. Others may think of themselves first as (black/Asian). Which best describes how you think of yourself?’ About 17 per cent of the sample identified as mostly or exclusively British, half of the respondents (50 per cent) identified as equally black/Asian and British, and about one-third (33 per cent) selected black/Asian. This variable is scored from 1 to 3 with the highest value representing moderate or strong national British identity. As for ethnic-specific engagement, respondents were asked to indicate whether they have taken part in the activities of an ‘ethnic or cultural association or club in the past 12 months’. About 30 per cent of the respondents indicated taking part in such activities.
Findings: Mainstream Political Behavior
An examination of discrimination and political behavior needs to account for possible confounding factors. To limit the issue of omitted variable bias and to isolate the impact of SD and PD on each outcome variable, a number of theoretically relevant covariates of participation and perceived discrimination were taken into consideration while keeping the models reasonably parsimonious (a description of all the model controls is provided in the online appendix along with summary statistics). I first examine the relationship between discrimination and electoral engagement. The purpose of this section is twofold: (1) to test Hypotheses 1 and 2 and (2) to demonstrate that broad discrimination measures potentially produce different outcomes than more specific measures that take the source of discrimination into account. Recall that Hypothesis 1 suggests that the perception of PD may motivate individuals to take action against systematic violations of equality and fairness. In contrast, Hypothesis 2 suggests that SD reduces the likelihood of electoral engagement. To test these hypotheses, four logistic regression models per election (local and general) were estimated.Footnote 12
In the first model, racial and ethnic discrimination is operationalized by utilizing the first discrimination question available in the EMBES dataset, which asked individuals to report whether they have experienced discrimination on the basis of race, ethnicity or skin color.Footnote 13 This variable, which ranges from 0–1, is referred to as the ‘Broad Disc I’ measure because it cannot be determined what the respondent was thinking about at the time that he/she answered the question. Some participants could have recalled a negative interpersonal experience on the street, while others could have recalled an experience of police bias. Furthermore, this measure is limited in that it does not provide any additional information about the frequency of experienced discrimination. The second measure of discrimination (‘Broad Disc II’) is an ordinal variable that ranges from 0–3. This variable introduces more variation because respondents were asked to report ‘how often’ they have experienced discrimination. However, this measure is still broad in that no additional information about the source of mistreatment can be identified. In contrast, the key measures – SD and PD – are more multidimensional in that both the rate and specific source of discrimination are considered.
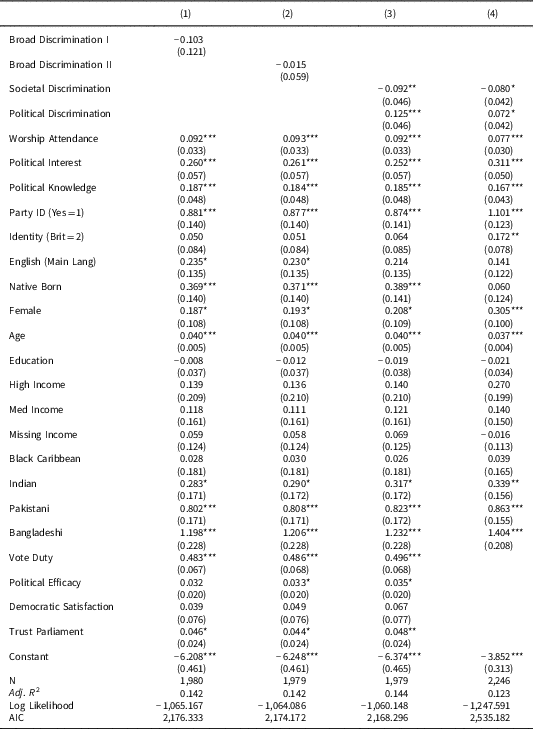
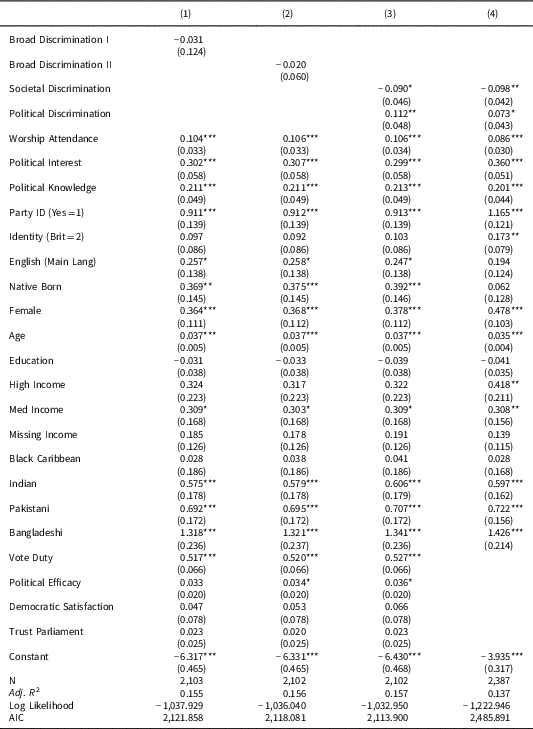
The analysis begins by evaluating turnout in the 2010 local election. I use a three-step approach to assess the impact of discrimination on turnout. All three models reported in Table 1 are identical, with the exception of the discrimination variables, which change with each subsequent model. Since the substantive impact of the explanatory variables on reported voting cannot easily be identified by simply looking at the reported logistic regression coefficients, changes in predicted probabilities were plotted to aid in the interpretation of the results. Using a standard simulation technique known as first-difference, predicted probabilities were calculated by changing the explanatory variables from minimum to maximum values while holding all other covariates at their respective means.
The impact of discrimination on turnout in the 2010 local election

Note: logistic regression (two-tailed test); standard errors in parentheses. *p<0.l; **p<0.05; ***p<0.01
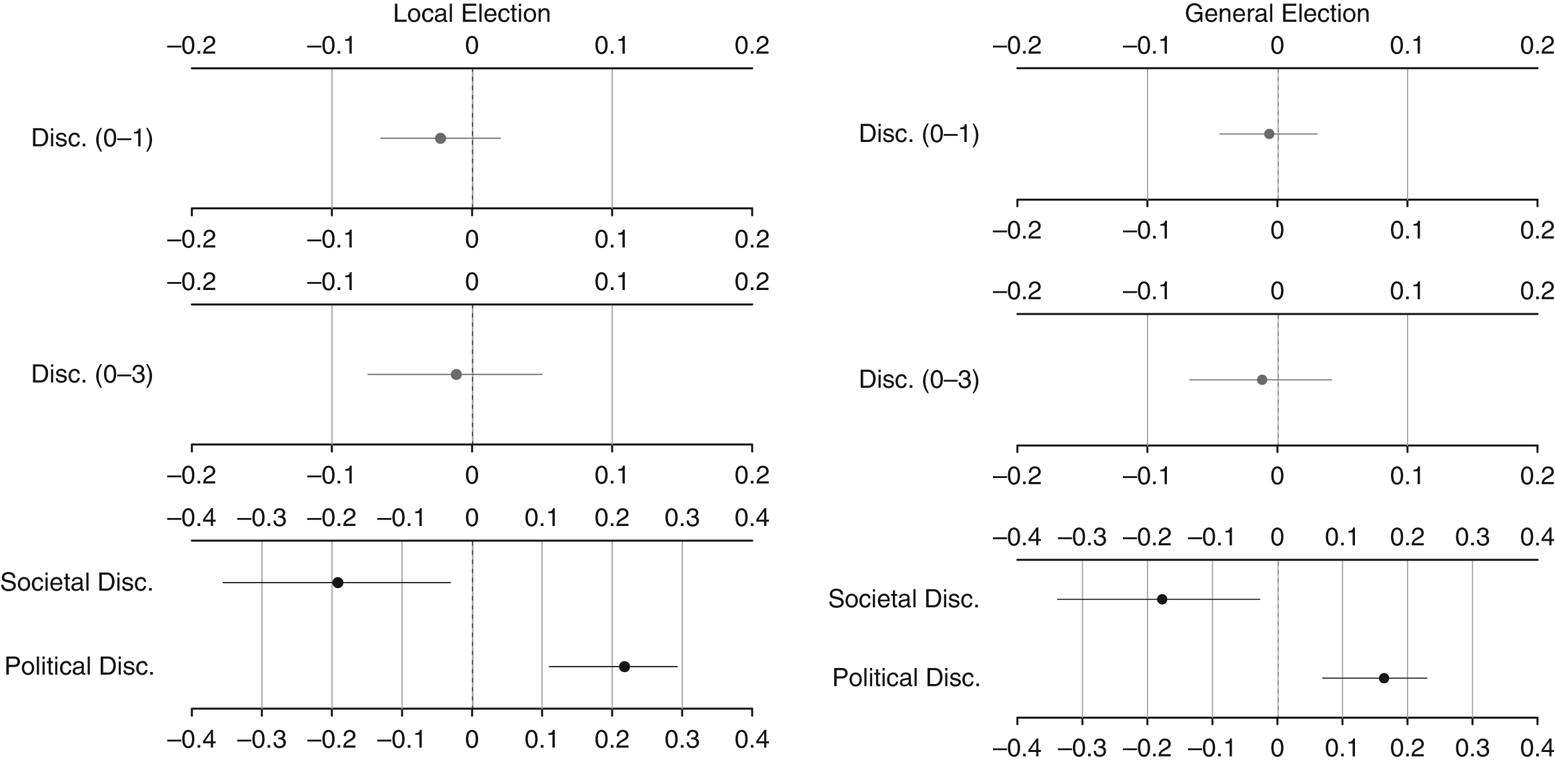
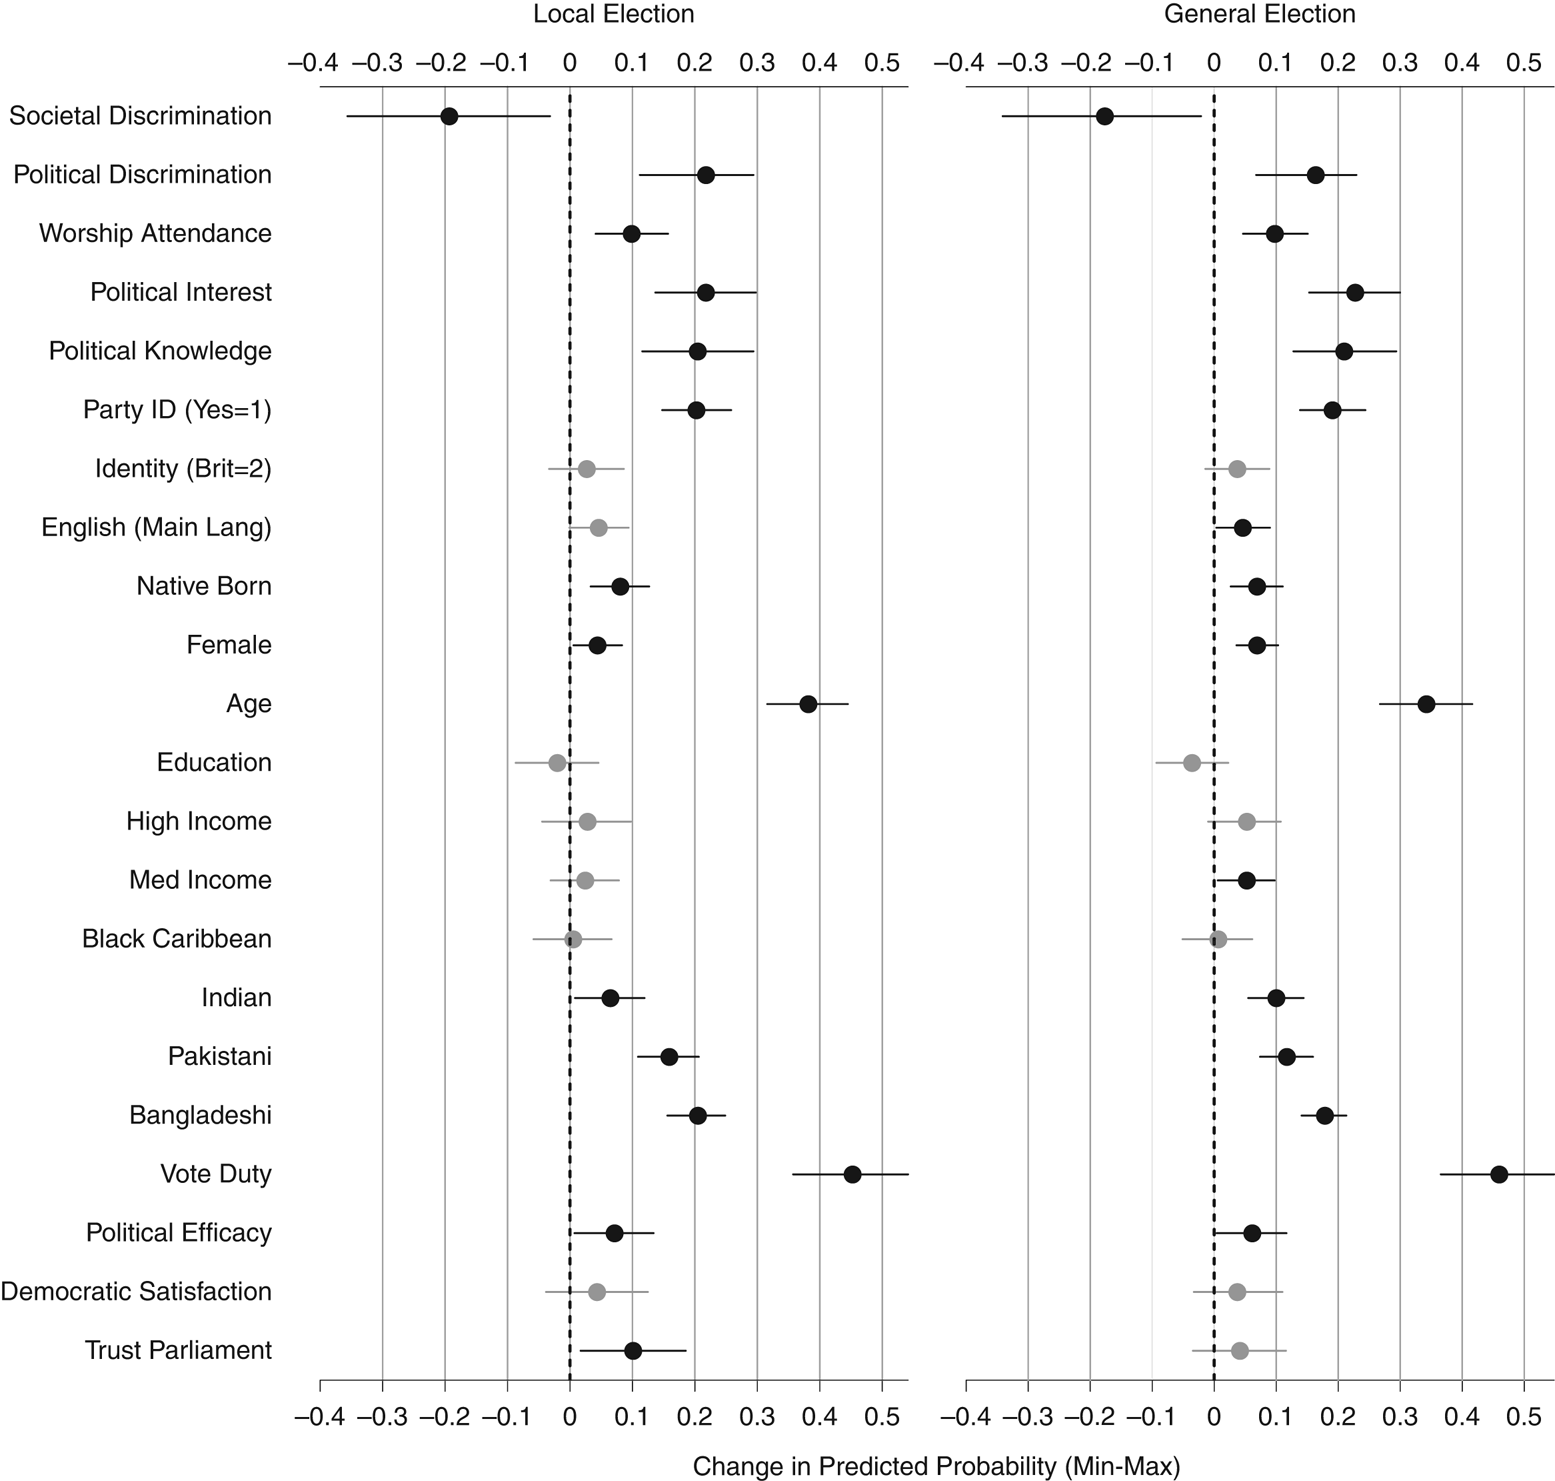
The left panel of Figure 3 displays the local election post-estimation results, beginning with the first discrimination variable. The broad, dichotomous discrimination variable did not have a discernible impact on reported voting in the local election. Similarly, the second (ordinal, but also broad) discrimination variable had no substantive or statistically significant impact on the outcome variable. If the analysis were to end without any further examination of the source of discrimination, one could conclude that discrimination is not a predictor of turnout. However, taking the next step and disentangling discrimination by source reveals a different result. Respondents who reported experiencing high levels of SD were about 19 percentage points less likely than those who did not experience any discrimination to report that they voted in the 2010 local election. Conversely, individuals exposed to PD were more likely to vote than those who did not experience any discrimination – a 22-point increase in probability. In addition to the substantive results, goodness-of-fit statistics suggest endorsing Model 3 over Models 1 and 2 (see Table 1). The Akaike Information Criterion (AIC) values, which assess the relative quality of the models, suggest that the societal and political discrimination model is superior to the broad discrimination models.
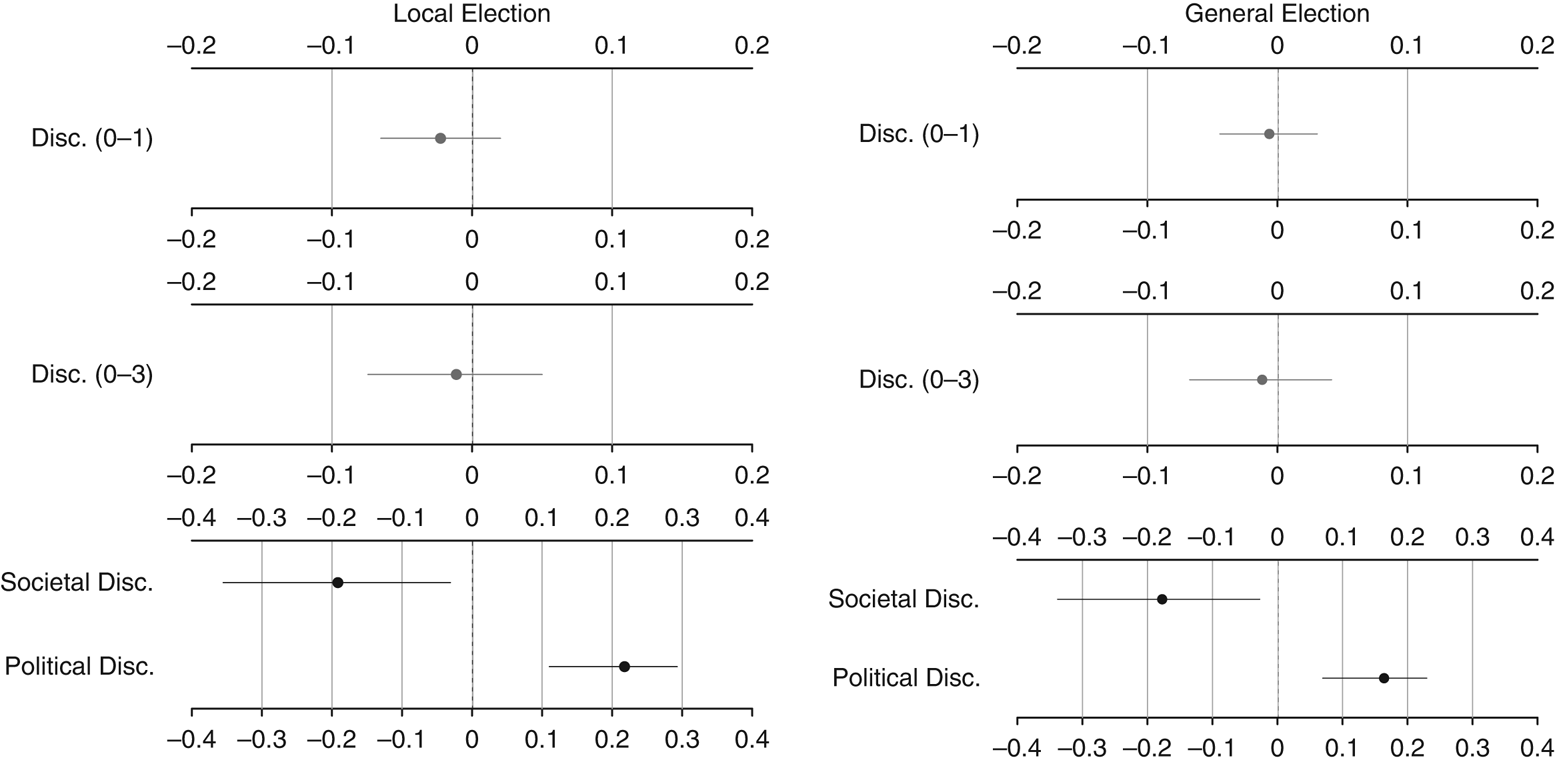
Since local elections were not held in every electoral jurisdiction in the UK, the next set of models reported in Table 2 assesses the impact of discrimination on turnout in the general election. This analysis provides additional support for Hypotheses 1 and 2. Again, the broad discrimination measures are not statistically associated with voting, and the substantive relationship is nearly zero as shown in the right-hand panel of Figure 3. However, specific measures of discrimination appear to have meaningfully impacted the likelihood of turnout. Keeping all the model covariates at their respective means, SD reduced the likelihood of turnout in the general election by 18 percentage points, while PD increased the probability of voting by nearly 17 percentage points.
The impact of discrimination on turnout in the 2010 general election

Note: logistic regression (two-tailed test); standard errors in parentheses. *p<0.l; **p<0.05; ***p<0.01
Predictors of voting in the 2010 local and general elections. Note: symbols indicate the changes in the predicted probability of voter turnout. The lines attached to the symbols represent 90 per cent confidence bands. Estimated effects were obtained from Table 1, Model 3 (Local Election) and Table 2, Model 3 (General Election).
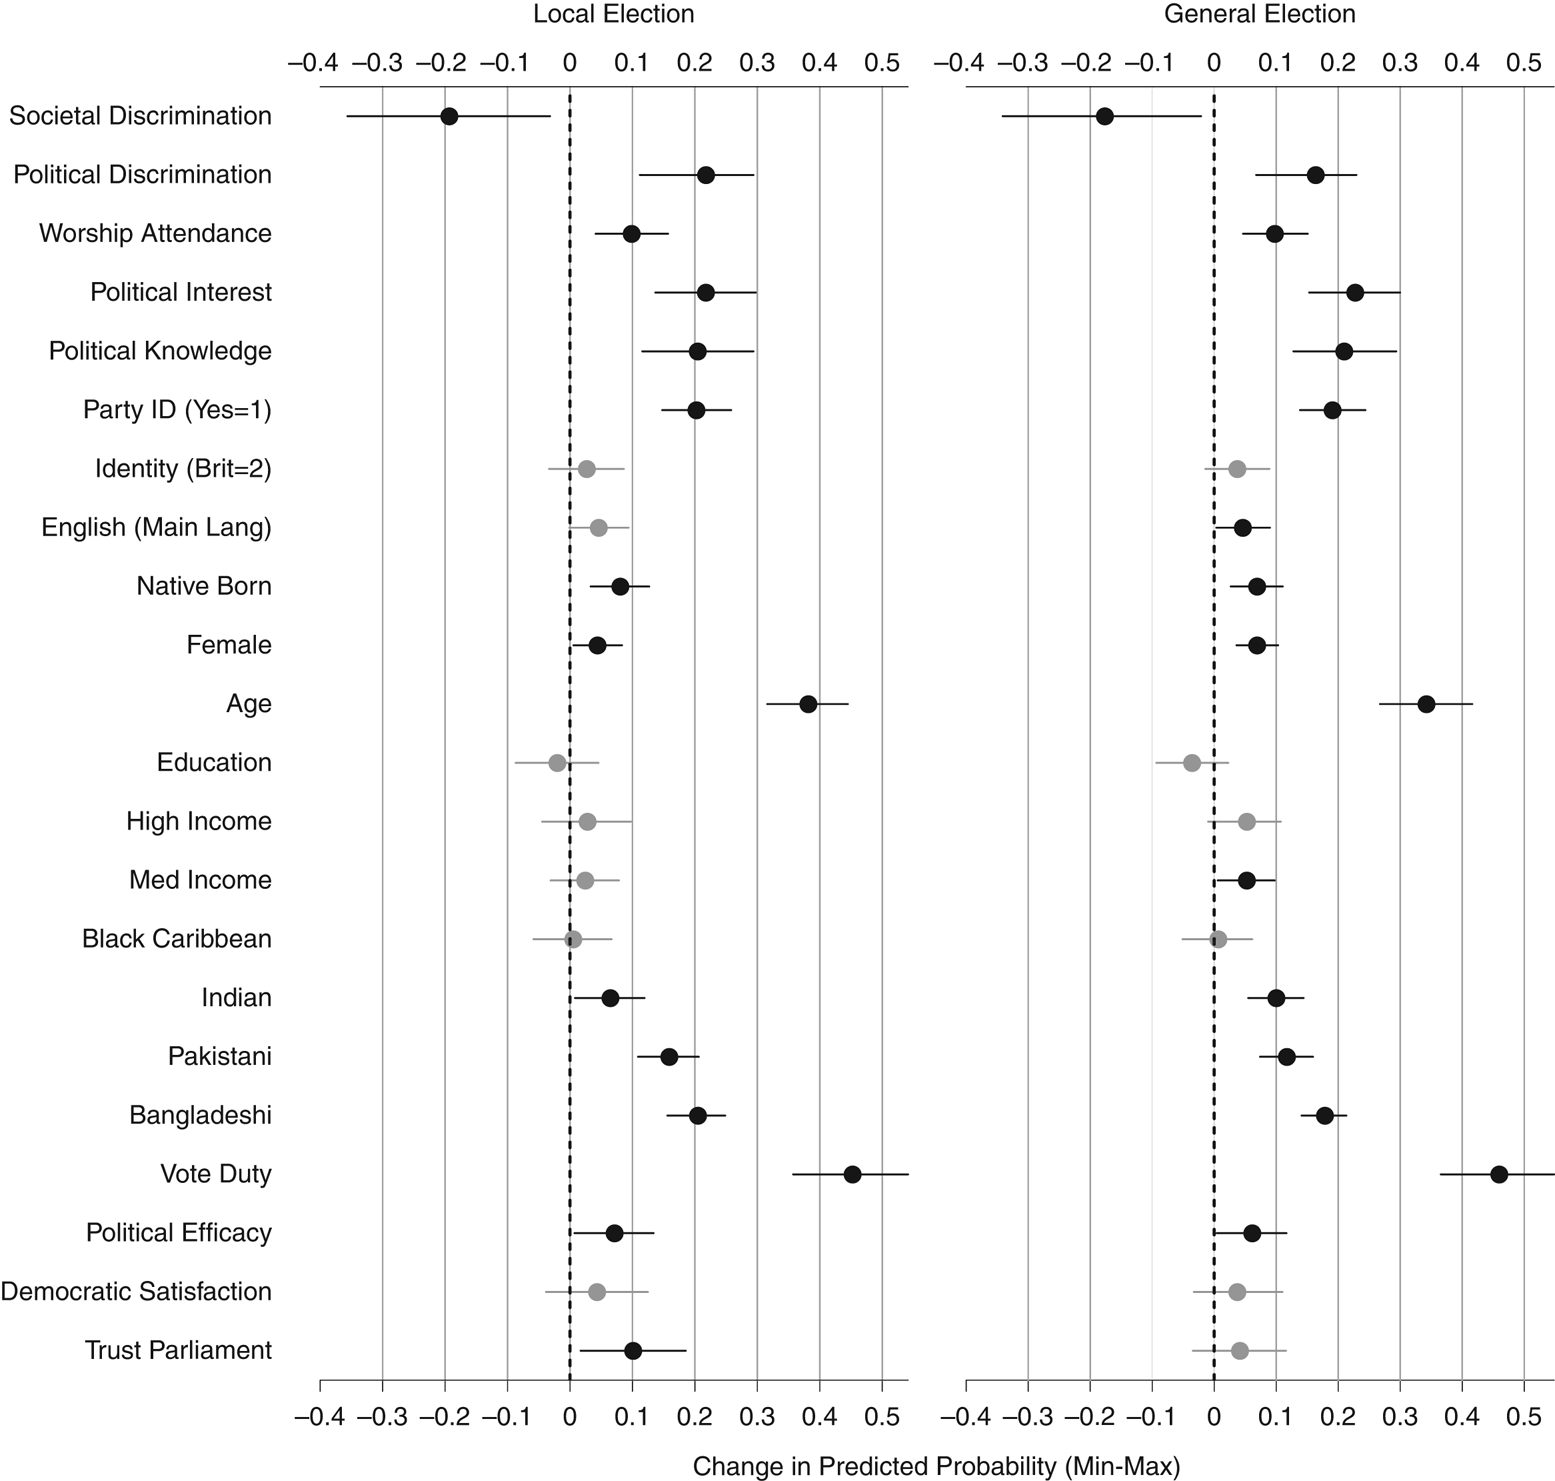
As the preceding analyses demonstrate, discrimination appears to be a meaningful predictor of turnout given that more attention is paid to the source of bias. To examine how the key discrimination measures fare in comparison to the other explanatory variables, Figure 4 displays the direction and substantive impact of every variable in the two fully specified voting models. Other than a sense of civic duty and age, PD and SD had as large of an impact on turnout as other theoretically relevant predictors of voting. For instance, the impact of both discrimination measures on voting was comparable to that of political interest, political knowledge and party attachment. Additional indicators, such as worship attendance, political efficacy and nativity, were also associated with voting, but their relative impact on turnout was considerably smaller. The analysis also reveals several interesting results. First, women, independent of ethnicity and socioeconomic status, were 4 to 6 percentage points more likely than men to vote in both elections. Ethnic group differences also emerged in the fully specified models. Keeping all the model covariates at their respective means, East Asian respondents were more likely than black respondents to indicate having voted.
Findings: In-group Attachment and Ethnic-based Engagement
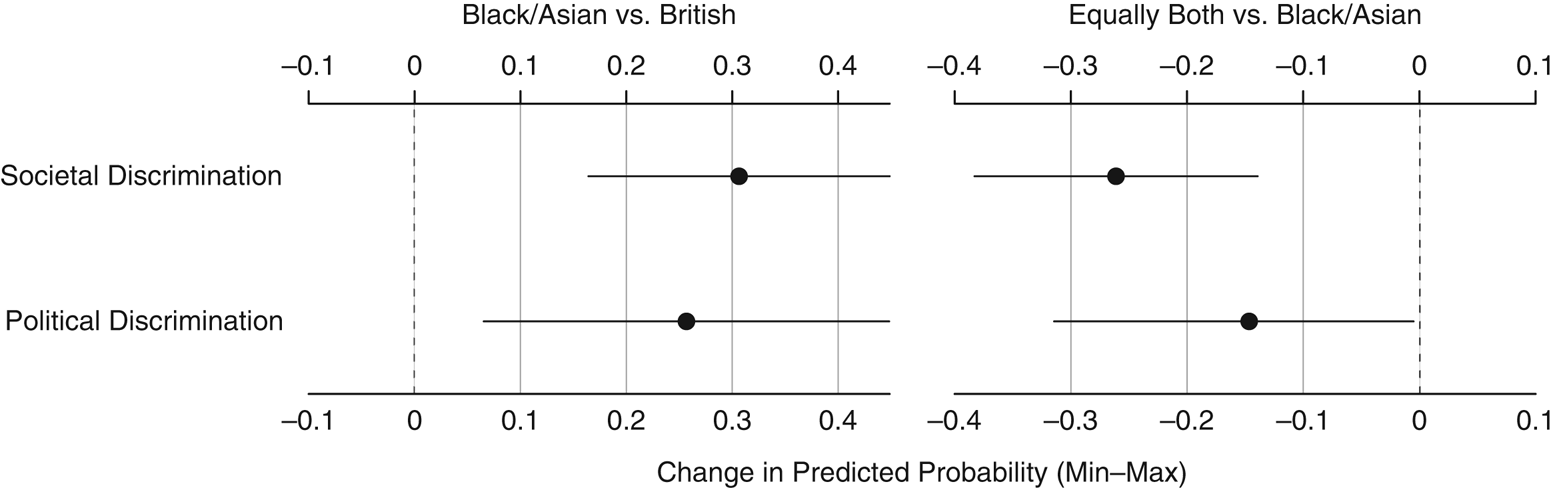
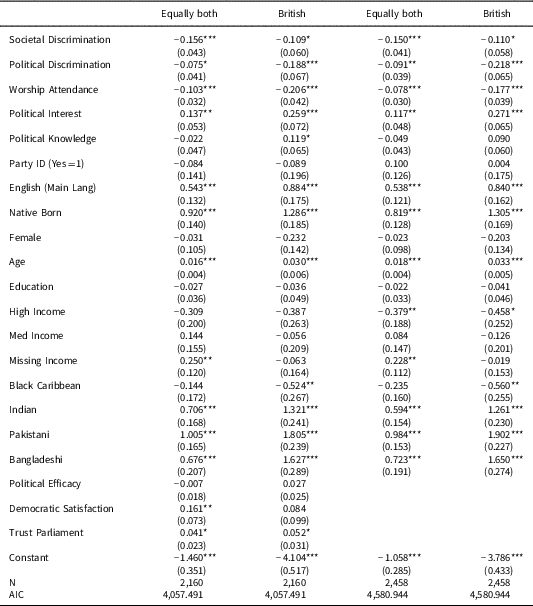
Hypotheses 3 and 4 propose that both SD and PD are likely to increase in-group identification and engagement. To test the first proposition, the following identity question was utilized as the outcome variable: whether respondents consider themselves first as ‘black/Asian or British’. The choice of identifying as ‘equally both’ was also available, which serves as the neutral option.Footnote 14Table 3 reports the results of the multinomial logistic regression models. For ease of interpretation, Figure 5 displays simulated first-difference results and calculated confidence bands for both key explanatory variables. The results provide support for the proposition that discrimination, regardless of source, is linked to increased in-group attachment. Keeping all other variables at their respective means, individuals exposed to societal discrimination were about 30 percentage points more likely than their counterparts to first identify as black/Asian rather than as British. Furthermore, such individuals were about 27 percentage points less likely to identify as ‘equally both’ relative to black/Asian. Exposure to PD was also statistically associated with identity choice, moving individuals towards an ethnic or racial identity and away from a British national identity. Specifically, PD increased the likelihood of identifying first as black/Asian rather than British by 25 percentage points. PD also reduced the likelihood of identifying as ‘equally both’ compared to black/Asian by about 15 percentage points.
The relationship between discrimination and identity. Note: symbols indicate the changes in the predicted probability of identity choice. The lines attached to the symbols represent 90 per cent confidence bands. Estimated effects were obtained from the fully specified models in Table 3.

The impact of discrimination on identity choice

Note: multinomial logistic regression; standard errors in parentheses. *p<0.1; **p<0.05; ***p<0.01
One concern with the identity choice model is the issue of endogeneity. It is entirely possible that some individuals, who identify strongly as black/Asian in the first place, may be more cognizant of or sensitive to issues of discrimination and thus report experiencing discrimination at a higher rate than those who identify as British. As such, the identity model results need to be taken into consideration with this important caveat in mind. Furthermore, it is important to note that individuals possess multiple identities and use them instrumentally in different contexts (Chandra Reference Chandra2006; Garcia-Rios Reference Garcia-Rios2015; Posner Reference Posner2004; Roccas and Brewer Reference Roccas and Brewer2002). Thus, the results suggest that when ethnic or racial distinctions are made salient due to discrimination, individuals may be more likely to enhance identification with their stigmatized identity in certain contexts rather than completely forgoing other attachments such as those based on nationality – that is, British.
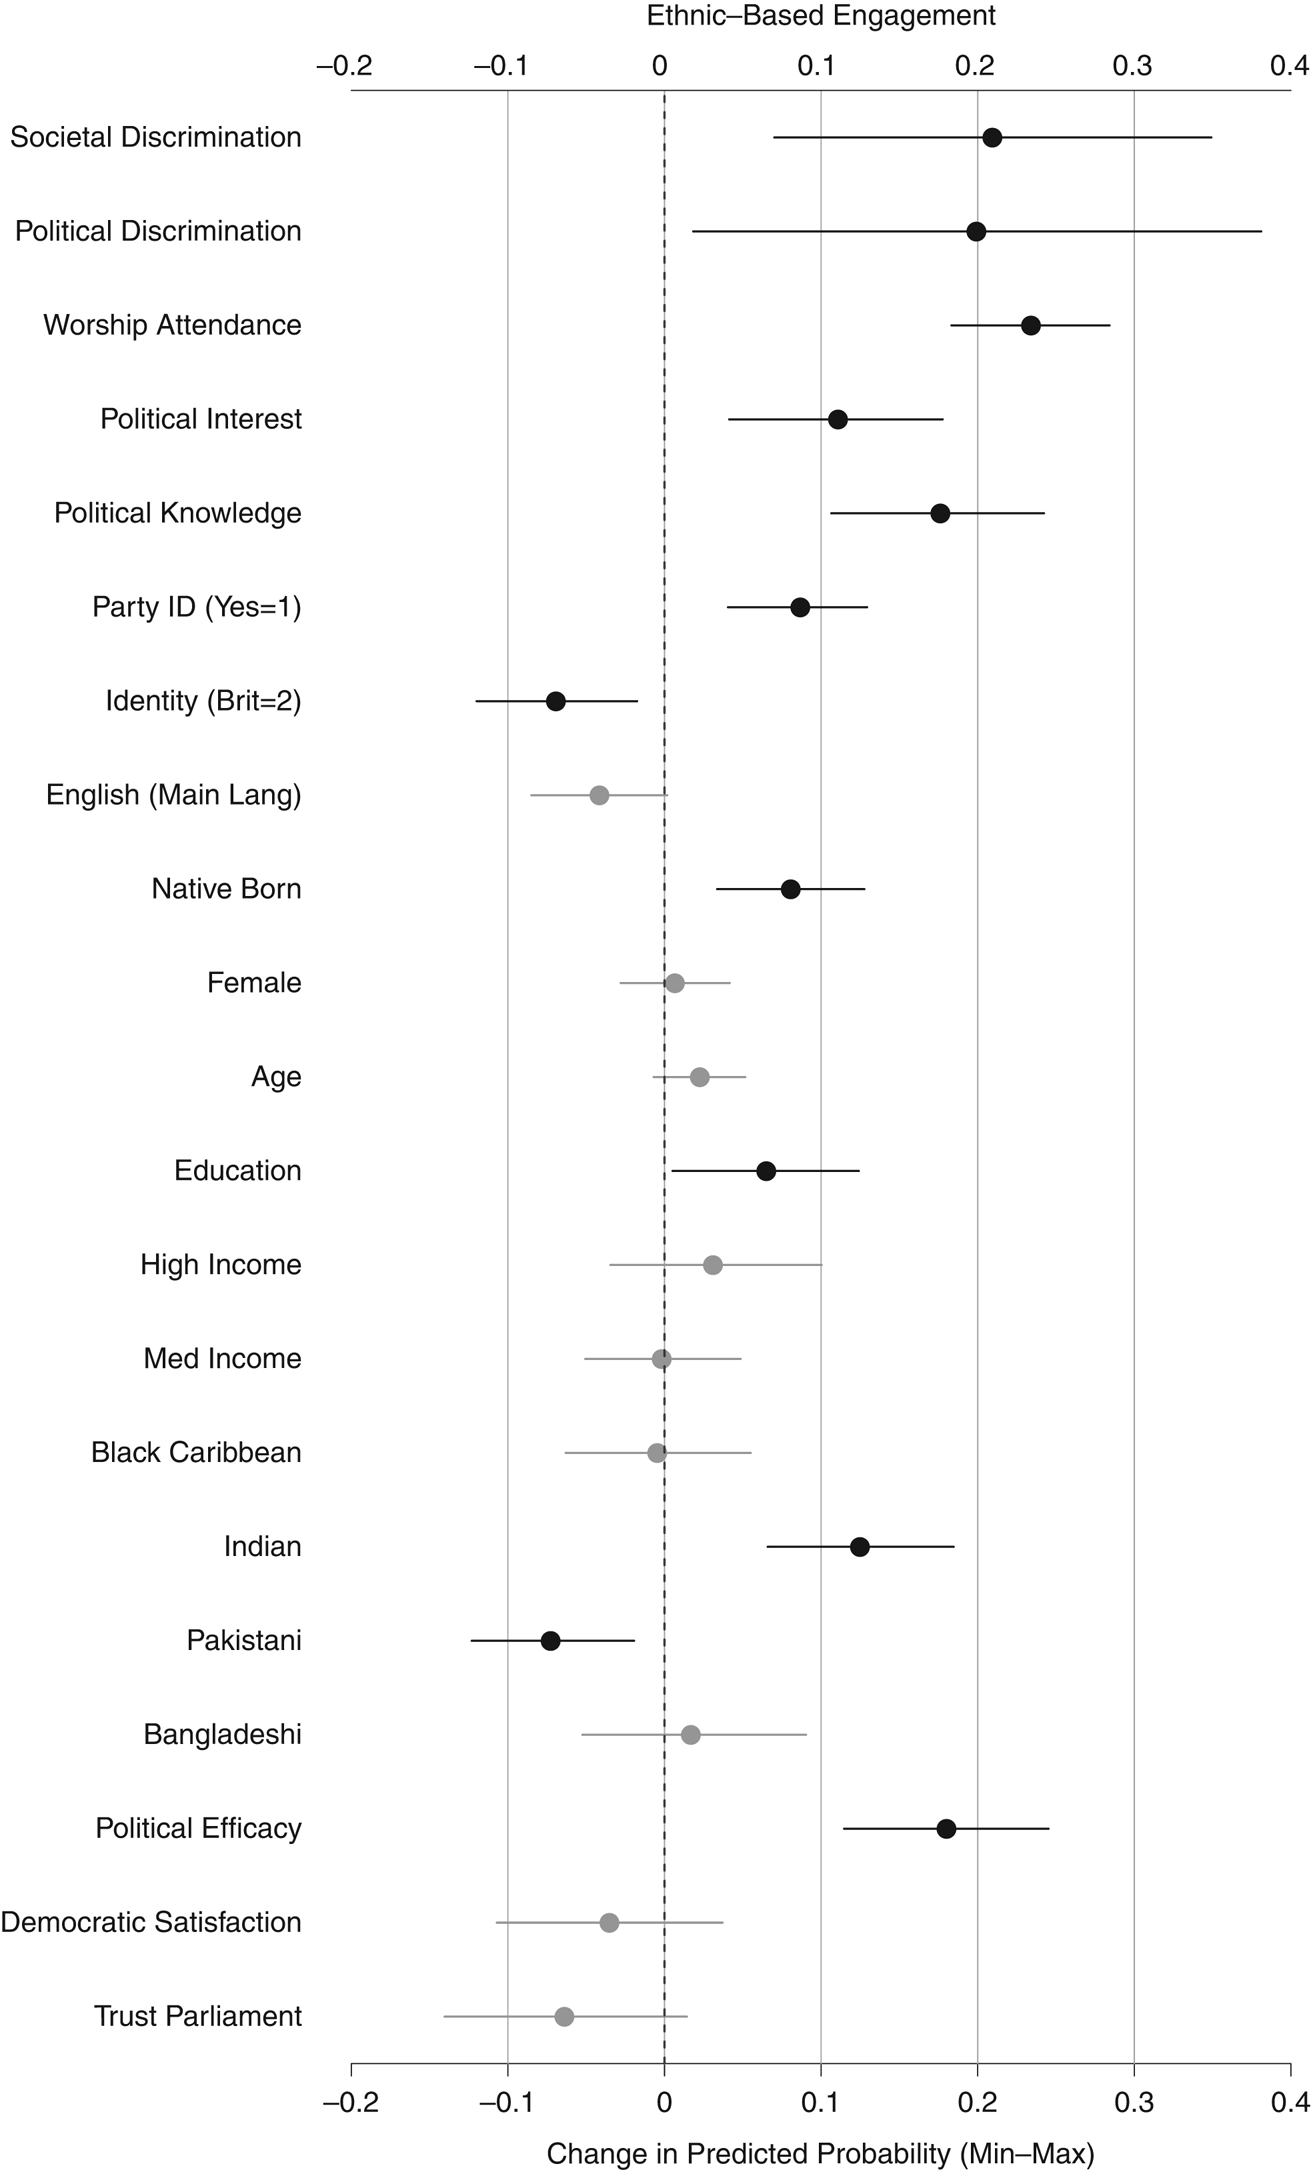
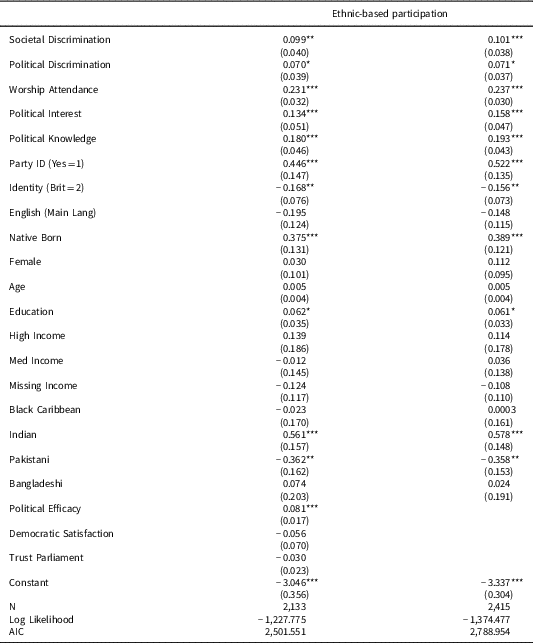
Having discussed the potential role of discrimination on identity choice, the next model examines the propensity of in-group engagement, given experiences with SD and PD. Hypothesis 4 proposes that peer stigmatization is likely to promote in-group engagement because ethnic-based organizations can provide a safe and welcoming environment for individuals to cope with the pain of out-group rejection. Such organizations may also attract individuals who perceive systematic, group-oriented marginalization because ethnic-based associations can provide a space for individuals to discuss and organize around salient group issues. To test these claims, participation in an ethnic or cultural association or club was regressed on SD and PD as well as a host of control variables. Table 4 presents logistic regression model results since the outcome variable is dichotomous (0–1). As Figure 6 illustrates, both discrimination variables are positively associated with participation in activities of an ethnic or cultural association or club. Individuals who experienced high levels of SD were about 21 percentage points more likely than those who did not experience any discrimination to take part in ethnic activities. Likewise, PD increased the likelihood of in-group engagement by about 20 percentage points. These effects are quite large compared to the other explanatory variables in the model. Discrimination had a similar impact on ethnic-based engagement as worship attendance, political knowledge and efficacy, and had a much larger impact than variables such as political interest, nativity and education. Identity was also a statistically significant predictor of in-group engagement: those who predominantly identified as British as opposed to black/Asian displayed a lower likelihood of partaking in ethnic associations or clubs.
The relationship between discrimination and ethnic-based engagement. Note: symbols indicate the changes in the predicted probability of participating in an ethnic association or club. The lines attached to the symbols represent 90 per cent confidence bands. Estimated effects were obtained from the fully specified model in Table 4.

The impact of discrimination on ethnic-based engagement

Note: logistic regression (two-tailed test); standard errors in parentheses. *p<0.l; **p<0.05; ***p<0.01
Conclusion, Limitations and Future Direction
While previous political science research has expanded the scholarly understanding of discrimination and political behavior, it has primarily relied on global discrimination measures or focused solely on how certain policies, laws or institutional arrangements impact marginalized populations. As such, it is still not entirely clear the extent to which different perceptions of discrimination may mobilize or demobilize individuals.
This study expands the scope of how perceived discrimination is conceptualized and measured, and contends that discrimination is a multidimensional concept that is not solely bound to structural or institutional domains of decision making. More specifically, the analysis underscored the importance of disentangling discrimination by source. Consistent with prior research on political threat and minority politics, the results illustrated that a heightened perception of PD is positively associated with voting behavior. In contrast, SD reduced the likelihood of voting in both local and general elections. The results further demonstrated that these findings would have been masked if broad discrimination measures were used.
In addition to the link between discrimination and voting, the analysis revealed that differentiating between ‘in-group’ and ‘mainstream’ activities is also important. While societally stigmatized individuals were less likely to vote, they were more likely than their counterparts to partake in ethnic-based associations or clubs. Consistent with the outlined theory, perceptions of PD also increased the probability of engagement in ethnic-based activities. Thus, perceptions of SD and PD do not always lead to different behavioral outcomes.
Finally, the results demonstrated that discrimination, regardless of the source, promotes the adoption of ethnic identities rather than a unifying national British identity. To be clear, this does not suggest that a racial identity alienates minorities from British politics. Results from the voting models did not provide any evidence that those who predominately identified as black/Asian were less engaged than those who identified as British. However, research has demonstrated that distinctive identities, especially due to experiences of marginalization, could shape policy preferences, party support and vote choice (Heath et al. Reference Heath2013).
While the present article offers a more theoretically and empirically refined portrait of discrimination and political behavior, it is by no means the last word on this topic. There are a number of limitations and interesting questions that future research needs to address. To start, research on discrimination needs to be extended to other marginalized groups such as members of the LGBTQ community. While the proposed theoretical framework focused on racial and ethnic minorities, the reasons for participation (or lack thereof) may also apply to other devalued populations. For instance, Almeida et al. (Reference Almeida2009) find that peer discrimination among gay, lesbian and bisexual youth is linked to depressive symptoms, elevated risk of self-harm and even suicidal ideation – a similar pattern found among racial and ethnic minorities. Thus to the extent that stigmatized identities are central to a person’s concept of self, similar patterns of political behavior as outlined in this study may follow. In addition to extending the proposed theory to other groups, it is also important to examine the behaviors of intersectionally disadvantaged individuals. That is, individuals who may not only face racial or ethnic discrimination, but also discrimination based on other classifications, such as gender or sexual orientation. It is possible that disadvantage on multiple fronts could produce unique behavioral outcomes. As such, further theoretical development and refinement is necessary.
Another limitation of the present article concerns in-group discrimination, which is a prominent issue among diverse populations that share a common, overarching identity. A recent study in the United States by Sanchez and Espinosa (Reference Sanchez and Espinosa2016) discovered that nearly 40 per cent of Latinos reported being discriminated against by other racial or ethnic minorities, notably other Latinos, and that this experience of internal discrimination suppressed a sense of common group identity. Similarly, Lavariega Monforti and Sanchez (Reference Lavariega Monforti and Sanchez2010) found that 84 per cent of Latinos in a survey believed that in-group discrimination such as discrimination based on accent or skin color is highly prevalent. This means that another important dimension to discrimination is the identity of the discriminator. For some groups, especially those with a history of tension based on country of origin, language, religious or cultural differences, discrimination could also emanate from ‘in-group’ members, potentially impacting one’s perception of group attachment and willingness to partake in ‘ethnic-specific’ activities. Unfortunately, it was not possible to account for such marginalization – both in-group and out-group – with the EMBES dataset. However, future research would benefit from exploring this angle.
Future research would also benefit from a detailed analysis of individual versus group discrimination. As outlined earlier, there is a clear, qualitative difference between individuals perceiving that their ‘group’ is being marginalized as opposed to directly/personally experiencing different types of discrimination. While studies have made some inroads into this topic,Footnote 15 more specific measures are needed to better understand how the individual versus group discrimination discrepancy, which has been documented in detail by social psychologists (Taylor et al. Reference Taylor1990), impacts political outlooks and behaviors. My expectation is that personal discrimination provides a more powerful realization of political or societal differentiation, and thus is more likely to have a meaningful impact on behavior. However, this assertion must be empirically tested.
An investigation into threshold effects may also be insightful. While exceptionally difficult to pinpoint, the question of how much discrimination needs to be experienced to produce a certain behavior is important. An examination of magnitude effect provides yet another dimension to discrimination. Some forms of PD, such as voting rights violations or unjust incarceration, can render individuals incapable of participating in politics even if the desire to do so is very strong. There are thus clear exceptions to when PD is likely to increase voting behavior.
Lastly, accounting for the timing of discrimination and employing other methodological approaches could shed further light on the complex relationship between discrimination and behavior. Certainly, individuals could perceive discrimination at different junctures of their life such as during childhood, adolescence, adulthood or throughout their entire life cycle. To what extent, if at all, does timing impact behavior? Finally, because model-based approaches face known limitations, such as endogeneity, suppression effects and omitted-variable bias, other methodological approaches such as innovative experiments could reveal the limits and strengths of existing studies, including this one. Overall, the main objective of this study was to push the conversation forward and encourage more theorizing and analysis about issues of discrimination and sociopolitical behavior.
Supplementary Material
Replication data sets can be found in Harvard Dataverse at: https://doi.org/10.7910/DVN/4S2NIW The supplementary material for this article can be found at https://doi.org/10.1017/S0007123418000133
Acknowledgements
I would like to thank Rob Johns and the three anonymous reviewers at BJPolS for their thoughtful and constructive feedback. I am indebted to Chris Adolph, Matt Barreto, Ben Begozzi, Karam Dana, Luis Fraga, Phil Jones, Cheryl Kaiser, Nazita Lajevardi, Christopher Parker, Hannah Walker and a number of other colleagues for providing insightful feedback on previous versions of this manuscript. The usual disclaimers apply.