1. Introduction
Many bacteria are motile and inhabit a variety of dynamic fluid environments: from turbulent oceans to medical devices. Bacteria can bias their swimming in the presence of chemical cues, a process known as chemotaxis, which allows them to move towards preferable environments and away from harmful chemicals. Recent microfluidic experiments have uncovered new mechanisms by which fluid shear affects the spatial distribution of bacteria. Here, we develop and analyse a mathematical model to explain observations of Rusconi, Guasto & Stocker (Reference Rusconi, Guasto and Stocker2014) demonstrating the trapping of slender bacteria in regions of high shear in channel flow.
There has been much progress in modelling the collective dynamics of suspensions of swimming micro-organisms, including understanding phenomena such as gyrotaxis and bioconvection (Pedley & Kessler Reference Pedley and Kessler1992). A commonly used continuum description for micro-organism (cell) concentration is an advection–diffusion model in physical space, where directional swimming, for example chemotaxis, is captured by an advection term, and diffusion describes the random movements. As a first approximation, advection by the fluid can be simply added to this equation, an approach taken by Taylor & Stocker (Reference Taylor and Stocker2012) to model bacterial chemotaxis in turbulence. A more accurate approach, developed in the context of gyrotactic micro-organisms, is to allow the directional swimming and diffusion coefficients to be modified by the flow (Pedley & Kessler Reference Pedley and Kessler1990). Much recent interest has focused on instabilities driven by the active swimming forces exerted on the fluid, again often using advection–diffusion models for cell concentration (Pedley Reference Pedley2010). In this paper we shall demonstrate that while advection is an appropriate description of transport due to the combination of fluid advection and mean swimming velocity, modelling the random movements by diffusion in physical space fails to capture the phenomenon of trapping in high shear.
An alternative continuum approach is to consider a Smoluchowski equation describing the evolution of the distribution of cells in physical and orientation space, as reviewed by Saintillan & Shelley (Reference Saintillan and Shelley2013). For unbounded homogeneous shear flow, using the theory of generalised Taylor dispersion, the Smoluchowski equation has previously been shown, after sufficient time, to be approximated by an advection–diffusion equation in physical space only (Frankel & Brenner Reference Frankel and Brenner1993; Manela & Frankel Reference Manela and Frankel2003). However, this approach can fail for inhomogeneous shear flow, and we have previously shown that the full Smoluchowski equation can be useful in identifying the true distribution (Bearon, Hazel & Thorn Reference Bearon, Hazel and Thorn2011). In this paper we demonstrate that by deriving the equilibrium solution of the Smoluchowski equation we can replicate the experimental observations of trapping in high shear.
The overall aim of this paper is to develop a mathematical formalism to describe populations of slender chemotactic bacteria in shear flows. We begin in § 2 by introducing the governing Smoluchowski equation appropriate for a flow field that advects and rotates elongated axisymmetric cells, and assume that the cells undertake run-and-tumble chemotaxis. In addition, the cells experience translational and rotational diffusion. After explaining why an advection–diffusion equation in physical space cannot capture experimental observations, we restrict attention to a simplified two-dimensional geometry in which the flow field is parabolic and the chemoattractant gradient is constant and perpendicular to the flow direction. In § 3, results are presented for the equilibrium distribution of cells across the channel for a range of values of
 $\mathit{Pe}$
, the flow Péclet number, for both non-chemotactic and chemotactic cells. The distributions are computed using the numerical solution of the Smoluchowski equation by finite elements, and also from an analytic approximation obtained via an asymptotic expansion for small
 ${\it\epsilon}$
, the swimming Péclet number. The results are compared with experimental data, and the mechanism for trapping is explained. We draw our conclusions in § 4.
2. Model
2.1. Conservation equation for
 ${\it\psi}(\boldsymbol{x},\boldsymbol{p},t)$

Our starting point is a conservation equation for the probability distribution function
 ${\it\psi}(\boldsymbol{x},\boldsymbol{p},t)$
, representing the distribution of swimmer position
 $\boldsymbol{x}$
and orientation
 $\boldsymbol{p}$
at time
 $t$
, as reviewed by Saintillan & Shelley (Reference Saintillan and Shelley2013),
 $$\begin{eqnarray}\displaystyle & & \displaystyle \frac{\partial {\it\psi}}{\partial t}+\boldsymbol{{\rm\nabla}}_{\boldsymbol{x}}\boldsymbol{\cdot }(\dot{\boldsymbol{x}}{\it\psi})+\boldsymbol{{\rm\nabla}}_{\boldsymbol{p}}\boldsymbol{\cdot }(\dot{\boldsymbol{p}}{\it\psi})\nonumber\\ \displaystyle & & \displaystyle \quad +~{\it\lambda}(\boldsymbol{x},\boldsymbol{p},t){\it\psi}-\int _{{\it\Omega}}{\it\lambda}(\boldsymbol{x},\boldsymbol{p}^{\prime },t)K(\boldsymbol{p},\boldsymbol{p}^{\prime }){\it\psi}(\boldsymbol{x},\boldsymbol{p}^{\prime },t)\,\text{d}\boldsymbol{p}^{\prime }=0,\end{eqnarray}$$
where
 $\boldsymbol{{\rm\nabla}}_{\boldsymbol{p}}$
denotes the gradient operator on the unit sphere of orientations
 ${\it\Omega}$
. The first line accounts for changes due to the translational flux velocity,
 $\dot{\boldsymbol{x}}$
, and orientational flux velocity,
 $\dot{\boldsymbol{p}}$
, which are given by, again see Saintillan & Shelley (Reference Saintillan and Shelley2013),
 $$\begin{eqnarray}\displaystyle & \dot{\boldsymbol{x}}=\boldsymbol{u}+V_{s}\,\boldsymbol{p}-D\boldsymbol{{\rm\nabla}}_{\boldsymbol{x}}\ln {\it\psi}, & \displaystyle\end{eqnarray}$$
 $$\begin{eqnarray}\displaystyle & \displaystyle \dot{\boldsymbol{p}}={\it\beta}\boldsymbol{p}\boldsymbol{\cdot }\unicode[STIX]{x1D640}\boldsymbol{\cdot }(\unicode[STIX]{x1D644}-\boldsymbol{p}\boldsymbol{p})+{\textstyle \frac{1}{2}}{\bf\omega}\wedge \boldsymbol{p}-d_{r}\boldsymbol{{\rm\nabla}}_{\boldsymbol{p}}\ln {\it\psi}. & \displaystyle\end{eqnarray}$$
 $\boldsymbol{u}$
, cell swimming velocity,
 $V_{s}\,\boldsymbol{p}$
, and translational Brownian diffusion,
 $D$
. The orientational flux velocity represents an axisymmetric cell (with shape factor
 ${\it\beta}$
) rotated by viscous forces in a flow characterised by the rate-of-strain tensor
 $\unicode[STIX]{x1D640}$
and vorticity vector
 ${\bf\omega}$
. We also include rotational diffusion of magnitude
 $d_{r}$
, which may model intrinsic cell behaviour in addition to Brownian rotational diffusion. The shape factor,
 $0\leqslant {\it\beta}\leqslant 1$
, characterises the slenderness of the cell, and
 ${\it\beta}=0$
for a sphere.
The first term on the second line of (2.1) models bacteria that tumble away from orientation
 $\boldsymbol{p}$
with frequency
 ${\it\lambda}(\boldsymbol{x},\boldsymbol{p},t)$
and the second term represents bacteria that tumble from orientation
 $\boldsymbol{p}^{\prime }$
with frequency
 ${\it\lambda}(\boldsymbol{x},\boldsymbol{p}^{\prime },t)$
and choose a new orientation
 $\boldsymbol{p}$
with probability
 $K(\boldsymbol{p},\boldsymbol{p}^{\prime })$
. We note that
 $\int _{{\it\Omega}}\!K(\boldsymbol{p},\boldsymbol{p}^{\prime })\,\text{d}\boldsymbol{p}=1$
. For run-and-tumble chemotaxis, the frequency of tumbles depends on the change in chemical concentration experienced by the cell. For a linear (weak) chemotactic response, assuming that the chemical gradient is steady, homogeneous and perpendicular to the fluid velocity, we obtain a simple expression for the tumble rate, used previously, for example, by Bearon & Pedley (Reference Bearon and Pedley2000):
 $$\begin{eqnarray}{\it\lambda}(\boldsymbol{p})={\it\lambda}_{0}(1-{\it\zeta}V_{s}\,\boldsymbol{p}\boldsymbol{\cdot }\boldsymbol{{\rm\nabla}}s),\end{eqnarray}$$
where
 ${\it\lambda}_{0}$
is the tumble rate in the absence of chemical gradient,
 ${\it\zeta}$
is the chemotactic response strength and
 $s$
is the chemoattractant concentration.
2.2. Boundary condition
Integration of (2.1) over all orientations yields a conservation equation for the cell concentration,
 $n(\boldsymbol{x},t)=\int _{{\it\Omega}}{\it\psi}(\boldsymbol{x},\boldsymbol{p},t)\,\text{d}\boldsymbol{p}$
,
 $$\begin{eqnarray}\frac{\partial n}{\partial t}+\boldsymbol{{\rm\nabla}}_{\boldsymbol{x}}\boldsymbol{\cdot }\boldsymbol{J}=0,\end{eqnarray}$$
where the cell flux,
 $\boldsymbol{J}$
, is given by
 $$\begin{eqnarray}\boldsymbol{J}=\int _{{\it\Omega}}((\boldsymbol{u}+V_{s}\,\boldsymbol{p}){\it\psi}-D\boldsymbol{{\rm\nabla}}_{\boldsymbol{x}}{\it\psi})\,\text{d}\boldsymbol{p}.\end{eqnarray}$$
In confined geometries, e.g. within a channel, to impose zero cell flux through the walls, specified by the normal vector
 $\hat{\boldsymbol{n}}$
, we require that
 $\boldsymbol{J}\boldsymbol{\cdot }\hat{\boldsymbol{n}}=0$
. Assuming standard no-slip boundary conditions for the fluid and impermeable walls, the normal component of the fluid velocity is zero at the walls. Thus, the no-flux condition is given by
 $$\begin{eqnarray}\left(\int _{{\it\Omega}}V_{s}\,\boldsymbol{p}{\it\psi}\,\text{d}\boldsymbol{p}-D\boldsymbol{{\rm\nabla}}_{\boldsymbol{x}}n\right)\boldsymbol{\cdot }\hat{\boldsymbol{n}}=0.\end{eqnarray}$$
2.3. Population-level model
In previous work on generalised Taylor dispersion (Bearon Reference Bearon2003; Manela & Frankel Reference Manela and Frankel2003), it has been shown that on time scales long compared with the random reorientation time scales,
 $1/d_{r}$
or
 $1/{\it\lambda}_{0}$
, the cell concentration in unbounded homogeneous shear flow with uniform chemical gradient satisfies an advection–diffusion equation in physical space:
 $$\begin{eqnarray}\frac{\partial n}{\partial t}+\boldsymbol{{\rm\nabla}}_{\boldsymbol{x}}\boldsymbol{\cdot }[(\boldsymbol{u}+V_{s}\boldsymbol{q})n-\unicode[STIX]{x1D63F}\boldsymbol{\cdot }\boldsymbol{{\rm\nabla}}_{\boldsymbol{x}}n]=0,\end{eqnarray}$$
where
 $\boldsymbol{q}$
is the mean swimming direction and
 $\unicode[STIX]{x1D63F}$
is the diffusion tensor which represents the random components of swimming in addition to translational Brownian diffusion. While the diffusion tensor takes quite a complex form, the mean swimming direction is given by
 $\boldsymbol{q}=\int _{{\it\Omega}}\boldsymbol{p}f(\boldsymbol{p})\,\text{d}\boldsymbol{p}$
, where
 $f(\boldsymbol{p})$
is the equilibrium orientation distribution, which satisfies
 $$\begin{eqnarray}\boldsymbol{{\rm\nabla}}_{\boldsymbol{p}}\boldsymbol{\cdot }(\dot{\boldsymbol{p}}f)+{\it\lambda}(\boldsymbol{p})f-\int _{{\it\Omega}}{\it\lambda}(\boldsymbol{p}^{\prime })K(\boldsymbol{p},\boldsymbol{p}^{\prime })f\,\text{d}\boldsymbol{p}=0.\end{eqnarray}$$
We note that for unbounded homogeneous shear flow and uniform chemical gradient, the equilibrium orientation distribution is independent of spatial position; that is, the function
 $f(\boldsymbol{p})$
is independent of
 $\boldsymbol{x}$
.
2.4. Two-dimensional channel flow
Motivated by recent microfluidic experiments (Rusconi et al.
Reference Rusconi, Guasto and Stocker2014), we consider parabolic planar flow through a channel of width
 $W$
:
 $$\begin{eqnarray}\boldsymbol{u}=U\left(1-4\left(\frac{Y}{W}\right)^{2}\right)\boldsymbol{i},\end{eqnarray}$$
where
 $U$
is the flow velocity at the centreline of the channel. We choose plane Cartesian coordinates
 $(X,Y)$
, with respective base vectors
 $(\boldsymbol{i},\boldsymbol{j})$
, such that the walls of the channel are located at
 $Y=\pm W/2$
. Although we are now considering variable shear flow in a confined region, it is common to assume that the population of cells can still be approximated by an advection–diffusion equation of the form given by (2.8), provided that the flow-induced reorientation of the cells is sufficiently fast. If we impose zero cell flux at the wall, the equilibrium distribution for the cell concentration is then given by
 $$\begin{eqnarray}n(Y)=n(0)\exp \left(\int _{0}^{Y}\frac{V_{s}q_{Y}}{D_{YY}}\,\text{d}Y\right).\end{eqnarray}$$
For unbiased swimmers, we expect the mean vertical swimming speed,
 $V_{s}q_{Y}$
, to be zero, and we thus predict a uniform distribution for cells at equilibrium. However, this contradicts the observed depletion of bacteria in the central regions of a channel in the absence of chemical gradients (Rusconi et al.
Reference Rusconi, Guasto and Stocker2014).
In order to simplify subsequent numerical and analytic investigation, we now restrict attention to the mathematically simpler case of cells constrained to a two-dimensional plane, and so define the swimming direction vector in terms of the angle
 ${\it\theta}$
:
 $$\begin{eqnarray}\boldsymbol{p}=\cos {\it\theta}\boldsymbol{i}+\sin {\it\theta}\boldsymbol{j}.\end{eqnarray}$$
We non-dimensionalise such that
 $(x,y)=(2X/W,2Y/W)$
and the channel walls are at
 $y=\pm 1$
. We take the chemoattractant gradient to be in the positive cross-channel (
 $y$
) direction and independent of
 $x$
, and take the tumble rate to decrease linearly with chemotactic gradient, (2.4). In addition, for mathematical simplicity we shall focus attention on isotropic tumbles, taking
 $$\begin{eqnarray}K({\it\theta},{\it\theta}^{\prime })=\frac{1}{2{\rm\pi}}.\end{eqnarray}$$
On non-dimensionalising time on
 $d_{r}$
, from the governing equations (2.1)–(2.3) we obtain an equation for the equilibrium distribution
 ${\it\psi}(y,{\it\theta})$
:
 $$\begin{eqnarray}\displaystyle & & \displaystyle {\it\epsilon}\frac{\partial }{\partial y}(\sin {\it\theta}{\it\psi})-{\it\epsilon}^{2}\,\text{d}\frac{\partial ^{2}{\it\psi}}{\partial y^{2}}+\frac{\partial }{\partial {\it\theta}}\left(y\mathit{Pe}(1-{\it\beta}\cos 2{\it\theta}){\it\psi}-\frac{\partial {\it\psi}}{\partial {\it\theta}}\right)\nonumber\\ \displaystyle & & \displaystyle \quad +\,({\it\sigma}-{\it\epsilon}{\it\chi}\sin {\it\theta}){\it\psi}-\frac{1}{2{\rm\pi}}\int _{0}^{2{\rm\pi}}({\it\sigma}-{\it\epsilon}{\it\chi}\sin {\it\theta}^{\prime }){\it\psi}(y,{\it\theta}^{\prime })\,\text{d}{\it\theta}^{\prime }=0,\end{eqnarray}$$
where the non-dimensional parameters governing the system are given as follows:
 ${\it\epsilon}=2V_{s}/Wd_{r}$
is the swimming Péclet number,
 $\mathit{Pe}=2U/Wd_{r}$
is the flow Péclet number,
 $d=Dd_{r}/V_{s}^{2}$
is the ratio of Brownian diffusion to diffusion generated by random swimming,
 ${\it\sigma}={\it\lambda}_{0}/d_{r}$
is the ratio of tumble rate to rotational diffusion rate and
 ${\it\chi}={\it\lambda}_{0}{\it\zeta}(\text{d}s/\text{d}y)$
measures the chemotactic strength. The concentration is subject to a normalisation condition
 $\int _{-1}^{1}\int _{{\it\theta}=0}^{2{\rm\pi}}{\it\psi}(y,{\it\theta})\,\text{d}{\it\theta}\,\text{d}y=1$
, and the zero-flux boundary condition on the walls (2.7) can be expressed as
 $$\begin{eqnarray}\left.\int _{0}^{2{\rm\pi}}\left(\sin {\it\theta}{\it\psi}-{\it\epsilon}\,\text{d}\frac{\partial {\it\psi}}{\partial y}\right)\text{d}{\it\theta}\right|_{y=\pm 1}=0.\end{eqnarray}$$
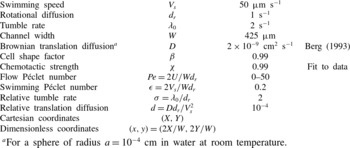
Parameter estimates are detailed in table 1.
Default parameter values, obtained from Rusconi et al. (Reference Rusconi, Guasto and Stocker2014) unless stated otherwise.

 $\text{}^{a}$
For a sphere of radius
 $a=10^{-4}~\text{cm}$
in water at room temperature.
3. Results and discussion
3.1. Numerical results
The full equation for
 ${\it\psi}$
, (2.14), is solved numerically using a Galerkin finite element method. Equation (2.14) is converted into a weak form on multiplication by a test function
 $N(y,{\it\theta})$
, integrating over the finite domain and then integrating by parts:
 $$\begin{eqnarray}\displaystyle & & \displaystyle \int _{0}^{2{\rm\pi}}\int _{-1}^{1}{\it\epsilon}\left[\sin {\it\theta}{\it\psi}-{\it\epsilon}\,\text{d}\frac{\partial {\it\psi}}{\partial y}\right]\frac{\partial N}{\partial y}+\left[y\mathit{Pe}(1-{\it\beta}\cos 2{\it\theta}){\it\psi}-\frac{\partial {\it\psi}}{\partial {\it\theta}}\right]\frac{\partial N}{\partial {\it\theta}}\,\text{d}y\,\text{d}{\it\theta}\nonumber\\ \displaystyle & & \displaystyle \quad +\,\int _{0}^{2{\rm\pi}}\int _{-1}^{1}[({\it\epsilon}{\it\chi}\sin {\it\theta}-{\it\sigma}){\it\psi}+I]N\,\text{d}y\,\text{d}{\it\theta}=0,\end{eqnarray}$$
where
 $I(y)$
, the integral term, is treated as a new variable approximated by Galerkin projection in the
 $y$
direction,
 $$\begin{eqnarray}\int _{-1}^{1}\left[\frac{1}{2{\rm\pi}}\int _{0}^{2{\rm\pi}}({\it\sigma}-{\it\epsilon}{\it\chi}\sin {\it\theta}^{\prime }){\it\psi}(y,{\it\theta}^{\prime })\,\text{d}{\it\theta}^{\prime }-I\right]\overline{N}(y)\,\text{d}y=0.\end{eqnarray}$$
Here,
 $\overline{N}$
represents the test functions restricted to the
 $y$
direction by integration over
 ${\it\theta}$
. Periodic boundary conditions are applied in the
 ${\it\theta}$
direction, and the omission of boundary terms arising from integration by parts enforces the natural boundary condition of no vertical flux,
 $\sin {\it\theta}{\it\psi}-{\it\epsilon}\,\text{d}(\partial {\it\psi}/\partial y)=0$
, pointwise on the walls
 $y=\pm 1$
. We note that this is a stronger condition than the integral condition (2.15), but it is required to prevent the appearance of eigenfunctions in the solution that lead to non-uniqueness (see the supplementary data available at http://dx.doi.org/10.1017/jfm.2015.198). The normalisation condition is enforced by fixing
 ${\it\psi}$
at a single node and then renormalising once the solution has been obtained. The equations are discretised using standard quadratic finite elements on a grid of
 $100({\it\theta})\times 500(y)$
. The elements are uniformly spaced in the
 ${\it\theta}$
direction, but high resolution and non-uniform spacing in the
 $y$
direction are required to accurately resolve thin diffusion boundary layers near the walls. A piecewise linear scaling is applied such that half of the elements are contained within the regions
 $|y|\geqslant 0.98$
. The discrete system of equations was assembled and solved using the C
 $++$
library oomph-lib (Heil & Hazel Reference Heil, Hazel, Schafer and Bungartz2006).
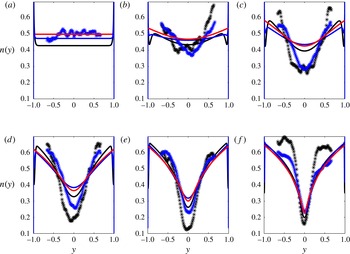
Figure 1 shows the equilibrium cell concentration,
 $n(y)=\int _{0}^{2{\rm\pi}}{\it\psi}(y,{\it\theta})\,\text{d}{\it\theta}$
, in the absence of chemical gradient. We find that a significant number of cells are contained within the boundary layers that arise from the boundary conditions imposed in the numerical simulations, which explains the discrepancy between the simulations and asymptotic approximations even at
 $\mathit{Pe}=0$
. As the flow strength, as measured by
 $\mathit{Pe}$
, increases, cells are depleted in the central low-shear regions of the channel and accumulate in the high-shear regions near the boundaries. The numerical solution underestimates the accumulation of cells at the boundaries. This could be due to the neglect of various mechanisms, including hydrodynamic interactions with the walls, which have previously been shown to generate boundary accumulations, as reviewed by Lauga & Powers (Reference Lauga and Powers2009). We also see that tumbling reduces the amount of depletion in both numerical simulation and experiments. However, we note that the estimate we take for rotational diffusion,
 $d_{r}$
, is that given by Rusconi et al. (Reference Rusconi, Guasto and Stocker2014), which incorporated all random reorientation mechanisms including tumbling. Therefore, the most appropriate comparison for experimental data on tumbling cells is actually the numerical simulation with
 ${\it\sigma}=0$
.
Equilibrium cell concentration across the channel in the absence of a chemotactic gradient,
 ${\it\chi}=0$
. Black line: numerical solution of the
 ${\it\psi}$
equation with non-tumbling cells,
 ${\it\sigma}=0$
. Blue line: numerical solution of the
 ${\it\psi}$
equation with tumbling cells,
 ${\it\sigma}=2$
. Red line: leading order in
 ${\it\epsilon}$
asymptotic approximation with non-tumbling cells,
 ${\it\sigma}=0$
. Black stars: experiments on smooth-swimming cells. Blue stars: experiments on tumbling cells. The values
 $\mathit{Pe}=[0,1.25,2.5,5,10,25]$
correspond to (a–f) respectively.

In figure 1, which is for very slender cells corresponding to
 ${\it\beta}=0.99$
, the numerical solution underestimates the depletion at intermediate
 $\mathit{Pe}$
and we find that the central depletion increases monotonically with shear rate, unlike the experimental findings of Rusconi et al. (Reference Rusconi, Guasto and Stocker2014). These latter observations are consistent with the Fokker–Planck solutions of Rusconi et al. (Reference Rusconi, Guasto and Stocker2014), which bear resemblance to the small-
 ${\it\epsilon}$
asymptotic solutions in § 3.2.
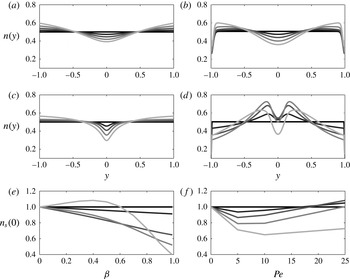
Figure 2 shows the dependence of the cell concentration on the shape parameter
 ${\it\beta}$
. For spherical cells,
 ${\it\beta}=0$
, the cell concentration is uniform throughout the channel. For moderate
 $\mathit{Pe}$
, from 1.25 to 10, the cell concentration shows monotonic depletion at the centre of the channel with increasing values of
 ${\it\beta}$
. At
 $\mathit{Pe}=25$
, the numerical solution disagrees with the small-
 ${\it\epsilon}$
asymptotic solution and exhibits non-monotonic changes in centreline concentration, as well as symmetric peaks in cell concentration away from the walls which increase in amplitude at small
 ${\it\beta}$
and then decay at larger
 ${\it\beta}$
. We note that Rusconi et al. (Reference Rusconi, Guasto and Stocker2014) observed similar double peaks away from the centreline in simulations where random reorientation mechanisms were neglected. At sufficiently high
 $\mathit{Pe}$
, the balance between vertical and rotational advection occurs at a larger length scale,
 $y\sim {\it\epsilon}^{1/2}\mathit{Pe}^{-1/2}$
, than the balance between rotational diffusion and advection,
 $y\sim \mathit{Pe}^{-1}$
. Thus, the dominant balance in the small-
 ${\it\epsilon}$
asymptotics is incorrect and the random reorientation only operates in an inner region near
 $y=0$
. Furthermore, the experimental findings of Rusconi et al. (Reference Rusconi, Guasto and Stocker2014) showing that the central depletion increases non-monotonically with shear rate are consistent with our model if the experimental estimate of
 ${\it\beta}=0.99$
is an overestimate. For slightly smaller values of
 ${\it\beta}$
, the central depletion changes non-monotonically with
 $\mathit{Pe}$
, see figure 2(f). O’Malley & Bees (Reference O’Malley and Bees2012) have shown that the effective cell eccentricity of a swimming cell is much smaller than that for the inanimate body alone, giving credence to the claim that
 ${\it\beta}=0.99$
may be an overestimate.
The influence of cell shape,
 ${\it\beta}$
, on equilibrium cell concentration with
 ${\it\chi}={\it\sigma}=0$
; (a,b) correspond to
 $\mathit{Pe}=5$
and (c,d) to
 $\mathit{Pe}=25$
. (a,c) Leading order in
 ${\it\epsilon}$
asymptotic approximation, other plots correspond to numerical solution of the
 ${\it\psi}$
equation. In (e,f)
 $n_{s}(0)$
is the cell concentration at
 $y=0$
normalised by the
 ${\it\beta}=0$
solution at the corresponding
 $\mathit{Pe}$
. In (a–d,f) greyscale indicates
 ${\it\beta}=[0,0.2,0.4,0.6,0.8]$
, with black corresponding to 0; in (e) greyscale indicates
 $\mathit{Pe}=[0,1.25,5,10,25]$
, with black corresponding to 0.

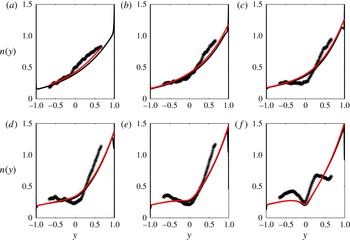
Figure 3 shows the corresponding equilibrium cell concentration for chemotactic cells. In the absence of shear, cells move up the chemical gradient, and at equilibrium, the balance between chemotactic drift up the chemical gradient and diffusion down the cell concentration gradient yields an exponential distribution in cell concentration. We see that the fitted distribution corresponds to
 ${\it\chi}\approx 1$
, which is to be expected as the chemical gradient in the experiment was such that the effect of chemotaxis was visible throughout the channel in still fluid. By introducing non-uniform shear through the channel, this equilibrium distribution is modified. As for the non-tumbling cells, there is a depletion of cells in the central low-shear regions of the channel. In the numerical simulations, the tumble rate,
 ${\it\sigma}$
, is non-zero in order to model run-and-tumble chemotaxis. As the estimate for rotational diffusion,
 $d_{r}$
, given by Rusconi et al. (Reference Rusconi, Guasto and Stocker2014) incorporates reorientation due to tumbles, in the numerical simulations with non-zero
 ${\it\sigma}$
the rotational diffusion is overestimated.
Equilibrium concentration with cross-channel chemotactic gradient. Black line: numerical solution of the
 ${\it\psi}$
equation. Red line: leading order in
 ${\it\epsilon}$
asymptotic approximation. Black stars: experiments. The values
 $\mathit{Pe}=[0,1.25,2.5,5,10,25]$
correspond to (a–f) respectively. Parameters:
 ${\it\chi}=0.99$
(fitted using
 $\mathit{Pe}=0$
experimental data);
 ${\it\sigma}=2$
.

3.2. Equilibrium cell concentration via small-
${\it\epsilon}$
asymptotics

To understand the mechanism for cell depletion in low shear, we consider a perturbation solution for
 ${\it\epsilon}\ll 1$
, and neglect Brownian translation diffusion,
 $d=0$
. Specifically, we consider a perturbation expansion for
 ${\it\psi}$
:
 $$\begin{eqnarray}{\it\psi}=n(y)f^{(0)}({\it\theta};y)+{\it\epsilon}{\it\psi}^{(1)}(y,{\it\theta}),\end{eqnarray}$$
where
 $\int _{0}^{2{\rm\pi}}f^{(0)}({\it\theta};y)\,\text{d}{\it\theta}=1$
and
 $f^{(0)}$
is periodic in
 ${\it\theta}$
. On inserting this expression into (2.14), we obtain at leading order in
 ${\it\epsilon}$
 $$\begin{eqnarray}\frac{\partial }{\partial {\it\theta}}\left(y\mathit{Pe}(1-{\it\beta}\cos 2{\it\theta})f^{(0)}-\frac{\partial f^{(0)}}{\partial {\it\theta}}\right)+{\it\sigma}\left(f^{(0)}-\frac{1}{2{\rm\pi}}\right)=0,\end{eqnarray}$$
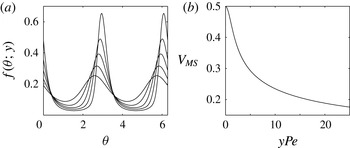
the solution of which is found numerically (see the supplementary data). We can interpret
 $f^{(0)}({\it\theta};y)$
as the leading-order equilibrium orientation distribution at a given cross-channel position
 $y$
.
Non-tumbling cells,
 ${\it\sigma}={\it\chi}=0$
. (a) Equilibrium orientation distribution,
 $f^{(0)}({\it\theta};y)$
, for values of
 $y\mathit{Pe}=[1.25,2.5,5,10,25]$
. As the shear increases, the orientation distribution is increasingly peaked around the horizontal,
 ${\it\theta}=0,{\rm\pi}$
. (b) The mean squared vertical swimming speed,
 $V_{MS}$
, as a function of the local shear strength,
 $y\mathit{Pe}$
.

On integrating (2.14) from
 ${\it\theta}=0$
to
 $2{\rm\pi}$
and noting that
 ${\it\psi}$
is periodic in
 ${\it\theta}$
we obtain at leading order in
 ${\it\epsilon}$
 $$\begin{eqnarray}\frac{\text{d}}{\text{d}y}\left(\int _{0}^{2{\rm\pi}}\sin {\it\theta}{\it\psi}^{(1)}\,\text{d}{\it\theta}\right)=0.\end{eqnarray}$$
On imposing the zero-flux boundary condition on the walls,
 $y=\pm 1$
, we obtain the zero-flux condition:
 $$\begin{eqnarray}\int _{0}^{2{\rm\pi}}\sin {\it\theta}{\it\psi}^{(1)}\,\text{d}{\it\theta}=0.\end{eqnarray}$$
Multiplying (2.14) by
 $\sin {\it\theta}$
, integrating over
 ${\it\theta}$
and applying the zero-flux condition (3.6) yields at
 $O({\it\epsilon})$
 $$\begin{eqnarray}\frac{\text{d}}{\text{d}y}(nV_{MS})-{\it\chi}nV_{MS}-y\mathit{Pe}\int _{0}^{2{\rm\pi}}\cos {\it\theta}(1-{\it\beta}\cos 2{\it\theta}){\it\psi}^{(1)}\,\text{d}{\it\theta}=0,\end{eqnarray}$$
where
 $$\begin{eqnarray}V_{MS}(y)=\int _{0}^{2{\rm\pi}}\sin ^{2}{\it\theta}f^{(0)}({\it\theta};y)\,\text{d}{\it\theta}\end{eqnarray}$$
is the mean squared vertical swimming speed at a given position,
 $y$
.
If we choose to neglect the
 $O({\it\epsilon})$
perturbation to
 ${\it\psi}$
, that is we set
 ${\it\psi}^{(1)}=0$
, we obtain an expression for the equilibrium cell concentration:
 $$\begin{eqnarray}n(y)=n(0)V_{MS}(0)\frac{\text{e}^{{\it\chi}y}}{V_{MS}(y)}.\end{eqnarray}$$
In figure 1, the leading-order approximation in the absence of chemical gradient is shown to agree well with the full numerical solution for a wide range of
 $\mathit{Pe}$
. To explain the phenomenon of trapping in high shear, we see from figure 4 that the straining motion causes the orientation distribution of slender cells to deviate from uniform, and become increasingly peaked towards the horizontal. We note that individual cells do not maintain an orientation aligned with the horizontal, rather they undergo noisy Jeffery orbits with a deterministic orientation-dependent angular velocity resulting in a non-uniform orientation distribution (Guazzelli & Morris Reference Guazzelli and Morris2012). This peak in orientation distribution towards the horizontal reduces the mean squared vertical speed,
 $V_{MS}$
, and generates accumulation of cells in regions of high shear. This mechanism for accumulation via a reduction in effective vertical speed was predicted by Rusconi et al. (Reference Rusconi, Guasto and Stocker2014). However, the details of their calculation were different from our current work and did not include chemotaxis. Specifically, they predicted that the concentration profile of cells should be inversely proportional to the average vertical component of upwards swimming cells,
 $\int _{0}^{{\rm\pi}}\sin {\it\theta}f^{(0)}({\it\theta};y)\,\text{d}{\it\theta}$
. They used a Fokker–Plank description for the orientation distribution at a given vertical position, equivalent to (3.4) with
 ${\it\sigma}=0$
. However, to derive the resultant cell concentration, they adapted a one-dimensional random-walk model instead of analysing the space-orientation distribution.
The agreement between the asymptotic approximation and the full numerical solution is not good at small
 ${\it\beta}$
and large values of
 $\mathit{Pe}$
, see figure 2, because the dominant balance between rotational advection and diffusion is no longer appropriate and the vertical advection term must be included at leading order. As
 ${\it\beta}$
increases, the effective
 $\mathit{Pe}$
decreases because most cells are concentrated near
 ${\it\theta}=0$
and
 ${\rm\pi}$
, and the dominant balance required in the asymptotics is regained.
For slender chemotactic cells, there is good agreement between the analytic approximation and the full numerical solution, as shown for a range of
 $\mathit{Pe}$
in figure 3. We should note that the profile is dominated by the exponential in the chemotactic strength parameter,
 ${\it\chi}$
, which was obtained via a nonlinear fit of (3.9) to the experimental data in the absence of shear to obtain
 ${\it\chi}=0.99$
. Thus, the good agreement between experiments and numerical solution at
 $\mathit{Pe}=0$
is a consequence of this fitting. We note that non-monotonic centreline depletion with increasing
 $\mathit{Pe}$
still occurs at smaller values of
 ${\it\beta}$
for chemotactic cells (see the supplementary data).
For
 $\mathit{Pe}\ll 1$
, we can obtain
 $f^{(0)}$
correct to
 $O(\mathit{Pe}^{2})$
(as computed by Rusconi et al.
Reference Rusconi, Guasto and Stocker2014 for
 ${\it\sigma}=0$
, also see the supplementary data), and thus obtain from (3.9) an approximate expression for the equilibrium distribution:
 $$\begin{eqnarray}n(y)=n(0)\left(1+\frac{{\it\beta}y^{2}\mathit{Pe}^{2}}{8(1+{\it\sigma}/4)^{2}}\right)\text{e}^{{\it\chi}y}.\end{eqnarray}$$
We see that, in this limit, the accumulation is proportional to the shape factor,
 ${\it\beta}$
, and scales as
 $\mathit{Pe}^{2}$
. Furthermore, we note that tumbling, as measured by
 ${\it\sigma}$
, increases the amount of reorientation experienced by cells. Thus, in regions of high shear, the non-uniformity of
 $f^{(0)}$
is reduced, causing an increase in
 $V_{MS}$
. This results in a reduction in the amount of cell aggregation in high-shear regions, as seen on comparing the tumbling and non-tumbling data and numerical solution in figure 1.
4. Conclusions
We have developed a continuum framework to describe the spatial distribution of slender chemotactic bacteria in channel flow which captures recently published experimental observations. In addition to solving the cell conservation equation numerically, we have obtained a simple analytic expression for the equilibrium distribution which helps us to understand the mechanism by which the distribution of cells is modified by fluid shear. The analytic expression is in good agreement with the numerical solutions for all cell shapes (
 ${\it\beta}$
) at moderate shear rates (
 $\mathit{Pe}$
), but is only appropriate at higher
 $\mathit{Pe}$
for very slender cells for which the rotational diffusion is of a similar magnitude to flow-induced reorientation. This work contributes to the understanding of hydrodynamic phenomena in suspensions of active swimmers. In particular, it highlights potential problems in modelling the random reorientation mechanism of bacteria in inhomogeneous shear as diffusion in physical space, and demonstrates the utility of an alternative framework, that of the Smoluchowski equation, which is still compatible with classical models of Stokesian swimmers.
For slender cells, when compared with the experimental data, the gradients in concentration are underestimated by the Smoluchowski equation, leading to underprediction of the depletion zone. On increasing
 $\mathit{Pe}$
the model predictions of centreline depletion move closer to the experimental data, unlike the individual-based simulations of Rusconi et al. (Reference Rusconi, Guasto and Stocker2014) which overpredict depletion for high
 $\mathit{Pe}$
. In contrast to the experimental results, the depletion increases monotonically with
 $\mathit{Pe}$
for slender cells (
 ${\it\beta}=0.99$
), but our model predicts non-monotonic behaviour for slightly less slender cells, which may suggest that the effective cell shape factor is smaller than previously estimated. Furthermore, when we solved the Smoluchowski equation numerically, we identified that an important area for future study is the boundary condition at the wall, which can have a dramatic effect on the global concentration field.
Many refinements are possible to this model framework in order to improve the agreement with experimental data. We have considered cells constrained to move in a two-dimensional plane, and we note that care must be applied in extending the results to cells free to move in three dimensions. Throughout this work we have neglected the feedback that swimming has on the flow field, yet even at low volume fractions, hydrodynamic interactions between cells and with boundaries can be important, for example leading to bioconvection and boundary accumulations respectively. At high volume fractions, the swimming stresses exerted on the fluid can drive fluid motions on spatial and temporal scales much larger than the individual cells (Lushi, Goldstein & Shelley Reference Lushi, Goldstein and Shelley2012). We have considered a very simple description of chemotaxis, which could be modified to take account of the observation that shear flow significantly impacts how cells temporally integrate the chemical signal (Locsei & Pedley Reference Locsei and Pedley2009). Furthermore, bacteria display a range of behaviours, and optimal swimming strategy can depend on the fluid dynamics (Stocker Reference Stocker2011).
The results presented here may be relevant not only to bacteria in pipe flow, but to unbounded flow such as in the turbulent ocean. While previous work has demonstrated bacterial accumulation at surfaces due to hydrodynamic interactions, reviewed by Lauga & Powers (Reference Lauga and Powers2009), the phenomenon of trapping in high shear discussed here is not restricted to boundary accumulation but may also be relevant to high-shear interior regions.
Acknowledgements
R. Rusconi and R. Stocker provided experimental motivation for this work and generously discussed their data and analysis.
Supplementary data
Supplementary data is available at http://dx.doi.org/10.1017/jfm.2015.198.