Introduction
Organic (opto)electronic and photonic materials are of interest due to their low-cost and tunable properties; a broad range of their applications, from photovoltaics to three-dimensional displays, have been demonstrated.[Reference Ostroverkhova1] Solution processable materials that can be cast into thin films using various solution deposition techniques are especially advantageous. One of the areas utilizing organic functional materials which has seen a dramatic progress over the past decade is the phenomena and applications relying on strong exciton–photon coupling in organic microcavities.[Reference Holmes and Forrest2–Reference Sanvitto and Kéna-Cohen4] These include polariton lasing, nonlinear polariton–polariton interactions, polariton electroluminescence, and polariton Bose–Einstein condensation.[Reference Kuehne and Gather3,Reference Sanvitto and Kéna-Cohen4] Moreover, it has been demonstrated that strong coupling may enable a boost in the performance of organic electronic devices. For example, an order of magnitude increase in charge carrier mobility was achieved in organic field-effect transistors (OFETs) of a perylene diimide derivative deposited on a plasmonic nanostructure, enabled by the formation of delocalized hybrid states;[Reference Orgiu, George, Hutchison, Devaux, Dayen, Doudin, Stellacci, Genet, Schachenmayer, Genes, Pupillo, Samori and Ebbesen5] enhanced responsivity was also observed in organic polaritonic photodiodes.[Reference Eizner, Brodeur, Barachati, Sridharan and Kena-Cohen6]
Early work on organic microcavities was done mostly on J-aggregated dye molecules dispersed in a polymer matrix.[Reference Hobson, Barnes, Lindzey, Gehring, Whittaker, Skolnick and Walker7] More recently, strong coupling in other classes of functional organic materials, in particular organic electronic materials, have attracted attention. These include photorefractive organic glasses,[Reference Liu, Rai, Grezmak, Twieg and Singer8] organic light-emitting diode and photovoltaic materials,[Reference Eizner, Brodeur, Barachati, Sridharan and Kena-Cohen6,Reference Kena-Cohen, Maier and Bradley9,Reference Roux and Bradley10] and benchmark organic semiconductors such as acene derivatives.[Reference Kena-Cohen and Forrest11,Reference Kéna-Cohen, Davanço and Forrest12] For example, ultra-strong coupling, with Rabi splitting of >1 eV, was observed in poly(9,9-dioctylfluorene)[Reference Roux and Bradley10] and dicyanomethylenedihydrofuran[Reference Liu, Rai, Grezmak, Twieg and Singer8] all-metal cavities. In acenes, large Rabi splittings of >0.2 eV have been experimentally demonstrated in anthracene (Ac) single crystals[Reference Kéna-Cohen, Davanço and Forrest12] and tetracene (Tc) polycrystalline films[Reference Kena-Cohen and Forrest11] in microcavities and enabled the demonstration of a room-temperature Ac crystal-based polariton laser.[Reference Kena-Cohen and Forrest13] In order to efficiently utilize strong exciton–photon coupling in enhancing optoelectronic properties of organic semiconductors, it is necessary to understand the photophysics of exciton–polaritons in these materials depending on various molecular properties. For our systematic studies of exciton–polariton properties, we selected blends of a high-performance solution-processable organic semiconductor diF TES-ADT [fluorinated anthradithiophene (ADT) derivative functionalized with triethylsilylethynyl (TES) side groups, inset of Fig. 1(b)] with poly(methyl methacrylate) (PMMA). The choice of the functionalized ADT derivative diF TES-ADT was motivated by the following considerations: (i) the fluorinated functionalized ADT derivatives have served as a model system for studies of exciton and charge carrier dynamics depending on the molecular packing in crystalline samples,[Reference Paudel, Giesbers, Van Schenck, Anthony and Ostroverkhova14] on the molecular density in dilute diF TES-ADT:PMMA films,[Reference Shepherd, Platt, Hofer, Ostroverkhova, Loth and Anthony15] and on the intermolecular interactions in blends of diF TES-ADT with other molecules[Reference Shepherd, Platt, Kendrick, Loth, Anthony and Ostroverkhova16] and (ii) diF TES-ADT exhibits high charge carrier (hole) mobilities [up to 6–7 cm2/(Vs)][Reference Jurchescu, Subramanian, Kline, Hudson, Anthony, Jackson and Gundlach17,Reference Niazi, Li, Li, Kirmani, Abdelsamie, Wang, Pan, Payne, Anthony, Smilgies, Thoroddsen, Giannelis and Amassian18] in single crystals and in crystalline thin films produced by methods compatible with roll-to-roll technology. Even in dilute diF TES-ADT:PMMA films, measurable (photo)currents have been observed down to rather low diF TES-ADT concentrations.[Reference Shepherd, Platt, Hofer, Ostroverkhova, Loth and Anthony15] These studies have laid a foundation for understanding the photophysics and (opto)electronic properties of these materials outside of the cavities which now can be systematically explored in cavities. In this paper, we present our first study toward this goal. We demonstrate strong exciton–photon coupling in diF TES-ADT:PMMA blends placed in all-metal cavities and establish how exciton–polariton properties depend on the concentration of diF TES-ADT.
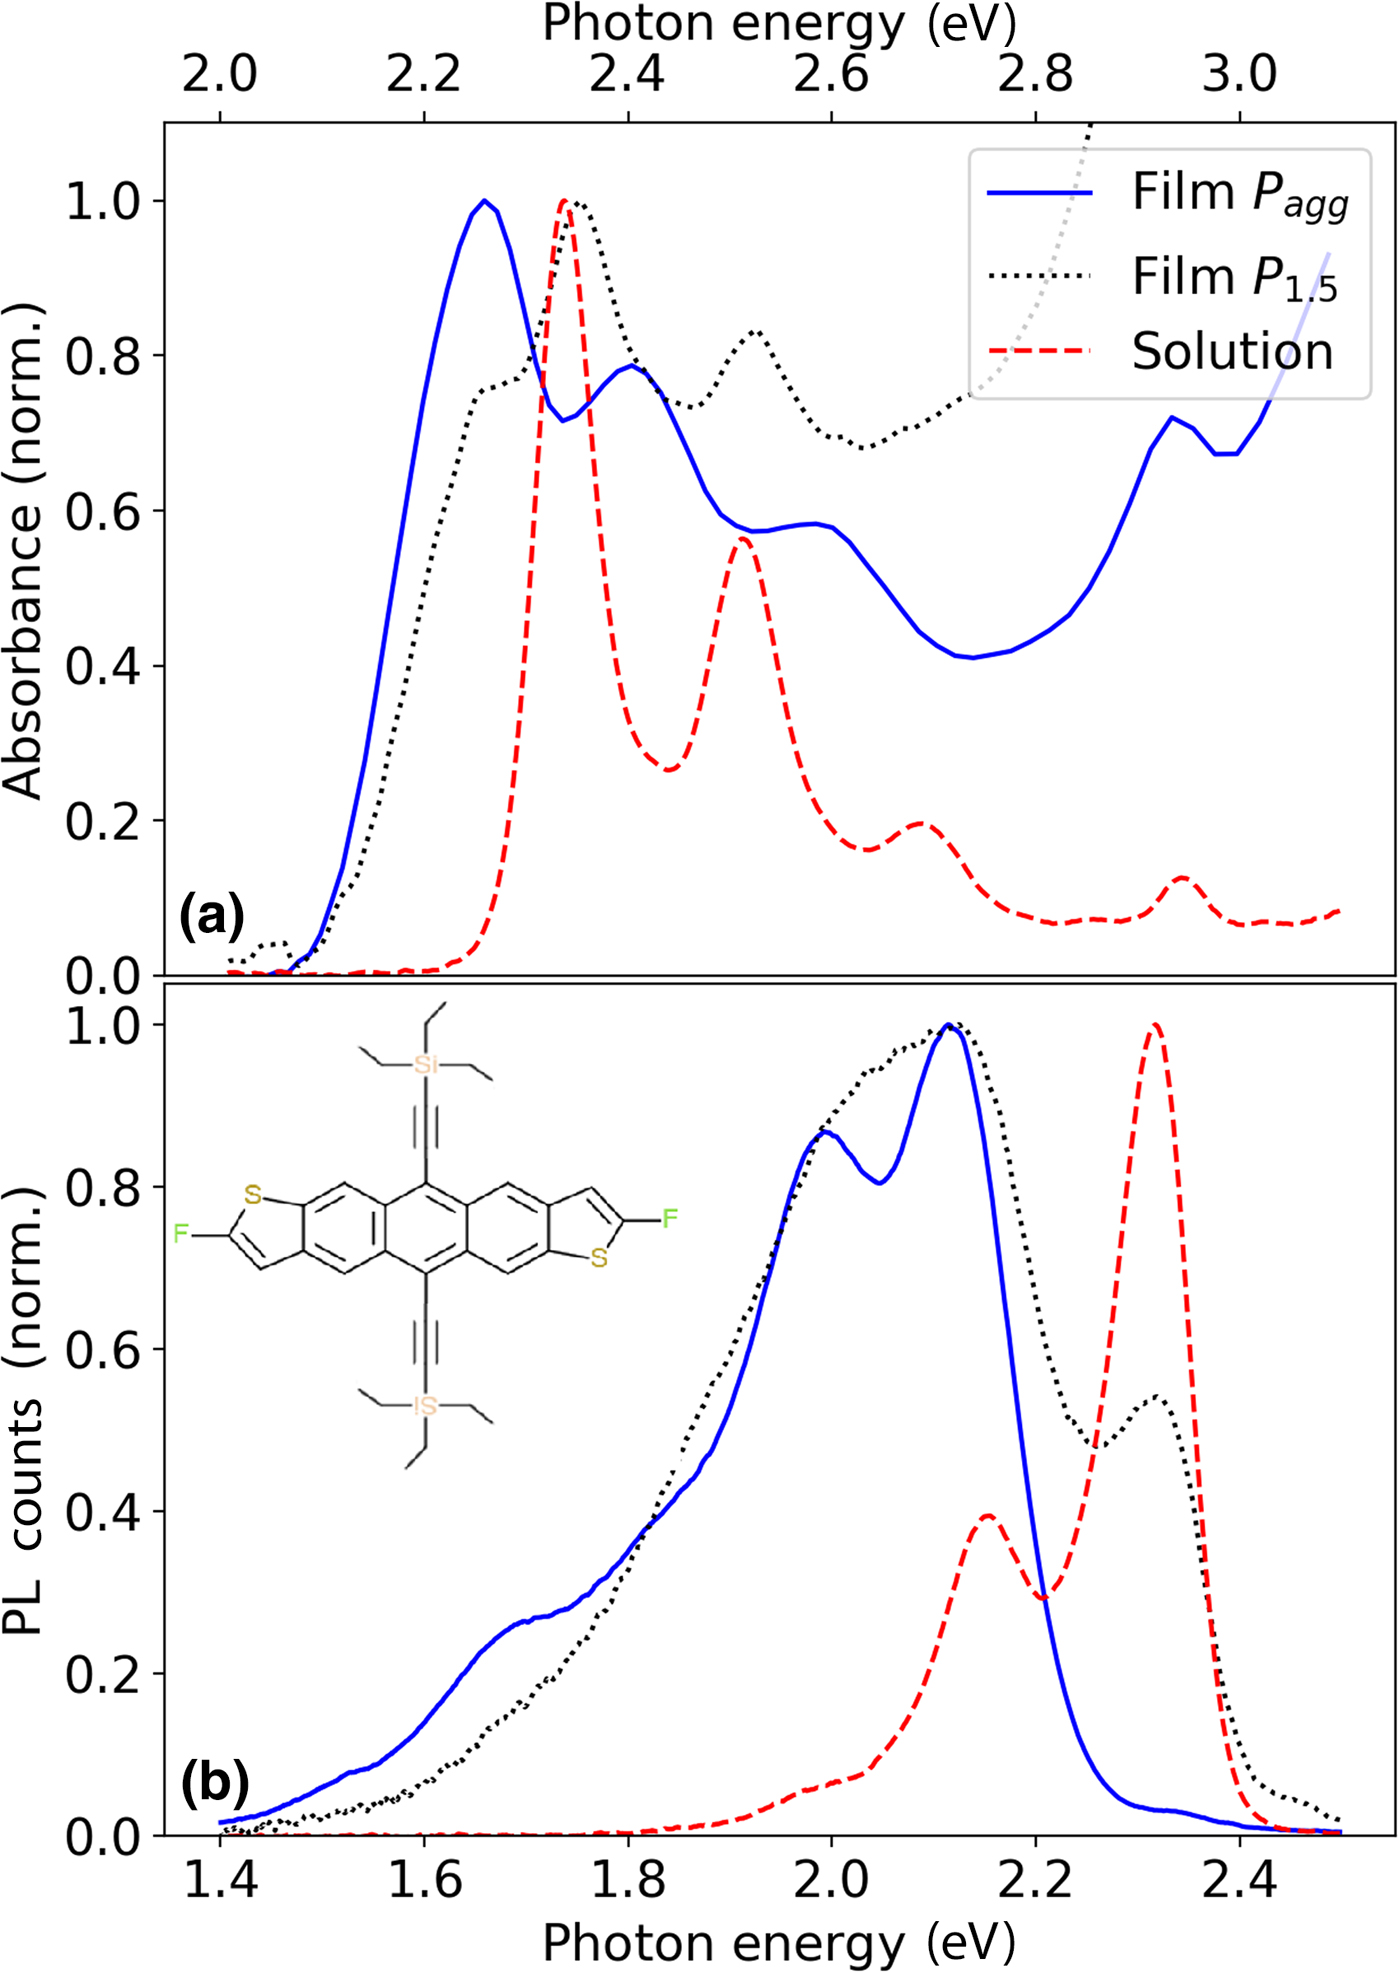
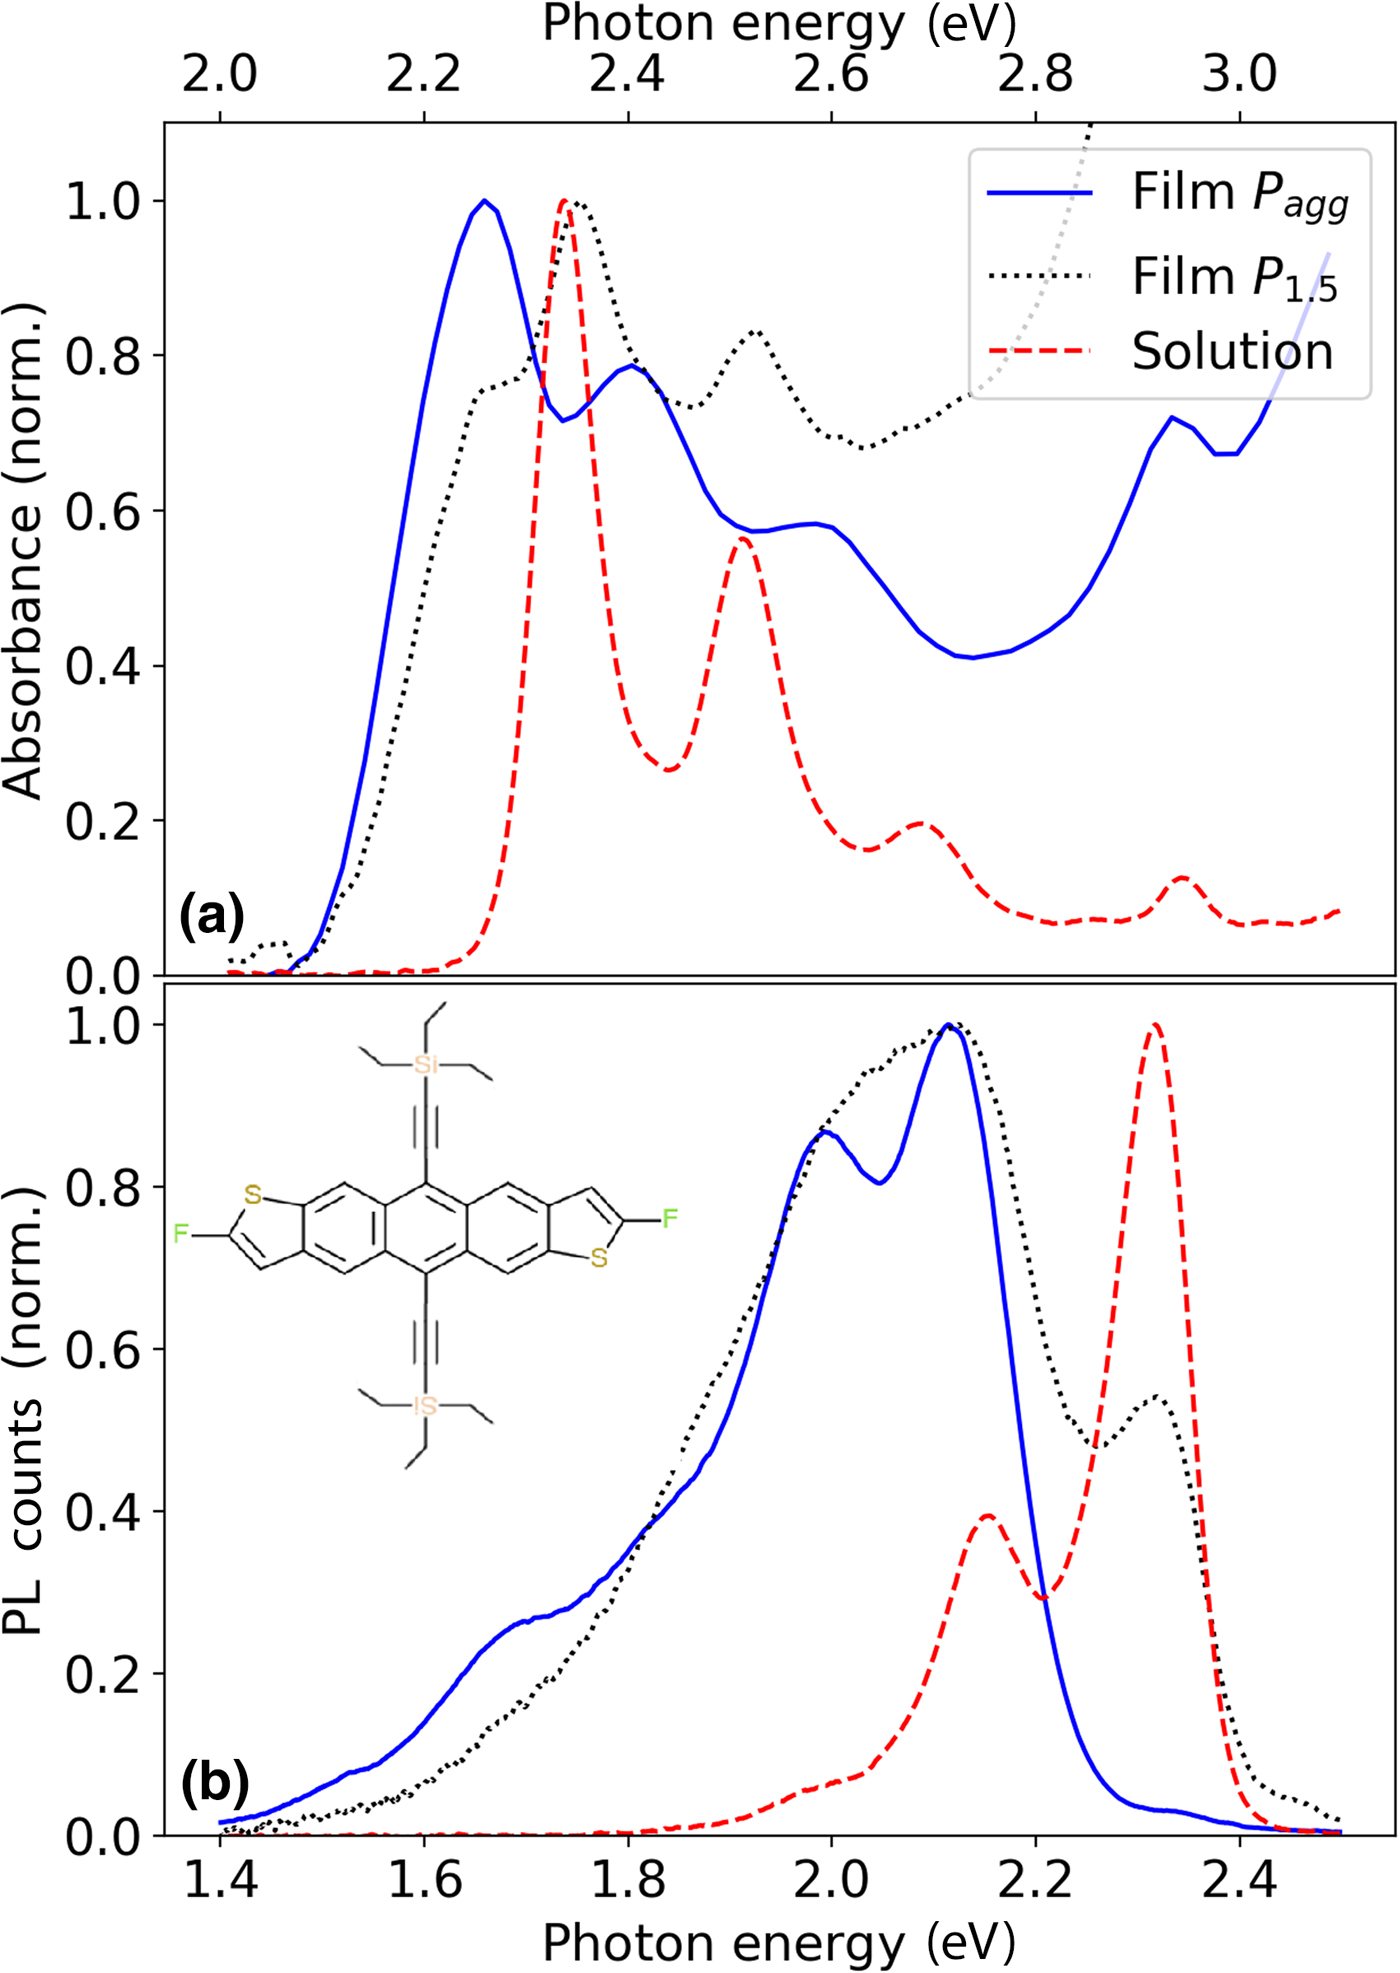
(a) Absorption and (b) photoluminescence of “bare” (i.e., outside of the cavity) diF TES-ADT:PMMA films P agg (solid blue lines) and P 1.5 (dotted black lines). Spectra of dilute diF TES-ADT solution in toluene due to “isolated” diF TES-ADT molecules are also included (dashed red lines). Inset of (b) shows the molecular structure of diF TES-ADT.
Methods
Sample preparation
Optical cavities were fabricated first by depositing 100 nm of silver onto a glass substrate by thermal evaporation. DiF TES-ADT:PMMA films were deposited by spin-casting from toluene solution. For these, a 35 mg/mL toluene solution of PMMA (M W ~ 15,000, Sigma-Aldrich, St. Louis, MO, USA) was combined with diF TES-ADT at various concentrations (8.6 × 10⁻⁴–2.8 × 10⁻² M) to create films with average diF TES-ADT molecular spacing (d) ranging from 1 to 6 nm as described in Supplementary Material and in our previous publication.[Reference Shepherd, Platt, Hofer, Ostroverkhova, Loth and Anthony15] For the films with the highest diF TES-ADT concentration, the substrate was first treated with pentafluorobenzenethiol to enhance diF TES-ADT:PMMA film adhesion and surface quality.[Reference Paudel, Giesbers, Van Schenck, Anthony and Ostroverkhova14] The cavities were finished by depositing a 30 nm silver top mirror (Supplementary Fig. S1). Selected cavities had both the top and the bottom silver mirror with thicknesses of 45 nm. A control cavity was also fabricated containing only PMMA. The thicknesses of the cavities were measured by ellipsometry to range between 100 and 160 nm. The uniformity of the cavity structure and thicknesses of various layers in selected cavities were also assessed using cross-sectional scanning electron microscopy (Supplementary Fig. S2). Cavity Q-factors were calculated using the full width at half maximum (FWHM) of either the reflectance or photoluminescence (PL) cavity resonances at angles nearnormal incidence yielding Q-factors of ~20–50 depending on the cavity, corresponding to FWHM linewidth between ~40 and 150 meV (Supplementary Table S1 and Figs. S3 and S4).
Throughout the paper, the films with d ≥ 1.5 nm will be referred to as P d. At higher diF TES-ADT concentrations (d < 1.5 nm), diF TES-ADT exhibits strong aggregation and the average molecular spacing is not a representative parameter[Reference Shepherd, Platt, Hofer, Ostroverkhova, Loth and Anthony15]; these films are denoted P agg. Some diF TES-ADT aggregation is apparent in optical properties of P d samples with d in the 1.5–2.5 nm range, as discussed in detail below. While in dilute samples (d > 2.5 nm), the diF TES-ADT molecules are expected to be dispersed in PMMA homogeneously and the sample morphology is dominated by that of amorphous PMMA, the samples with higher diF TES-ADT concentrations exhibit some structure due to the formation of diF TES-ADT crystallites with (00l) orientation (l = 1–4), as seen from the x-ray diffraction data for P agg and P 1.5 films (Supplementary Fig. S5), with P agg exhibiting much higher degree of preferential orientation similar to that in pristine diF TES-ADT films.[Reference Paudel, Johnson, Thieme, Haley, Payne, Anthony and Ostroverkhova19]
Experiments and modeling
Angle-resolved reflectance (ARR) for all cavities, illuminated by s- or p-polarized light at angles of incidence between 20° and 80°, was measured using a spectroscopic ellipsometer (V-VASE J.A. Woollam). The reflectance data were also simulated by transfer-matrix formalism, utilizing an index of refraction measured by the same instrument (Supplementary Figs. S6 and S7). Angle-resolved photoluminescence (ARPL) was measured with a custom-built confocal microscope assembly utilizing an inverted fluorescence microscope (Olympus IX-71). Samples were excited above resonance with a 355 nm pulsed laser (frequency-tripled Nd:YAG) at normal incidence through a 10× objective, and PL was collected in transmission between 0° and 80° degrees off normal. Collected PL passed a linear polarizer to select either s- or p-polarized emission and was then analyzed by a spectrometer (USB2000-FLG, Ocean Optics, Inc.).
For each cavity, the photon mode was modeled using the following equation[Reference Kena-Cohen, Maier and Bradley9]:

where E 0 is the normal incidence photon energy and n eff is the effective index of refraction for the film (expected to differ between s- and p-polarizations).[Reference Kena-Cohen, Maier and Bradley9] The dispersive spectral features of cavity reflectance for films with lower average molecular spacing d (d ≤ 1.5 nm) were modeled using a coupled oscillator Hamiltonian of the form:

where E Xi and V i are the exciton energies and couplings, respectively, whereas Γp and ΓX are the photon and exciton dissipation constants [half width at half maxima (HWHM) of the “bare” photon and exciton resonances]. The exciton energies and dissipation constant were fixed at the values extracted from fits of the spectra of “bare” (i.e., outside of the cavity, Supplementary Fig. S1) film and the photon dissipation constant was estimated from the HWHM of the lower polariton (LP) cavity resonances with large detunings (Supplementary Table S1).The couplings V i, photon energy E 0, and effective index n eff were all taken as fit parameters.
The ARPL data from cavities with films with higher average molecular spacing d (d ≥ 2.5 nm) revealed only the LP branch; thus, a reduced Hamiltonian was used[Reference Ishimura, Amashita, Anagi and Akayama20]:

To mitigate overfitting, the value of E X was fixed to the exciton energy of isolated molecules [2.35 eV, Fig. 1(a)], extracted from absorption spectra of dilute diF TES-ADT solutions.[Reference Ishimura, Amashita, Anagi and Akayama20] The effective index n eff was also fixed to the values extracted from ARR in cavities (Supplementary Fig. S3): $n_{{\rm eff}}^{s-{\rm pol}} = 1.55$ , $n_{{\rm eff}}^{p-{\rm pol}} = 2.21$
 for s- and p-polarized light, respectively.
Results
“Bare” diF TES-ADT films
The absorption and PL spectra of “bare” (i.e., outside of the cavity, Supplementary Fig. S1) diF TES-ADT:PMMA films P 1.5 and P agg are shown in Fig. 1. As detailed in our previous publication,[Reference Shepherd, Platt, Hofer, Ostroverkhova, Loth and Anthony15] the optical properties of diF TES-ADT:PMMA guest-host films can be dominated by those of the “isolated” (noninteracting) diF TES-ADT molecules (with spectra similar to those of diF TES-ADT in dilute solutions, Fig. 1) or by those of diF TES-ADT aggregates (with spectra similar to those of pristine diF TES-ADT polycrystalline films), depending upon the concentration of diF TES-ADT guest. In particular, in films with optical properties dominated by those of isolated diF TES-ADT molecules, the absorption (PL) spectra exhibit a vibronic progression with the 0–0 transition energy for the absorption (PL) at $E_{00}^{{\rm Iso}\;{\rm Abs}} = 2.35\,{\rm eV}$ $\lpar {E_{00}^{{\rm Iso}\;{\rm PL}} = 2.34\,{\rm eV}} \rpar$
 . In contrast, films with higher diF TES-ADT concentrations exhibit spectra due to the diF TES-ADT aggregates, which are red-shifted with respect to those of isolated molecules (Fig. 1) such that $E_{00}^{{\rm Agg}\;{\rm Abs}} = 2.25\;{\rm eV}$
 $\lpar {E_{00}^{{\rm Agg\;} \;PL} = 2.10\;{\rm eV}} \rpar$
 . The optical properties of diF TES-ADT:PMMA films (P d) with an average molecular spacing d ≥ 2.5 nm were found to be dominated by those of isolated diF TES-ADT molecules, whereas the P agg films (d < 1.5 nm) were dominated by those of aggregates, in agreement with our previous work.[Reference Shepherd, Platt, Hofer, Ostroverkhova, Loth and Anthony15] The films with d in the 1.5–2.5 nm range had spectral features both due to isolated diF TES-ADT molecules and their aggregates (e.g., P 1.5 in Fig. 1) and their relative contributions could be quantified via spectral fitting as discussed in Supplementary Material.[Reference Shepherd, Platt, Hofer, Ostroverkhova, Loth and Anthony15] For example, in the P 1.5 film in the spectral region of the S 0–S 1 absorption (2.2–2.7 eV), 50% of the absorption is due to the isolated diF TES-ADT molecules and 50% is due to diF TES-ADT aggregates (Supplementary Fig. S8). The nature of aggregates in ADT solids has been previously studied; for example, in pristine polycrystalline diF TES-ADT films, the absorption and PL features could be explained in a framework of disordered H-aggregates,[Reference Platt, Kendrick, Loth, Anthony and Ostroverkhova21] whereas in diF TES-ADT crystals spectral features of both H- and J-aggregates could be identified depending on the light polarization with respect to crystal axes.[Reference Van Schenck, Giesbers, Kannegula, Cheng, Anthony and Ostroverkhova22]
diF TES-ADT films in cavities: low diF TES-ADT concentrations
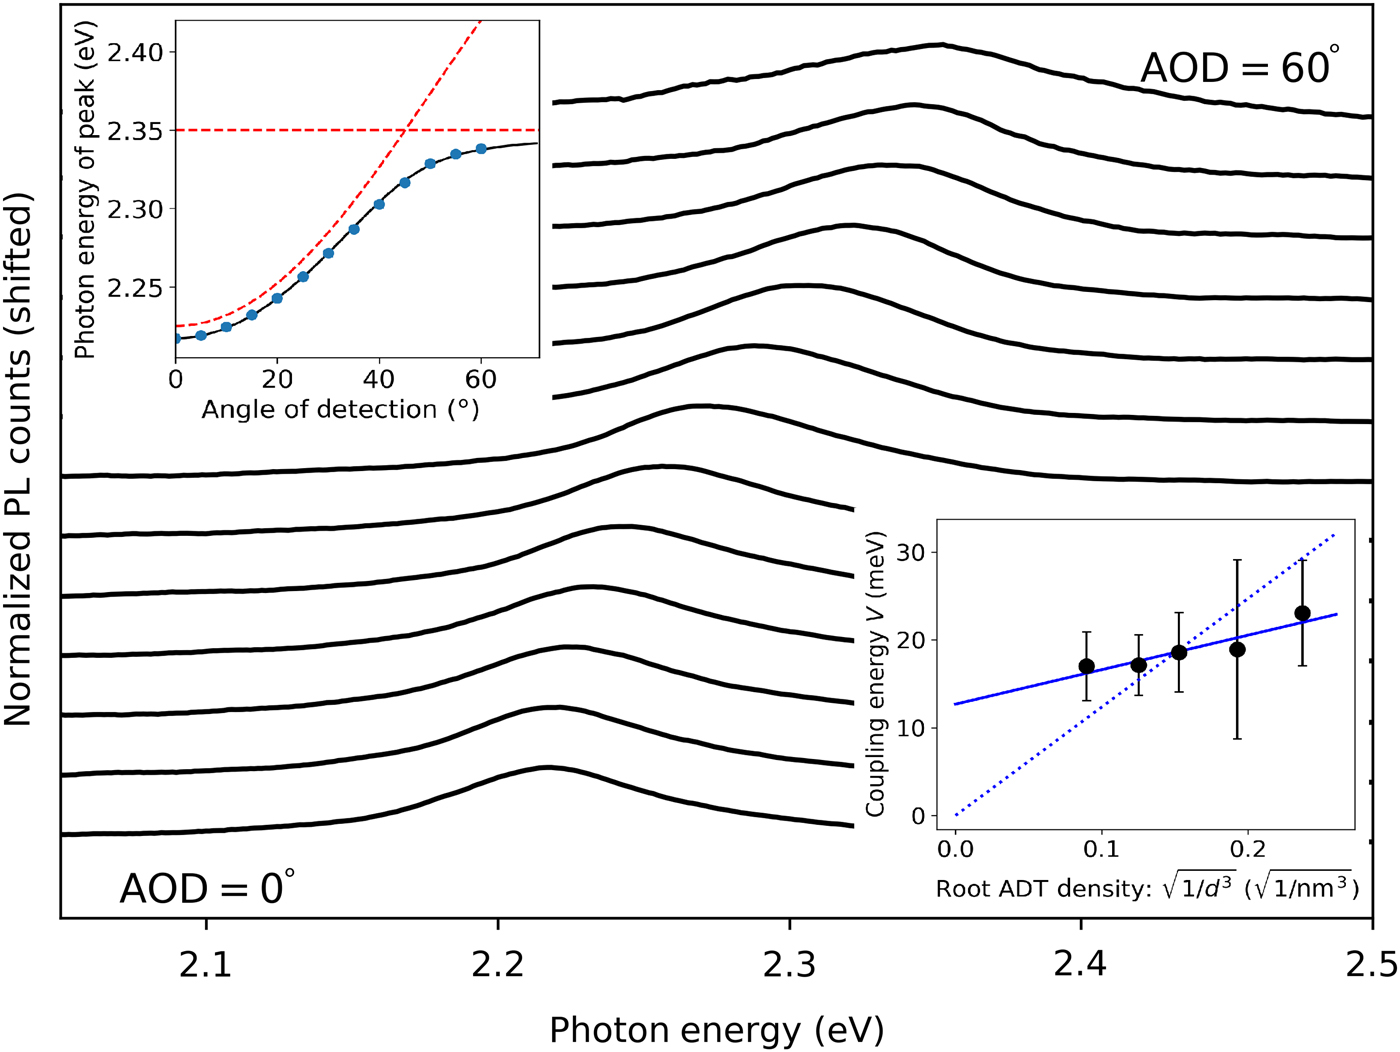
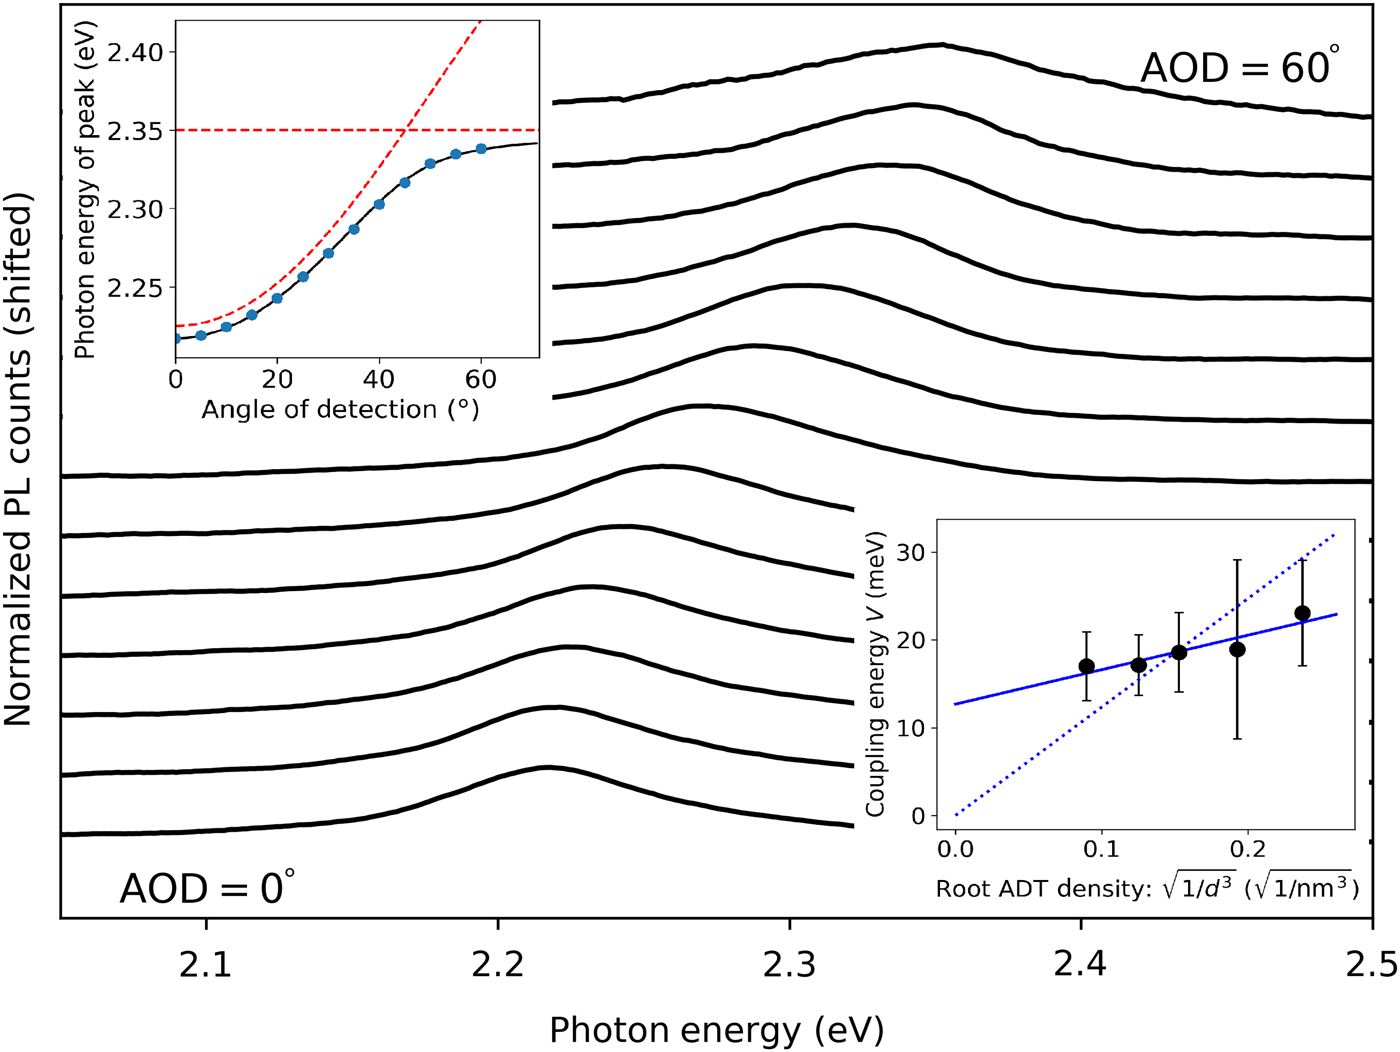
In the cavities containing P d films with optical properties dominated by those of isolated diF TES-ADT molecules (i.e., d ≥ 2.5 nm), the densities of diF TES-ADT were too low to resolve polariton features in the reflectance spectra, due to the low absorbance of the dilute diF TES-ADT:PMMA films.[Reference Shepherd, Platt, Hofer, Ostroverkhova, Loth and Anthony15] However, the high PL quantum yield of isolated diF TES-ADT molecules in PMMA (ΦPL = 0.9)[Reference Shepherd, Grollman, Robertson, Paudel, Hallani, Loth, Anthony and Ostroverkhova23] enabled the probing of polariton properties using ARPL(e.g., data from a 135 nm P 2.5 film in a cavity are shown in Fig. 2). In contrast to the vibronic progression structure of the PL spectra of “bare” dilute diF TES-ADT:PMMA films [similar to those for solution PL in Fig. 1(b)], the ARPL from the cavities exhibited only a single emission peak with a characteristic polaritonic dispersion (top left inset of Fig. 2), which we attribute to that from the LP branch. The curvature of this dispersion was dependent upon polarization, with s-polarized emission showing consistently higher curvature, in agreement with previous studies.[Reference Kena-Cohen, Maier and Bradley9] At high angles of detection, the dispersion flattens, which is consistent with the LP losing the purity of its photonic character near the exciton–photon anti-crossing (e.g., 60° in Fig. 2). The data were modeled using Eq. (3) (top left inset of Fig. 2), revealing average coupling energies (V) of ~17–23 meV in P d films depending on the average molecular spacing d (bottom right inset of Fig. 2). The Rabi splittings (corrected for broadening) were calculated using the following equation[Reference Savona, Andreani, Schwendimann and Quattropani24]:

Angle-resolved s-polarized PL from cavity P 2.5 (thickness: 135 nm), representative of ARPL from cavities P d where d ≥ 2.5 nm. The top left inset shows the polariton dispersion (peak PL energy as a function of the detection angle) (blue dots). The black line shows the dispersion modeled with Eq. (3). Energies of the “bare” exciton E X and photon mode of Eq. (5) are also included as red dashed lines. The bottom right inset shows the exciton–photon coupling energy (V) obtained from cavities P d where d varied between 2.5 and 5 nm. Error bars indicate sample-to-sample variation over 6–8 cavities. The solid line is a linear fit to the data (intercept at 13 ± 3 meV) and the dotted line is a fit to Eq. (5) (intercept fixed at 0) showing scaling of the coupling energy (V) with the square root of diF TES-ADT density.
The obtained Rabi splittings, averaged over 6–8 cavities with fixed d, ranged between 28 and 45 meV depending on d.
In the P d samples with d in the 2.5–5 nm range, the trend of the exciton–photon interaction energy (V) was consistent with a linear scaling with the square root of diF TES-ADT density (N ~ 1/d 3) expected from Eq. (5) (bottom right inset of Fig. 2)[Reference Fox25]:

where μ is the transition dipole moment of the chromophore, V 0 is the mode volume of the cavity, N is the number of chromophores interacting with the cavity mode, and ω is the resonance energy. However, the best linear fit of V versus $\surd N$ , weighed by errors due to the sample-to-sample variation (error bars in the bottom inset of Fig. 2), yielded the intercept of 13 ± 3 meV, which is significantly different from 0.[Reference Paudel, Giesbers, Van Schenck, Anthony and Ostroverkhova14] The intercept provides a measure for an additional error in these measurements.
diF TES-ADT films in cavities: intermediate diF TES-ADT concentrations
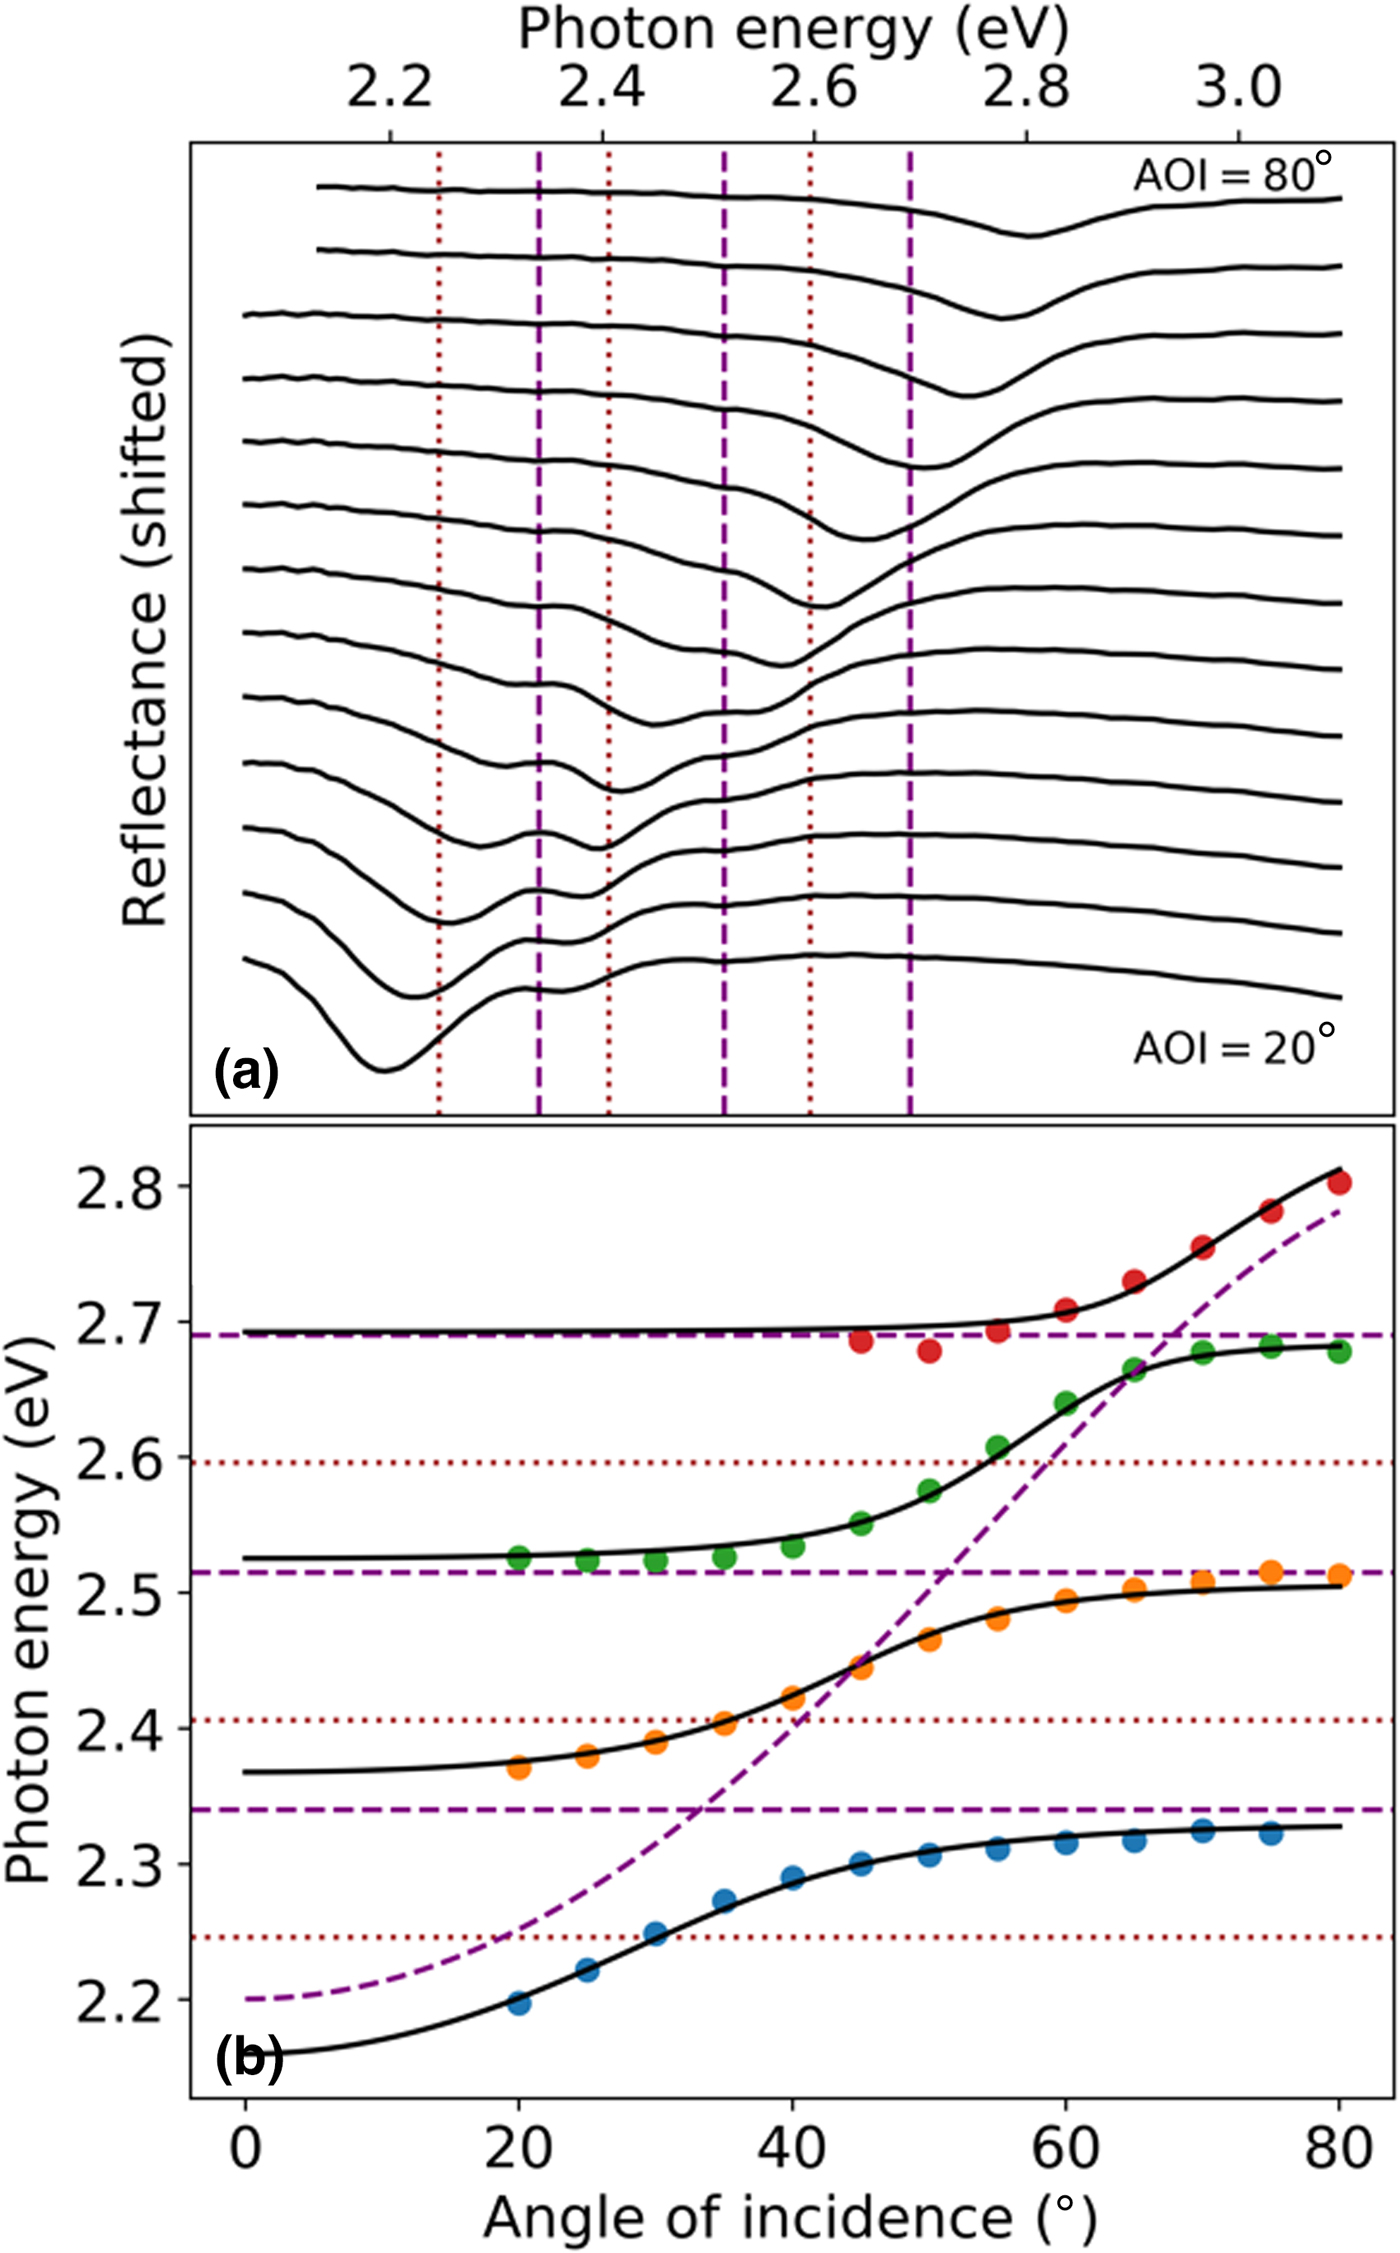
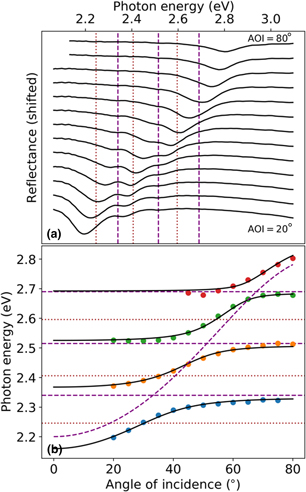
Figure 3(a) shows the reflectance of the P 1.5 film in the cavity. As discussed above (Fig. 1), the P 1.5 “bare” film exhibits features corresponding to both isolated diF TES-ADT molecules and diF TES-ADT aggregates. Interestingly, the P 1.5 cavity exhibits a strongly preferential photon coupling to the isolated diF TES-ADT molecule's exciton transitions [Figs. 3(a) and 3(b)]. In particular, the lower polariton branch, two middle branches, and the upper polariton (UP) branch (LP, MP1, MP2, and UP, respectively) could be identified, and their dispersion modeled with Eq. (2). This revealed couplings V 1, V 2, V 3 of 75, 55, and 35 meV, respectively, for s-polarization (80, 60, and 30 meV for p-polarization; Supplementary Fig. S8 and Table S1). The corresponding Rabi splittings, after correction for broadening using Eq. (4), yielded 150, 110, and 60 meV for s-polarization (160, 120, and 60 meV for p-polarization; Supplementary Table S1).
(a) Angle-resolved s-polarized reflectance spectra from cavity P 1.5 with a 100 nm thickness. Dashed purple lines indicate the “bare” exciton energies for isolated diF TES-ADT molecules (corresponding to the 0–0, 0–1, and 0–2 transitions in the vibronic progression), while dotted brown lines indicate exciton energies for diF TES-ADT aggregates. (b) Energies for the LP, MP1, MP2, and UP branches extracted from (a) at various angles of incidence are shown as dots (colored to differentiate each polariton branch). The solid black lines show the polariton dispersion fit using the coupled oscillators model [Eq. (2)], demonstrating the preferential coupling of the cavity photon to isolated diF TES-ADT molecules. Energies of excitons (dashed purple lines for isolated molecules and dotted brown lines for aggregates) in “bare” film are also included along with the cavity photon energies of Eq. (5).
diF TES-ADT films in cavities: high diF TES-ADT concentrations
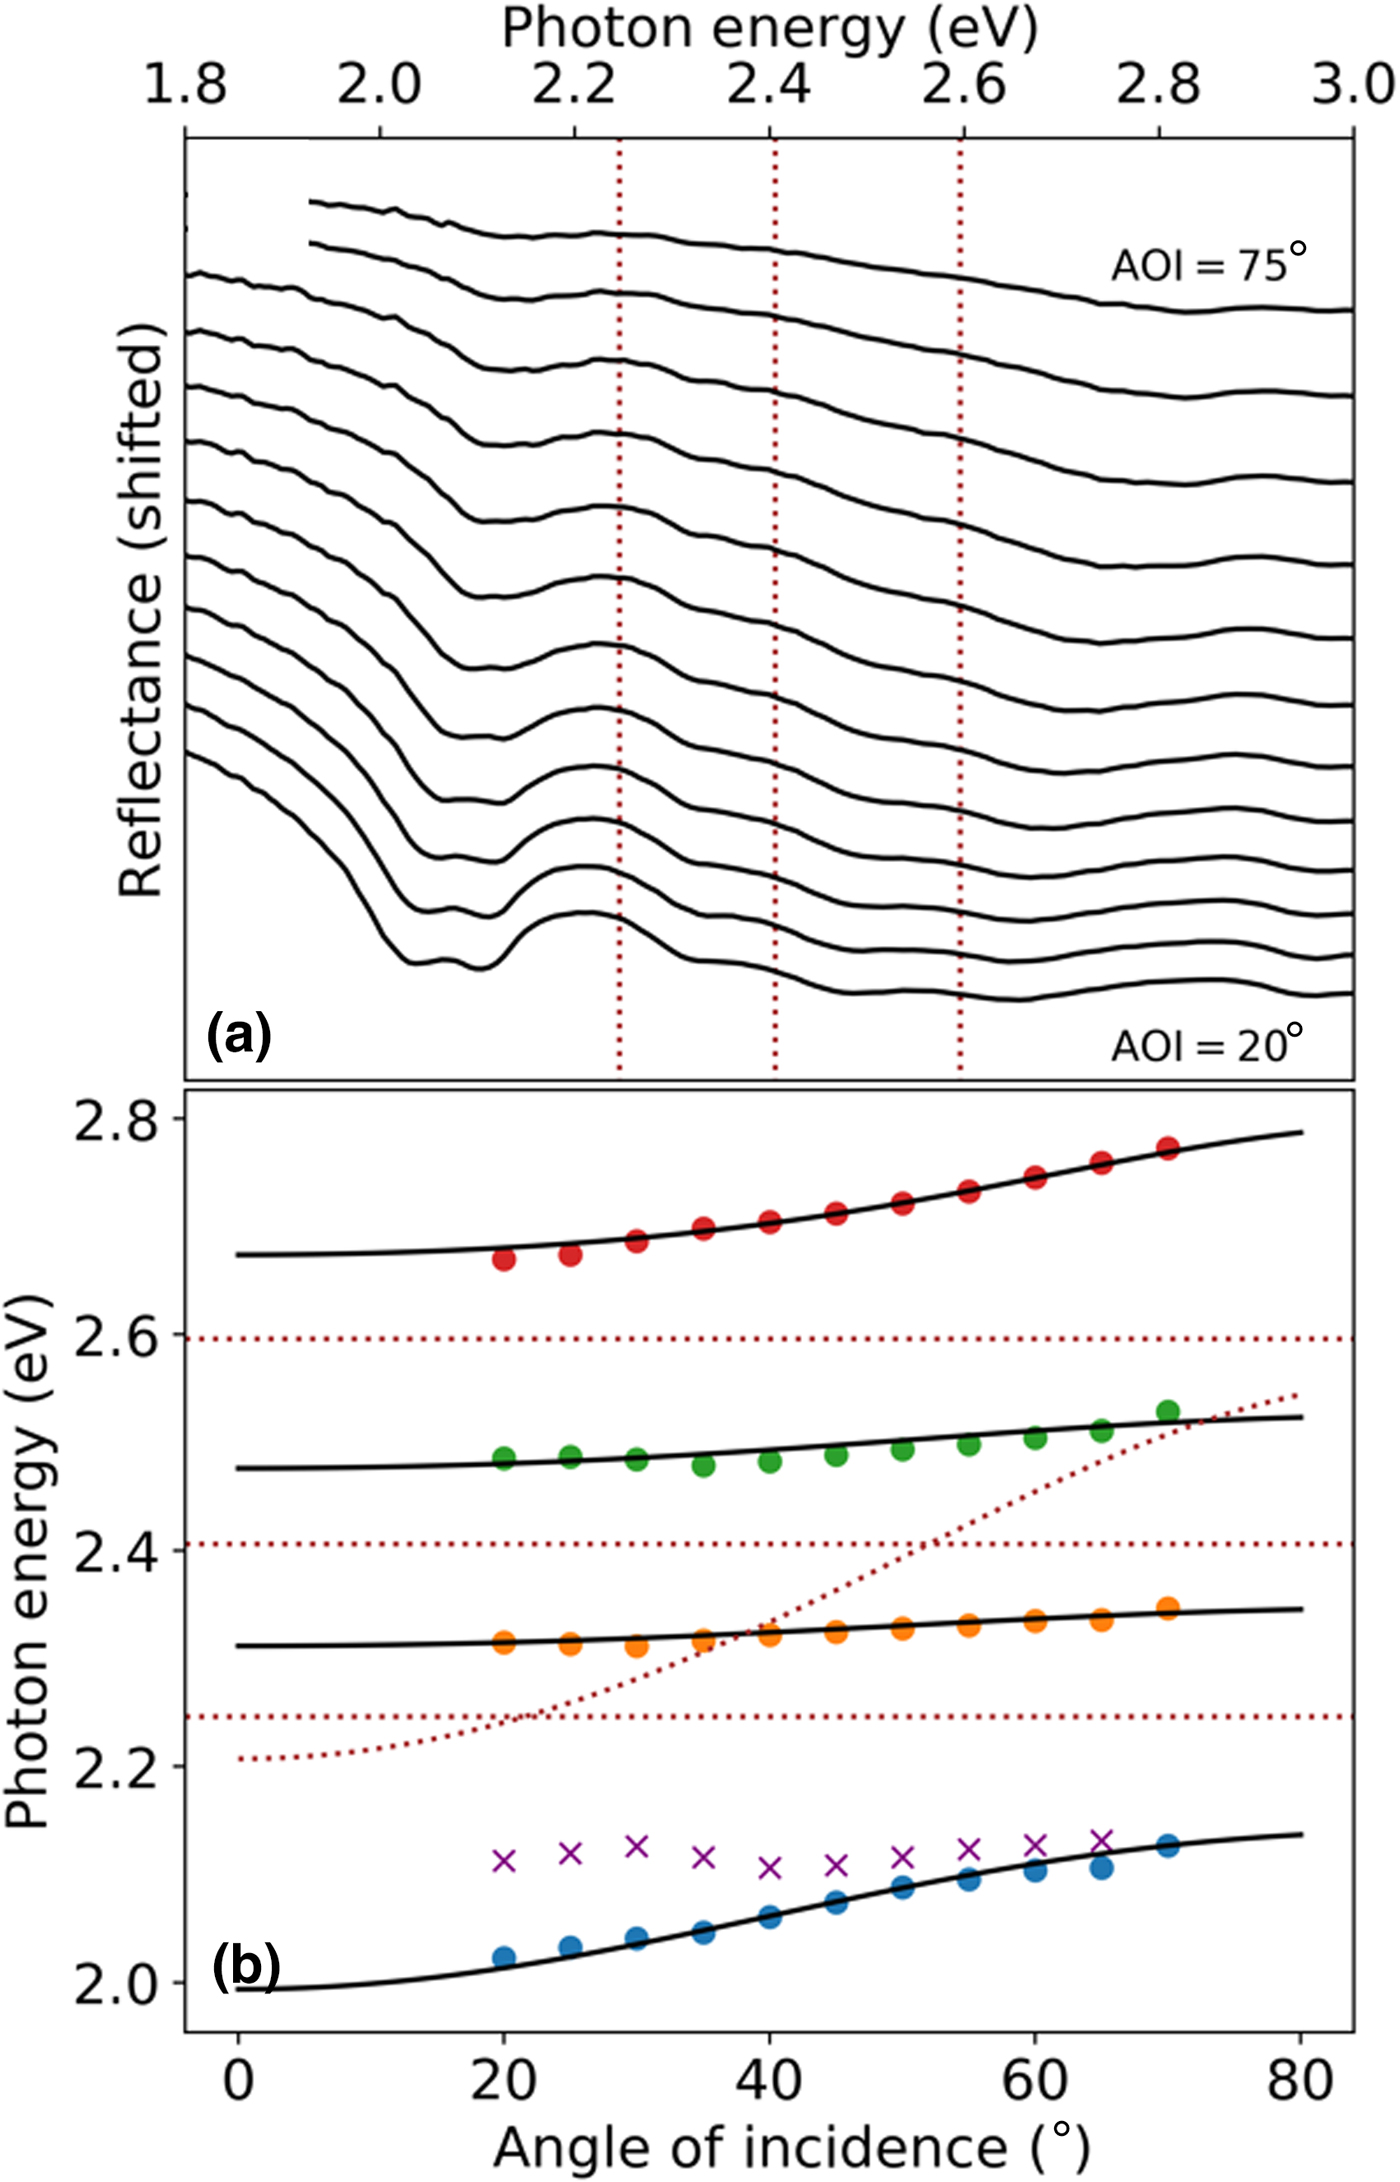
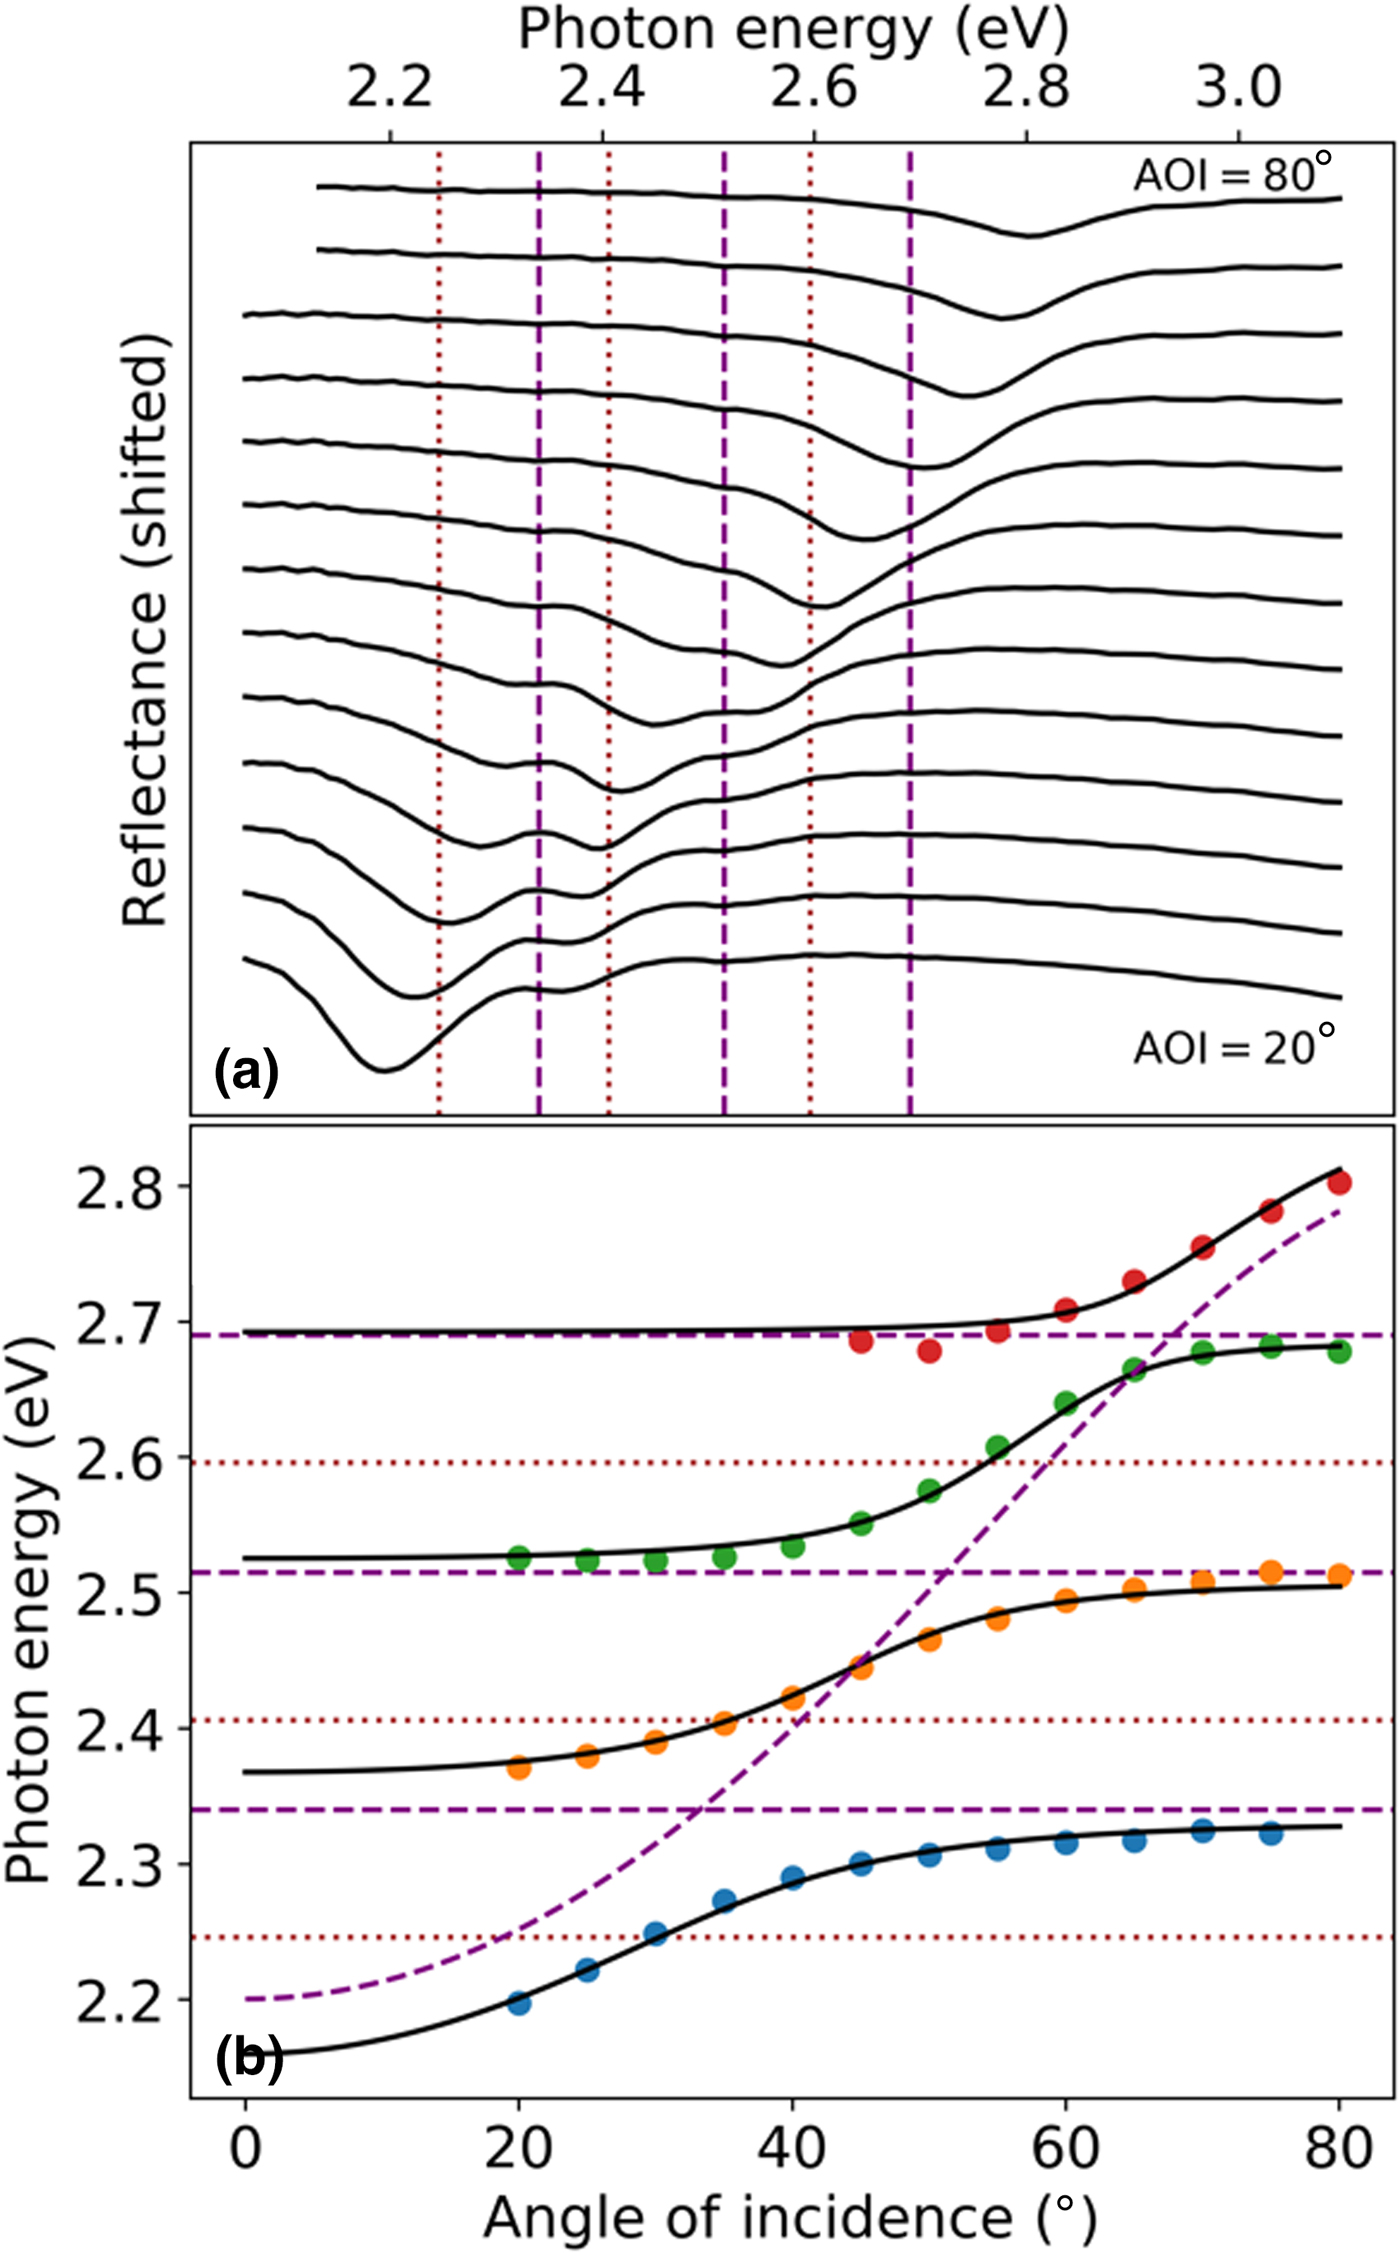
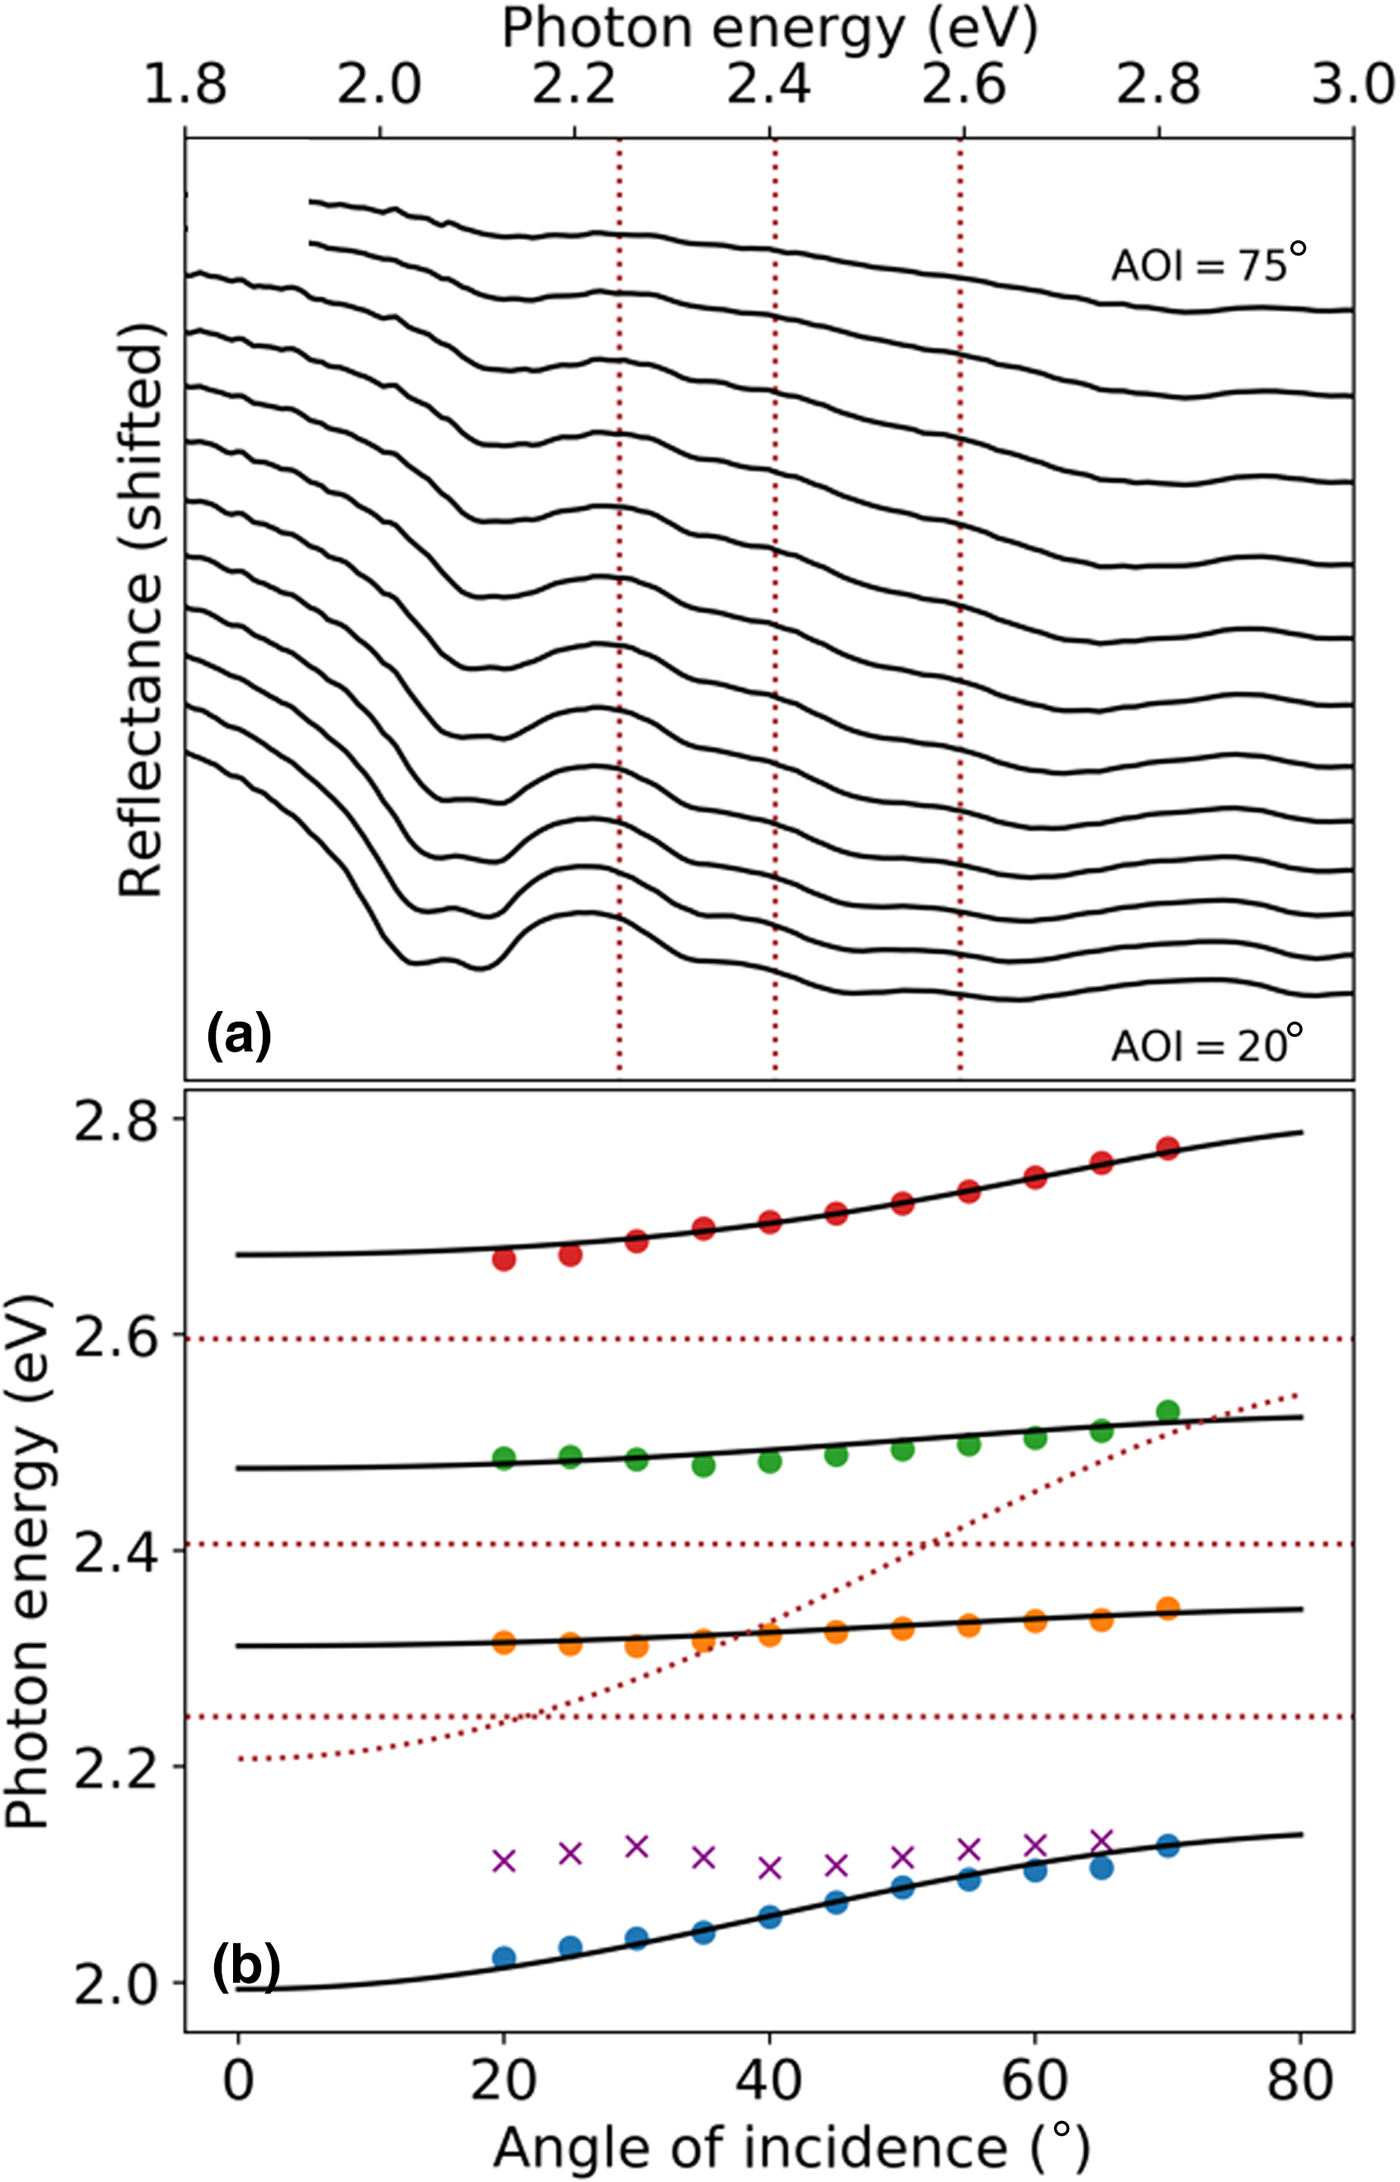
ARR from the P agg cavity is shown in Fig. 4(a), with dotted lines indicating the energies of exciton transitions in the “bare” P agg film. A pair of closely spaced resonance peaks about 150 meV below the diF TES-ADT aggregate 0–0 transition energy $(E_{0-0}^{{\rm Agg}\;{\rm Abs}} = 2.25\;{\rm eV})$ are assigned to the LP states. These energy resonances along with the next two middle polariton (MP1 and MP2) branches near 2.3 and 2.5 eV have a relatively flat dispersion, whereas the UP branch has a stronger dispersion for s-polarized light. In the modeling of the resonance energies with Eq. (2), only the lower-energy LP branch was utilized since only the lower-energy branch [dots in Fig. 4(b) and Supplementary Fig. S7] exhibited the dispersion trend expected for an LP branch, as discussed further below. The data modeled with Eq. (2) yielded couplings V 1, V 2, V 3 of 170, 160, and 160 meV (150, 130, and 150 meV), respectively, for s- (p-) polarized light (Fig. 4(b) and Supplementary Table S1). The corresponding Rabi splittings, after correction for broadening using Eq. (4), are 340, 310, and 310 meV (300, 260, and 300 meV) for s- (p-) polarizations.
(a) Angle-resolved s-polarized reflectance from cavity P agg with a thickness of 120 nm. Exciton energies of diF TES-ADT aggregates in “bare” P agg films are indicated by dotted brown lines. (b) Energies for the LP, MP1, MP2, and UP extracted from (a), at various angles of incidence, are shown as dots (colored to differentiate each polariton branch). The higher energy of the split LP pair is also indicated with purple crosses, though it was not utilized during fitting. The solid black lines show the polariton dispersion fit using the coupled oscillators model [Eq. (2)]. Energies of excitons (dotted brown lines) in “bare” film, as well as of the cavity photon energies of Eq. (5), are also included.
Discussion
In dilute diF TES-ADT:PMMA blends, in which optical properties are dominated by those of isolated diF TES-ADT molecules, the trend in the interaction energies V was consistent with a linear scaling with the square root of the diF TES-ADT concentration (Fig. 2), as expected from Eq. (5). The obtained Rabi splittings of 28–45 meV are considerably lower than those of ~200–300 meV observed in all-metal cavities of J-aggregates dispersed in polymers,[Reference Hobson, Barnes, Lindzey, Gehring, Whittaker, Skolnick and Walker7] but within the range of, for example, ~20–70 meV obtained in distributed Bragg reflector (DBR)-based cavities of pseudoisocyanine in gelatin.[Reference Suzuki, Sakata, Takenobu, Uemura, Miyagawa, Nakanishi and Tsurumachi26] As the diF TES-ADT concentration increases, spectral features of diF TES-ADT isolated molecules and of their aggregates coexist in the spectra of “bare” films (Fig. 1) and the nature of exciton–photon coupling changes. For example, in the P 1.5 film, spectral fitting to two vibronic progressions (corresponding to those due to isolated molecules and due to aggregates) reveals a 50:50 contribution of isolated molecules and of aggregates to the overall s-polarized spectra (Supplementary Fig. S8). Yet, only the “isolated” molecules in this film couple efficiently to the cavity (Fig. 3) exhibiting Rabi splittings of up to 160 meV, which we discuss next.
The relative absorbances of the 0-m transitions (m = 0–3) in the vibronic progression for isolated diF TES-ADT molecules in solution[Reference Van Schenck, Giesbers, Kannegula, Cheng, Anthony and Ostroverkhova22] are well described with a Frank–Condon (FC) factor: e −SS m/m! with a Huang–Rhys factor of S ≈ 0.7, so the oscillator strengths for these transitions scale with their FC factor. This is also the case for isolated molecules in diF TES-ADT:PMMA films.[Reference Shepherd, Platt, Hofer, Ostroverkhova, Loth and Anthony15] For example, in the P 1.5 “bare” film, the isolated molecules contribution to the absorption spectrum features peaks at 2.34 eV (for the 0–0 transition, red-shifted by 0.01 eV from the 0–0 transition in toluene solution, Fig. 1(a) and Supplementary Fig. S8), 2.52 eV (0–1), and 2.7 eV (0–2) with relative absorbances scaling as expected from the FC factors defined above (see Supplementary Material). When the P 1.5 film is placed in the cavity, all three resonances couple to the cavity photon and the coupling energies (V 1 = 75 meV, V 2 = 55 meV, V 3 = 35 meV) scale with the square root of their FC factors (and by extension their oscillator strength, Supplementary Fig. S9), in agreement with Eq. (5).
The optical properties of the P 1.5 “bare” film, however, have a sizable contribution of aggregated diF TES-ADT molecules to the spectra (Fig. 1 and Supplementary Fig. S8). If the exciton–photon coupling energies for aggregates $V_i^{{\rm Agg}}$ also scaled with the square root of their oscillator strengths (as is seen for isolated molecules), then the ratio of the 0–0 absorbances of the isolated molecules and of aggregates in the P 1.5 film (0.95 for s-polarization, Supplementary Fig. S8) would predict the ratio $V_1^{{\rm Iso}} /V_1^{{\rm Agg}} \sim 1$
 . With the observed value $V_1^{{\rm Iso}}$
 of ~75 meV, the expected value $V_1^{{\rm Agg}}$
 would be about 75 meV. However, this was not observed in our experiments which suggest that the actual $V_1^{{\rm Agg}}$
 value is considerably smaller.
Differences in the exciton-photon coupling energies for different exciton species were previously observed in other heterogeneous systems. For example, in poly(9,9-dioctylfluorene) all-metal cavities with coexisting glassy and crystalline phases, a factor of ~3 smaller ratio of the Rabi splittings for the “ordered” (crystalline phase) versus “disordered” (glassy phase) was observed compared to the value expected from the ratio of the square root of the corresponding oscillator strengths.[Reference Roux and Bradley10] The findings were explained by only a partial contribution of the oscillator strength for the “ordered” population to the Rabi splitting although the precise physical mechanism behind this observation was not identified. In Rhodamine 800 dye:PMMA films strongly coupled to the surface plasmon polariton,[Reference Valmorra, Broll, Schwaiger, Welzel, Heitmann and Mendach27] the lack of scaling of the Rabi splitting with the oscillator strength for the two exciton transitions was also observed. This was explained by a factor of ~3.5 difference in the linewidth (oscillator damping): the transitions with a broader linewidth had a lower Rabi splitting, in spite of the higher oscillator strength. In our P 1.5 films, however, the linewidth for the absorption spectra of aggregates was comparable to that for the isolated molecules (e.g., 54 and 56 meV for the 0–0 transition for aggregates and isolated molecules, respectively, Supplementary Fig. S8), which rules out this argument.
There is an additional consideration about the distribution and orientation of diF TES-ADT aggregates in the P 1.5 film of potential relevance to the exciton–photon coupling. The aggregates are not randomly oriented in film as seen both from the increasing contribution of aggregates to the optical spectra at p-polarizations at a larger angle of incidence (Supplementary Fig. S10) and the preferential (00l) orientation of crystallites revealed by x-ray diffraction measurements (XRD; Supplementary Fig. S5). Additionally, it has been previously shown[Reference Lee, Lim, Kwak, Cho, Lee, Choi and Cho28] for a nonfluorinated TES-ADT derivative that the TES-ADT distribution in spin-cast TES-ADT:PMMA films is nonuniform along the substrate normal, with the TES-ADT aggregates favoring the film–air interface. Given this, and the preference of diF TES-ADT aggregates in our samples to align with respect to the film interfaces evidenced by XRD, it is likely that the diF TES-ADT aggregates are situated predominantly at the mirror–film interfaces. These aggregates would not effectively couple to the cavity since the cavity electric field is not constant along the substrate normal; rather it approaches zero at the regions adjacent to the mirrors.[Reference Ebbesen29] Thus, only the isolated diF TES-ADT molecules—isotopically distributed in the film—couple efficiently to the cavity.
In films with higher diF TES-ADT concentrations, dominated by the diF TES-ADT aggregates (P agg), relatively high exciton–photon coupling energies V of up to 170 meV were observed, even though only a subset of aggregates interacts efficiently with the cavity electric field. These coupling energies are higher than those of up to 108 meV obtained in Ac single crystals in DBR cavities[Reference Kéna-Cohen, Davanço and Forrest12] and are comparable with J-aggregate dye:polymer films at high dye concentrations in all-metal cavities.[Reference Hobson, Barnes, Lindzey, Gehring, Whittaker, Skolnick and Walker7] The nature of these cavity-coupled aggregate states are more complicated than their isolated molecule counterparts. For example, the coupling energies V 1, V 2, V 3 of 170, 160, and 160 meV, obtained as a result of coupling of the 0–0, 0–1, and 0–2 transitions in the aggregate absorption spectra (Supplementary Fig. S11) to the cavity, do not scale with the oscillator strengths of these transitions in the P agg “bare” films (Supplementary Fig. S12), in contrast to observations with isolated molecules (Supplementary Fig. S9). This suggests that the three excitonic resonances in the P agg film cannot be considered independent oscillators. The intermolecular interactions in diF TES-ADT aggregates (characterized by an exciton bandwidth of ~60 meV in, for example, polycrystalline pristine diF TES-ADT films[Reference Platt, Kendrick, Loth, Anthony and Ostroverkhova21]) could give rise to a redistribution of oscillator strength in the polariton states relative to their excitonic constituents.[Reference Roux and Bradley10,Reference Herrera and Spano30] More work is needed to establish the nature of these aggregate-based polaritonic states.
Finally, there is an additional feature observed in aggregate cavities P agg as compared to any other cavities P d. The LP branch (Fig. 4) appears to be split, which is especially pronounced at lower angles of incidence and has a stronger angle dependence in the p-polarization as compared with s-polarization (Supplementary Fig. S13). Splitting of the LP has been previously observed in organic crystals placed in the microcavities. For example, in polycrystalline Tc films and Ac single crystals, the LP splitting was attributed to two polarized Davydov components which coupled differently to the cavity. This mechanism relies on the presence of Davydov splitting in the absorption spectra of “bare” organic crystalline solids with two molecules per unit cell.[Reference Kena-Cohen and Forrest11,Reference Kéna-Cohen, Davanço and Forrest12] DiF TES-ADT favors a brick-work-type molecular packing, with one molecule per unit cell. Although polymorphism has been previously reported in single crystals of this derivative, molecular packing motifs which would cause Davydov splitting in the diF TES-ADT spectra were not observed.[Reference Paudel, Giesbers, Van Schenck, Anthony and Ostroverkhova14] Nevertheless, it is possible that the coexistence of two polymorphs with only slightly different crystal structures[Reference Paudel, Giesbers, Van Schenck, Anthony and Ostroverkhova14] could play a role in the observed splitting. In cyano-substituted thiophene/phenylene crystals in microcavities, birefringence in a triclinic crystal that mixed two orthogonally polarized photon modes was invoked to explain the structure of the LP polariton.[Reference Ishimura, Amashita, Anagi and Akayama20] In our P agg cavities, no such mixing occurred, which rules out this mechanism, and so the nature of the splitting requires further investigation.
Conclusion
We analyzed exciton–photon coupling in diF TES-ADT:PMMA films, at various concentrations of the organic semiconductor molecule diF TES-ADT, in all-metal low-Q cavities. In dilute samples (low concentrations of diF TES-ADT), the exciton–photon interaction energy increased with the diF TES-ADT concentration yielding Rabi splittings of up to ~45 meV at the diF TES-ADT average spacing of 2.5 nm. At intermediate diF TES-ADT concentrations, where the optical properties of diF TES-ADT:PMMA films were determined by the interplay of the contributions of isolated diF TES-ADT molecules and of their aggregates, preferential strong coupling of the isolated molecules to the cavity was observed, with the Rabi splitting reaching ~160 meV. In these cavities, the cavity coupling with the 0–0 transition and with the 0–1, and 0–2 vibronic replica peaks for the isolated molecules scaled with the square root of the oscillator strength, consistent with theoretical predictions. The coupling of the aggregates to the cavity in these films, however, was strongly affected by a nonuniform distribution of aggregates in the film, which diminished the exciton–photon interaction. In highly concentrated films, where diF TES-ADT aggregates dominated the optical properties, Rabi splittings of up to 340 meV were observed, in spite of only a subset of aggregates coupling to the cavity. This work lays foundations for establishing polariton properties in diF TES-ADT-containing films in microcavities. However, more studies are needed to develop a quantitative understanding of coupling of aggregated diF TES-ADT molecules to the cavity in order to design (opto)electronic polaritonic devices utilizing high-performance diF TES-ADT films.
Supplementary material
The supplementary material for this article can be found at https://doi.org/10.1557/mrc.2019.101.
Acknowledgments
We thank Prof. B. Gibbons for the access to the x-ray diffraction and ellipsometry facilities and D. Haas for his assistance with ARPL measurements. This work was supported by the NSF DMR-1808258.