Introduction
A relationship between temperament factors and mental illness has long been observed, although the nature of the relationship is contested. Do temperamental factors predispose a person to mental illness, or are they a consequence of illness? Or do they perhaps exist on a spectrum with mental illness as part of the same underlying process (Clark et al. Reference Clark, Watson and Mineka1994)? The temperamental factor that is most closely associated with risk for depression is negative affectivity (NA). Broadly defined – encompassing concepts such as neuroticism and harm avoidance – it refers to a person's sensitivity to negative stimuli, with people who experience high NA tending to become easily distressed and frustrated (Watson & Clark, Reference Watson and Clark1984; Tellegen, Reference Tellegen1985).
From a neurobiological perspective, NA has been shown to modulate the activity and connectivity of brain regions that comprise the extended medial prefrontal network; the same large-scale brain network that has been implicated in depression (Price & Drevets, Reference Price and Drevets2010). Key regions of this network include the amygdala and subgenual anterior cingulate cortex (sACC), which show strong anatomical (Johansen-Berg et al. Reference Johansen-Berg, Gutman, Behrens, Matthews, Rushworth, Katz, Lozano and Mayberg2008; Beckmann et al. Reference Beckmann, Johansen-Berg and Rushworth2009) and functional connectivity (Pezawas et al. Reference Pezawas, Meyer-Lindenberg, Drabant, Verchinski, Munoz, Kolachana, Egan, Mattay, Hariri and Weinberger2005; Stein et al. Reference Stein, Wiedholz, Bassett, Weinberger, Zink, Mattay and Meyer-Lindenberg2007; Roy et al. Reference Roy, Shehzad, Margulies, Kelly, Uddin, Gotimer, Biswal, Castellanos and Milham2009). Both regions co-activate to negatively valenced stimuli, the magnitude of which is positively correlated with self-reported NA (Zald et al. Reference Zald, Mattson and Pardo2002; Haas et al. Reference Haas, Omura, Constable and Canli2007; Cunningham et al. Reference Cunningham, Arbuckle, Jahn, Mowrer and Abduljalil2010). The extent to which NA is also associated with the ‘functional connectivity’ of these regions (i.e. their coordinated activity over time) has been less studied, though there is evidence that connectivity measures represent strong predictors of individual differences in complex behavioral traits (van den Heuvel & Hulshoff Pol, Reference van den Heuvel and Hulshoff Pol2010). NA has been reported to show negative correlation with the strength of amygdala–sACC connectivity during a task in which participants processed negative affective stimuli (Pezawas et al. Reference Pezawas, Meyer-Lindenberg, Drabant, Verchinski, Munoz, Kolachana, Egan, Mattay, Hariri and Weinberger2005) – that is, participants with high levels of NA showed reduced connectivity. This result is in contrast to studies in depressed participants, in which the regions have been reported to show both increased activation to negatively valenced stimuli (Sheline et al. Reference Sheline, Barch, Donnelly, Ollinger, Snyder and Mintun2001; Gotlib et al. Reference Gotlib, Sivers, Gabrieli, Whitfield-Gabrieli, Goldin, Minor and Canli2005) and increased connectivity (Matthews et al. Reference Matthews, Strigo, Simmons, Yang and Paulus2008; Almeida et al. Reference Almeida, Kronhaus, Sibille, Langenecker, Versace, Labarbara and Phillips2011; Wilson et al. Reference Wilson, Dirago and Iacono2014).
Resting-state functional connectivity MRI (fcMRI) has become a widely adopted technique for investigating brain functional connectivity, and has a number of advantages over task-based activation studies. The task-free nature of the approach increases the generalizability of the imaging findings, and makes comparison between studies more straight-forward. The lack of requirement for task-based performance is particularly useful in longitudinal imaging studies, where re-testing participants with the same experimental paradigm can be confounded by practice and learning effects (although less important with a long gap between test sessions), and by continuing cognitive development. Resting-state fcMRI has good test–retest reliability, particularly for connectivity between regions associated with the extended medial prefrontal network (Shehzad et al. Reference Shehzad, Kelly, Reiss, Gee, Gotimer, Uddin, Lee, Margulies, Roy, Biswal, Petkova, Castellanos and Milham2009; Van Dijk et al. Reference Van Dijk, Hedden, Venkataraman, Evans, Lazar and Buckner2010). While a resting-state fcMRI study has confirmed increased amygdala–sACC connectivity in depressed participants (Connolly et al. Reference Connolly, Wu, Ho, Hoeft, Wolkowitz, Eisendrath, Frank, Hendren, Max, Paulus, Tapert, Banerjee, Simmons and Yang2013), there have not been any resting-state fcMRI studies that have examined how amygdala–sACC connectivity is correlated with NA. Nor have there been any studies that have examined how changes in the connectivity of these regions are associated with concurrent changes in NA, or with the onset of depression.
In our examination of resting-state fcMRI parameters from a longitudinal cohort study of adolescents – which was designed to, among other things, investigate temperamental risk factors for emerging psychiatric disorders – we had a number of aims. We wanted to examine the cross-sectional relationship between amygdala–sACC connectivity and NA. Our hypothesis was that these factors would show a positive correlation. The longitudinal nature of the study allowed us to explore our second aim, which was to examine whether change in levels of NA over the mid-late adolescent period would be tracked by changes in amygdala–sACC connectivity. While NA is a relatively stable trait measure, it does show some fluctuation, especially over the adolescent period (Rutter, Reference Rutter1987). An additional aim was to examine participants who developed a first episode of major depressive disorder (MDD) between assessments, and determine how amygdala–sACC connectivity was related to its onset: would participants who developed MDD demonstrate higher amygdala–sACC connectivity at baseline, or would connectivity increase following depression onset? Our hypothesis was that both would occur.
Method
Participants
Participants were part of a longitudinal study of adolescent development that was examining risk and resilience factors for depression during adolescence (Whittle et al. Reference Whittle, Yap, Yucel, Fornito, Simmons, Barrett, Sheeber and Allen2008; Yap et al. Reference Yap, Allen and Ladouceur2008). Initially, 2479 final-year primary school students (grade 6, ages 10–12 years) in 97 schools in metropolitan Melbourne, Australia, completed the revised Early Adolescent Temperament Questionnaire (EATQ-R; Ellis & Rothbart, Reference Ellis and Rothbart2001). From the larger sample, 415 students were selected such that their scores on the NA and effortful-control subscales of the EATQ-R formed uniform distributions. That is, participants were selected from the following ranges of scores on NA and effortful control: 0–1, 1–2, 2–2.5, and 2.5 standard deviations (s.d.s) above and below the mean. A total of 243 participants without a history of MDD consented to one or more assessments at the first time-point (T1). Participants were followed up at approximately 2-yearly intervals, and underwent resting-state fMRI at their two most recent assessments (T3 and T4): 140 participants completed the scanning session at T3, and 112 at T4. For the present study we selected only those participants who had undergone fMRI at both T3 and T4 time-points, and who had no history of mental illness at T3 according to assessment with the Schedule for Affective Disorder and Schizophrenia for School-age Children: Present and Lifetime (K-SADS-PL; Kaufman et al. Reference Kaufman, Birmaher, Brent, Rao, Flynn, Moreci, Williamson and Ryan1997). Of the 97 participants who had scans at both T3 and T4, 33 were excluded because of history of mental illness at the time of the T3 scan. A further six participants were excluded following analysis of the scanning data: one because of excessive motion (>3 mm in the z plane), three because of significant imaging artifacts, and two because in post-scan debriefing they reported falling asleep in the scanning session. The remaining 56 participants (25 females, four left-handed) were included in the analysis; their mean age at the time of the T3 scan was 16.5 years (s.d. = 0.5) and at T4, 18.8 years (s.d. = 0.5). The participants were drawn from regions of relative socioeconomic advantage: they had a mean SEIFA score (http://www.abs.gov.au/websitedbs/censushome.nsf/home/seifa) in the 7.9th decile (s.d. = 2.3).
Participants completed the EATQ-R at both time-points. The NA factor assesses a person's tendency to experience negative emotions, particularly frustration and irritability (Putnam et al. Reference Putnam, Ellis, Rothbart, Eliasz and Angleitner2001), and includes items such as ‘it frustrates me if people interrupt me when I'm talking’, and ‘I get irritated when I have to stop doing something that I am enjoying’. At both time-points the participants were administered the K-SADS-PL to assess present and lifetime history of mental illness. The extent of depressive symptoms was further assessed with the Center for Epidemiological Studies Depression scale (CES-D; Radloff, Reference Radloff1977). In the interval between T3 and T4, eight of the 56 participants (14%, four female) developed a first-episode MDD, consistent with reported incidence rates of depression onset in this age group (Lewinsohn et al. Reference Lewinsohn, Rohde and Seeley1998). None were depressed at the time of the T4 assessment. Of the eight participants, three had not received treatment, four had seen a counselor or therapist, and one had been treated with fluoxetine. While none of the participants met criteria for MDD on K-SADS assessment at T4, there was evidence of residual depressive symptoms at T4 [participants with MDD: CES-D = 17.7 (s.d. = 11.7); without MDD: CES-D = 7.5 (s.d. = 7.7); t 54 = −3.2, p = 0.002].
Image acquisition and preprocessing
A 3-T Siemens Magnetom Trio (Siemens, Germany) was used to acquire whole-brain functional T2*-weighted echo-planar images at both time-points. Functional sequences consisted of gradient-recalled acquisition in the steady state (time of repetition, 1400 ms; time of echo, 30 ms; flip angle, 90°) within a field of view of 120 mm, and a voxel size of 3.3 × 3.3 × 5.0 mm. Twenty-four interleaved slices were acquired parallel to the anterior-posterior commissure line, with particular attention paid to ensuring good coverage of ventral brain areas. Complex fieldmaps were also acquired to correct for distortion caused by magnetic field inhomogeneities. For each participant, a single 11.9-min continuous functional sequence was acquired, generating 510 whole-brain echo-planar imaging volumes. In addition, a high-resolution T1-weighted anatomical image was acquired for each participant to aid registration of the functional images to standard space. During scanning participants were instructed to relax, stay awake, and lie still without moving while keeping their eyes closed.
Imaging data were transferred and processed on an Apple OSX platform running MATLAB v. 7 (MathWorks, USA). Image preprocessing was performed in Statistical Parametric Mapping 8 (SPM8; http://www.fil.ion.ucl.ac.uk/spm/). Motion correction was performed by aligning each participant's time-series to the first image using least-squares minimization and a six-parameter rigid-body spatial transformation, and fieldmaps were applied to unwarp the images using the SPM8 algorithms. The realigned and unwarped functional sequences were then co-registered to each participant's respective anatomical scan, also using a six-parameter rigid-body transformation. Anatomical scans were segmented into gray matter, white matter and cerebrospinal fluid (CSF) tissue classes using the ‘new segment’ algorithm in SPM8, and spatially normalized to the International Consortium for Brain Mapping template. The deformation parameters were then applied to the co-registered functional images, which were resliced to 2 mm isotropic resolution. Functional images were smoothed with a 6 mm (full-width half-maximum) Gaussian filter. With this preprocessing strategy we ensured that functional scans were in the same stereotaxic (Montreal Neurological Institute) space as the anatomical segments of gray matter, white matter, and CSF. All image sequences were routinely inspected for potential normalization artifacts.
Functional connectivity analyses
We performed a seed-based functional connectivity analysis of the resting-state time-series to assess amygdala connectivity at both time-points. The left and right amygdalae were defined using the WFU PickAtlas (http://fmri.wfubmc.edu/software/PickAtlas). The time-courses were extracted from each amygdala for each participant. In addition to our signals of interest we derived estimates of white matter, CSF, global brain signal fluctuations, and motion parameters to include in the regression analyses. The segmented white matter and CSF images were thresholded at 50% tissue-probability type and binarized to create nuisance masks, together with a binary mask of the global brain volume (summed from the gray matter, white matter, and CSF segments). Time-courses were then extracted for each mask; they are included in resting-state functional connectivity analyses because they reflect signal fluctuations of non-neuronal origin (e.g. physiological artifacts associated with variables such as cardiac and respiratory cycles, CSF motion, and scanner drift) (Fox et al. Reference Fox, Corbetta, Snyder, Vincent and Raichle2006).
Statistical analysis
Functional connectivity maps were estimated for each amygdala by including the seed and nuisance signals as predictors of interest and no interest, respectively, in whole-brain, linear regression analyses. Prior to model estimation, each of the nuisance covariates were orthogonalized (using an iterative Gram–Schmidt method) and then removed from each seed's time-series by linear regression, resulting in a general linear model for each hemisphere that comprised a ‘noise-cleaned’ amygdala time-course and orthogonal nuisance variables (Harrison et al. Reference Harrison, Soriano-Mas, Pujol, Ortiz, Lopez-Sola, Hernandez-Ribas, Deus, Alonso, Yucel, Pantelis, Menchon and Cardoner2009). A high-pass filter set at 128 s was used to remove low-frequency drifts of less than approximately 0.008 Hz. Contrast images were generated for each participant by estimating the regression coefficient between brain voxels and each seed's time-series.
The mean contrast image created from the left and right amygdala connectivity maps for each participant was included in second-level random-effects analyses, which were conducted separately for T3 and T4 time-points. NA was included as the covariate of interest. The mean level of motion for each participant was included as a second covariate, calculated by taking the mean absolute displacement of each brain volume compared to the previous volume in the x, y and z directions (Van Dijk et al. Reference Van Dijk, Sabuncu and Buckner2012). For our primary analysis we restricted our examination of amygdala connectivity to a sACC mask, which was defined by the Brodmann area-25 label in the WFU PickAtlas: it had a volume of 1647 voxels (13 176 mm3) – see online Supplementary Fig. S1. The extent and strength of the correlation between amygdala connectivity and NA was characterized by thresholding the statistical maps at various cluster-forming levels (p < 0.05, 0.01, 0.005, 0.001), family-wise error-corrected (p FWE < 0.05) using Monte-Carlo simulations as implemented by the 3dClustSim tool in AFNI (http://afni.nimh.nih.gov). In further exploratory analyses, correlations between amygdala connectivity and NA were calculated for the whole brain for each time-point.
The relationship between change in connectivity and change in NA was examined by extracting the first eigenvariate from a 3.5 mm sphere around the voxel in the sACC cluster that showed most significant amygdala connectivity across both time-points (derived from a mean image of the T3 and T4 contrast images). Residualized change scores were calculated for connectivity and NA by regressing follow-up scores on baseline scores for each measure – the use of residualized change scores has the effect of controlling for regression to the mean (Cronbach & Furby, Reference Cronbach and Furby1970) – and correlation between the residualized change scores was calculated using SPSS Statistics 21 (IBM, USA). Participants who developed MDD in the interval between T3 and T4 were compared to participants who did not develop MDD by (i) comparing their functional connectivity parameters at T3 to determine whether these predicted onset of depression; and (ii) by including them in a 2×2 ANOVA [diagnosis (MDD, no MDD) by time (T3, T4)] and determining whether there was a main effect of diagnosis, or interaction between diagnosis and time. A similar analysis was performed for diagnosis and NA.
Results
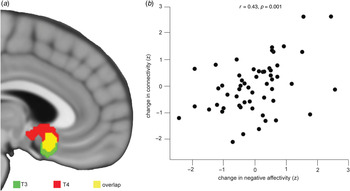
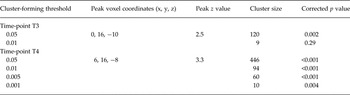
The amygdala showed significant positive connectivity with sACC at each time-point (see online Supplementary Table S1 and Fig. S2 for illustration of whole-brain amygdala connectivity). Overlapping clusters in sACC showed significant positive correlation between their connectivity with the amygdala and NA at both time-points (Table 1, Fig. 1). At T3, a significant sACC cluster showed correlation between amygdala connectivity and NA at a cluster-forming threshold of p < 0.05, while at T4 significant sACC clusters were evident at all thresholds examined. At T3, exploratory whole-brain analysis discovered no additional regions showing correlation between amygdala connectivity and NA, while at T4, three additional regions showed positive correlation between amygdala connectivity and NA at T4. These were the left orbitofrontal cortex, and left and right precuneus (online Supplementary Table S2).
The relationship between amygdala–subgenual anterior cingulate cortex (sACC) connectivity and negative affectivity (NA). Amygdala–sACC connectivity showed significant correlation with NA at both T3 and T4 time-points (a). The figure shows corrected clusters (p FWE < 0.05) at a cluster-forming threshold of p < 0.05. An examination of the relationship between residualized changes in amygdala–sACC connectivity and NA demonstrated significant positive correlation (b).

Probabilities of subgenual anterior cingulate cortex clusters showing significant correlation between their connectivity with amygdala and negative affectivity at different cluster-forming thresholds

Assessment of NA scores at each time-point revealed moderately high T3–T4 correlations (r = 0.63), which were higher than for CES-D (r = 0.34). Longitudinal assessment of the connectivity data demonstrated a significant positive correlation between change in the strength of amygdala–sACC connectivity and NA over time, i.e. between assessments T3 and T4. Specifically, a change in the connectivity of these regions predicted 18% of the variance of change in NA (r = 0.43, p = 0.001; Fig. 1).
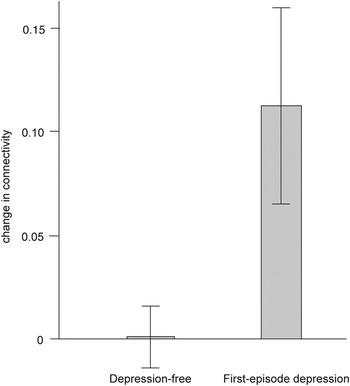
Between T3 and T4 eight of the 56 participants developed a first episode of MDD. At T3, there were no significant differences in amygdala–sACC connectivity between participants who did and did not develop MDD (t 54 = 1.6, p = 0.11). Factorial analysis, however, showed a significant interaction between diagnosis and time (F 1,54 = 8.5, p = 0.005), which remained significant when adjusted for T4 CES-D score (F 1,53 = 8.2, p = 0.006). Post-hoc analyses showed that the interaction was due to a significant increase in amygdala–sACC connectivity in participants who developed MDD, with no change in connectivity in participants who did not develop MDD (Fig. 2). There was no main effect of diagnosis on amygdala–sACC connectivity (F 1,54 = 0.02, p = 0.88), although there was a main effect of time (F 1,54 = 8.7, p = 0.005), which was driven by the increase in connectivity in patients who developed depression. These results were similar when adjusted for T4 CES-D score (main effect of diagnosis: F 1,53 = 1.0, p = 0.32; main effect of time: F 1,53 = 5.3, p = 0.02). For NA, there was no difference at T3 between participants who did and did not develop MDD (t 54 = −0.7, p = 0.49), and there was no relationship between diagnosis and time (main effect of diagnosis: F 1,54 = 1.2, p = 0.27; main effect of time: F 1,54 = 2.5, p = 0.12; interaction: F 1,54 = 0.8, p = 0.38), which remained the case when adjustment was made for T4 CES-D (main effect of diagnosis: F 1,53 = 0.02, p = 0.88; main effect of time: F 1,53 = 0.1, p = 0.79; interaction: F 1,53 = 0.007, p = 0.93). We further examined whether change in NA and the onset of MDD both contributed to change in amygdala–sACC connectivity by including the variables in a multiple regression model, with change in connectivity as the dependent variable, and change in NA and onset of MDD as the independent variables. Both were significant predictors of change in connectivity (change in NA: β = 0.32, p = 0.01; onset of MDD: β = 0.26, p = 0.04).
Amygdala–subgenual anterior cingulate cortex (sACC) connectivity and the onset of first-episode depression. Factorial analysis showed a significant interaction between diagnosis and amygdala–sACC connectivity over time, which subsequent analysis showed was due to an increase in connectivity following the onset of depression. None of the participants were suffering from depression at the time of the follow-up scan. The error bars show the standard error of the mean (s.e.m).

Discussion
The study is the first to examine how temperamental NA correlates with the functional connectivity between the amygdala and sACC under resting-state conditions, and to use a within-subjects, longitudinal design to show that changes in amygdala–sACC connectivity predicted changes in NA. We demonstrated that amygdala–sACC connectivity was positively correlated with NA cross-sectionally, and that change in this connectivity over time was correlated with change in NA. The longitudinal nature of the study design provided an opportunity to examine how the onset of depression was related to NA and connectivity measures. We did not show a direct relationship between NA and depression, but demonstrated that amygdala–sACC connectivity significantly increased following the onset of a first episode of MDD. The small number of participants who transitioned to depression means that the finding is provisional, and requires a degree of circumspection. The results suggest, however, that both an increase in NA, and the experience of a first-episode depression, lead to increased amygdala–sACC connectivity.
The amygdala and sACC, which show strong anatomical and functional connectivity, are key components of the extended medial prefrontal network that is purported to underlie negative affective states (Ongur & Price, Reference Ongur and Price2000). The amygdala is activated by salience and novelty (Adolphs, Reference Adolphs2010), while sACC has projections to the hypothalamus and midbrain periaqueductal gray (An et al. Reference An, Bandler, Ongur and Price1998; Ongur et al. Reference Ongur, An and Price1998), and has a key role in the regulation of visceromotor function (Freedman et al. Reference Freedman, Insel and Smith2000). The sACC is also a component of the default network, a network of brain regions that are active at rest and that are particularly activated by tasks that involve social or self-related processing (Buckner et al. Reference Buckner, Andrews-Hanna and Schacter2008). Together the amygdala and sACC help to coordinate the somatic response to external and internal stimuli (particularly when they are socially related), which is an essential feature of temperament (Strelau, Reference Strelau1982). People who are high in NA show characteristically pronounced physiological responses to negative affective stimuli (Norris et al. Reference Norris, Larsen and Cacioppo2007; Craske et al. Reference Craske, Waters, Nazarian, Mineka, Zinbarg, Griffith, Naliboff and Ornitz2009; Reynaud et al. Reference Reynaud, El Khoury-Malhame, Rossier, Blin and Khalfa2012), and the increased coordination of activity between amygdala and sACC that we have demonstrated may provide some explanation for this.
Change in amygdala–sACC connectivity over time also corresponded with change in NA. While temperamental attributes are relatively stable, they do show a degree of fluidity, especially in young people (Rutter, Reference Rutter1987); exemplified by our finding of a temporal correlation for NA that was substantially higher than for depressive symptoms, but of moderate strength. The variance in NA likely reflects the way in which heritable predispositions, which are important for temperament, are shaped by the social environment, which is especially unstable in adolescence (Brown, Reference Brown, Lerner and Steinberg2004). One hypothesis that can be generated from our findings is that alterations in amygdala–sACC connectivity mediate the influence of environment on NA. While we specifically focused on amygdala–sACC connectivity, other brain regions are also likely to have a role in such mediation.
The positive correlation between amygdala–sACC connectivity and NA that we have demonstrated contrasts with the findings of Pezawas et al. (Reference Pezawas, Meyer-Lindenberg, Drabant, Verchinski, Munoz, Kolachana, Egan, Mattay, Hariri and Weinberger2005), who showed a negative correlation between amygdala–sACC connectivity and NA. Their study had a number of differences to the present one: it examined connectivity in a negative-stimuli v. control-task context, used a different measure of NA [‘harm avoidance’ from the Tridimensional Personality Questionnaire (Cloninger et al. Reference Cloninger, Przybeck and Svrakic1991)], and examined an adult as opposed to adolescent population. Our finding of a positive correlation between NA and amygdala–sACC connectivity is consistent with the literature that shows concurrent increased activation in both regions with high NA (Haas et al. Reference Haas, Omura, Constable and Canli2007), and is consistent with findings in depression, including from resting-state studies (Connolly et al. Reference Connolly, Wu, Ho, Hoeft, Wolkowitz, Eisendrath, Frank, Hendren, Max, Paulus, Tapert, Banerjee, Simmons and Yang2013).
A well-established body of literature holds that high NA predicts MDD (Kotov et al. Reference Kotov, Gamez, Schmidt and Watson2010; Wilson et al. Reference Wilson, Dirago and Iacono2014), and given our demonstration of a positive correlation between NA and connectivity it might have been expected that greater amygdala–sACC connectivity would precede the onset of MDD. Neither heightened connectivity nor NA, however, predicted the onset of MDD, in part perhaps due to the study having insufficient power to detect these relationships. The absence of any relationship between NA and the onset of depression was particularly surprising: in addition to our study having low power for detecting the relationship, it is possible that our measure of NA was less sensitive to the attributes of NA that predict depression.
In contrast, we found that amygdala–sACC increased following an episode of depression, lending some support to the ‘scar’ hypothesis of depression (Lewinsohn et al. Reference Lewinsohn, Steinmetz, Larson and Franklin1981). The scar hypothesis suggests that the experience of depression leaves permanent residual effects that predispose to recurrence. The evidence for such metaphorical scars occurring after depression is equivocal: while studies in adults have reported that residual depressive symptoms are common after an episode of depression, they have not demonstrated the appearance of additional psychopathological changes (Zeiss & Lewinsohn, Reference Zeiss and Lewinsohn1988; Shea et al. Reference Shea, Leon, Mueller, Solomon, Warshaw and Keller1996). However, such changes were reported in a large prospective cohort study of adolescents: following an episode of depression the affected adolescents experienced increases in their tendency to worry, affective instability and levels of hypochondriasis, over-and-above subsyndromal depressive symptoms (Rohde et al. Reference Rohde, Lewinsohn and Seeley1994). While in the present study we found an increase in amygdala–sACC connectivity following the onset of the first episode of depression, it is not yet clear that this is of clinical significance. Given that higher baseline connectivity did not predict the onset of depression, we cannot be sure that the increased connectivity observed at follow-up in participants who developed MDD would place them at higher risk of recurrence. There is however, good evidence that the experience of a first episode of depression makes a subsequent episode of depression more likely (Monroe & Harkness, Reference Monroe and Harkness2011), making it is quite possible that the neurobiological predictors of a first episode of depression differ from predictors of recurrent episodes (Post & Weiss, Reference Post and Weiss1998).
While the prospective longitudinal design is a particular strength of the study, allowing us to examine brain connectivity patterns in participants both before and after a first episode of depression, it also provides its main limitation; that is, the small number of participants who transitioned to a first episode of depression leaves this component of the study relatively underpowered. Our finding that amygdala–sACC connectivity increases following an episode of depression must be considered therefore to be provisional, and needs replication. The study was well powered, however, to examine correlations between NA and brain connectivity, and provides more direct evidence than previous studies of how variation in amygdala–sACC connectivity is associated with variation in NA.
The study raises perhaps more questions than it answers about the relationship between NA and depression. We have demonstrated that both an increase in NA and the onset of depression independently predict an increase in amygdala–sACC connectivity, without the variables themselves appearing to influence one another. The study highlights the key role of amygdala–sACC connectivity in the broader experience of negative affect. The nature of the relationship between NA, amygdala–sACC connectivity and the onset of depression requires confirmation with larger longitudinal cohorts, the feasibility of which is enhanced by the use of task-free resting-state fMRI. Task-based studies also have a useful role in determining how these changes in connectivity give rise to the specific phenomena that underlie NA and depression.
Supplementary material
For supplementary material accompanying this paper visit http://dx.doi.org/10.1017/S0033291714002001.
Acknowledgements
The research was supported by grants from the Colonial Foundation, the National Health and Medical Research Council (Program Grant 350241), and the Australian Research Council (Discovery Grant DP0878136). Drs Davey, Whittle and Harrison are supported by National Health and Medical Research Fellowships (IDs 628509, 1007716 and 628509).
Declaration of Interest
None.