Financial development usually occurs if the “correct” set of institutions and laws are in place. The legal origins theory argues that these are largely determined by a country's legal family (Beck, Demirgüç-Kunt, and Levine 2003; La Porta et al. 1997, 1998, 2000; La Porta, Lopez-De-Silanes, and Shleifer 2008; Levine 1999). Political economy theories, on the other hand, argue that the institutions in place will largely be determined by a country's political system, which can be influenced by exogenous shocks such as wars or changes in openness to trade (Rajan and Zingales 2003; Roe 2006; Perotti and Von Thadden 2006; Roe and Siegel 2009). In this article, we examine the evolution of the U.K. domestic corporate debt market from its inception in the middle of the nineteenth century until the twenty-first century in an attempt to understand the role played by law in the development of financial markets.
Using annual data for the period 1860–2002, we find that after nearly 50 years of growth from 1860 onwards, the U.K. corporate bond market experienced a great reversal in the twentieth century. After a post-1945 renaissance, the U.K. corporate bond market went into permanent decline in the 1970s. The collapse of this market in the 1970s meant that it was smaller in real terms than it had been in the 1870s. In terms of the number of traded corporate bonds, the U.K. corporate bond market was smaller in the 1990s than it had been a century earlier.
The proponents of the law and finance hypothesis argue that legal origin and investor protection laws determine financial development (La Porta et al. 1997, 1998; La Porta, Lopez-De-Silanes, and Shleifer 2008). However, despite its historical nature, most of the tests of this hypothesis have been cross-sectional and ahistorical in nature.Footnote 1 One notable exception is Aldo Musacchio (2008a, 2010) who finds little evidence to support the law and finance hypothesis and suggests that to comprehend the variation in modern financial development, we need to understand the effect of the catastrophic events of the twentieth century.Footnote 2 In this article, we examine changes in U.K. creditor protection from 1860 to 2002 to see if it is driving the development of the U.K. corporate bond market. As such, this is one of the first long-run times series tests of the law and finance hypothesis.Footnote 3 As the creditor protection score remains high (at four out of four) for the United Kingdom over this entire period, it cannot possibly explain the variation over time in the size of the bond market.
Given that law does not explain the variation in bond market size over time, in this article we also explore what was driving the development of the bond market, particularly its post-1945 renaissance and its post-1970 demise. We have two hypotheses: (a) inflation explains the post-1970 demise of the U.K. bond market, and (b) tax changes which affected the capital structure preferences of firms explain the post-1945 renaissance of the market. The demise that preceded the postwar renaissance was mainly due to the nationalization of many large companies which issued bonds. Using data on bond returns and issues, we find that inflation plays a major part in the demise of the U.K. corporate bond market. In addition, our evidence reveals that companies took advantage of the increased tax shield in the post-1945 era by issuing more bonds. Inflation and tax changes, however, are only proximate causes of changes in the U.K. bond market, since they reflect broader macroeconomic policy goals.
Richard S. Grossman (2002, p. 128) has suggested that the growth of the corporate bond market in late Victorian Britain is an important agenda requiring further research. Our article not only measures the growth of the corporate bond market in the Victorian period by providing annual estimates of its size and performance, but we also place this initial growth in the context of its long-term twentieth-century demise. Although the historiography of British capital markets has discussed the use of corporate bonds by nineteenth-century companies (Jefferys 1977, pp. 241–92), institutional and individual investors in debentures (Raynes 1928; Sheppard 1971, pp. 154–56; Scott 2002; Maltby et al. 2011; Michie 2011, p. 163; Rutterford et al. 2011), and the interwar issuance of debt (Grant 1967, p. 166; Thomas 1978, p. 36; Chambers 2010, p. 57), there have been no studies which have examined the size, performance, and drivers of the market over the long run. In terms of the performance of the corporate bond market, K. C. Smith and G. F. Horne (1934) as well as Edelstein (1976, 2010) assess the returns on a limited number of high-class corporate bonds for 1867–1933 and 1870–1913 respectively.Footnote 4 In contrast, our examination of performance looks at the nearly all traded corporate bonds from 1860 to 2002. Apart from Musacchio (2010), who has developed several point estimates for the early twentieth century, we know of no other attempt to assess the size of the U.K. domestic corporate bond market over the long run.
This article augments the small but growing literature which examines the effect of legal protection and origins on financial development from an historical perspective.Footnote 5 As with the vast majority of this literature, this article finds little evidence to support the law and finance hypothesis.Footnote 6
The findings of our article may also have some bearing on the extensive literature on whether banks failed British industry.Footnote 7 Notably, we show that when the bond market contracted in the 1970s, recently liberalized banks, which were no longer constrained by government policy regarding their lending, met the high demand from companies for debt finance. This article also contributes to the growing literature which examines returns on U.K. financial assets over the long run by adding another asset class to aid our understanding of asset pricing in the long run.Footnote 8
THE U.K. CORPORATE BOND MARKET, 1860–2002
The traditional U.K. appellation for corporate bond, as well as bonds issued by municipal authorities and government-controlled entities, is debenture.Footnote 9 Debentures include any long-term debt secured on the assets of the company.Footnote 10 Our study commences in 1860 when an active debenture market first arose in the United Kingdom (Jefferys 1977, pp. 241–51).Footnote 11
As we are interested in the size and performance of the domestic corporate bond market, we collected data on debentures issued by U.K. companies. We excluded all financial companies that issued debentures from our data set as these firms were mainly financial trusts which issued debentures with the aim of investing the bulk of the proceeds in the equities and debentures of foreign companies (Jefferys 1977, p. 262).
A company was considered to be a U.K. company if its corporate headquarters and the main market where its securities traded were in the United Kingdom and its main activities were based in the United Kingdom.Footnote 12 This information was obtained from a combination of the Investor's Monthly Manual (1864–1930); Burdett's Official Intelligence (1882–1898), the Stock Exchange Official Intelligence (1899–1933), and the Stock Exchange Yearbook (1934–2002).
In order to estimate the annual size, value, and performance of the debenture market, we gathered data on debenture coupon rates, the number of outstanding debenture stocks, the nominal value of debentures (which was usually £100), and debenture prices (which were based on transactions at which business was done) on the last day of December.Footnote 13
Our data was obtained from three main sources. First, debenture data for the period 1860–1863 was hand collected from the Course of the Exchange (COE). Second, data for the period 1864–1929 was culled from the Investor's Monthly Manual (IMM). As we shall see below, the change in sources had no effect on the number of debentures in the sample.
For the remainder of the sample period, we relied on the Stock Exchange Daily Official List (SEDOL); hard copies of which are available at the Guildhall Library in London for the period 1930–2002. Unlike the IMM, by 1930 SEDOL contains a comprehensive list of all securities (no matter how minor) traded in the United Kingdom's various stock exchanges.Footnote 14 As we will see below, its comprehensive nature results in a jump in the number of corporate bonds in 1930, whenever our data sources change. However, most of these additional debentures are very small issues as the total value of debentures changes relatively little between 1929 and 1930.Footnote 15 As the post-1946 copies of SEDOL do not contain the capital outstanding for each debenture issue, we collected this data at decadal intervals from the Stock Exchange Yearbook.
A key issue in this study is that debenture securities are correctly identified in our three data sources. The COE had a separate section for railway debentures and debentures in other sectors were clearly labeled as such. In the cases of the IMM and SEDOL, we only collected data where “deb” or “debenture” was tagged alongside or below the company's name.
The point estimates developed by A. Essex-Crosby (1938) for 1885, 1895, and 1915 report a substantially higher figure for the total value of the debenture market than we find.Footnote 16 Essex-Crosby uses Burdett's Official Intelligence (BOI) to develop his estimates of the size of the U.K. debenture market. Apart from the fact that we exclude financial companies, there are two reasons for this difference. First, we exclude foreign companies. Second, it was common for many companies at this time to have debentures which were not publicly issued and were not traded on markets (Jefferys 1977, p. 286).Footnote 17 For example, the par value of our brewery debentures in 1895 is £17.4 million, whereas the total par value of brewery debentures in Burdett's Official Intelligence in 1895 is £33.8 million. Debentures issued by foreign companies account for £8.9 million of this difference and debentures which are not publicly traded accounts for another £7.3 million.
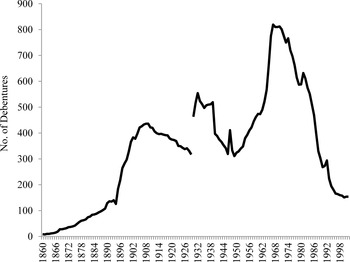
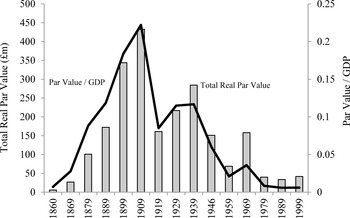
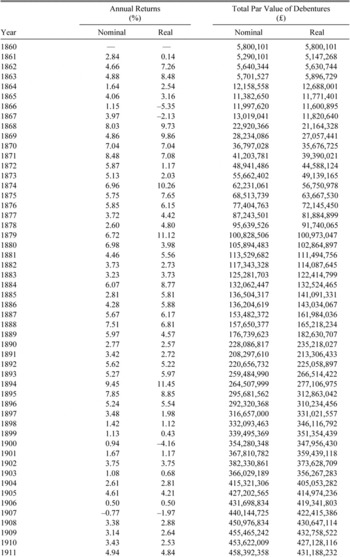
Figures 1 and 2 (as well as Appendix Table 1) show the development of the U.K. debenture market in terms of number and par value of debentures. The most remarkable finding is that the U.K. debenture market has experienced a Rajan-and-Zingales-type great reversal, with the number of debentures and the real par value of debentures at the end of the twentieth century below their levels in 1870 and 1894 respectively.
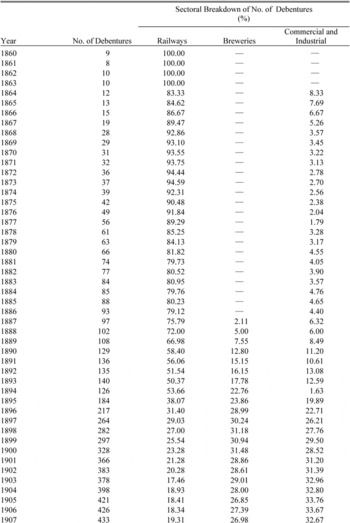
The debenture market grew rapidly in its first four decades. Up until the late 1880s, at least 75 percent of debentures were issued by railways (Appendix Table 1), and railways dominated in terms of par value.Footnote 18 During the 1870s, however, small debenture issues were made by gas companies, iron, coal and steel companies, and commercial/industrial companies. In the case of the latter two sectors, preexisting firms converted to public limited companies, and viewed debentures as a way of raising additional capital (Jefferys 1977, p. 252). As can be seen from Appendix Table 1, from the late 1880s until just before 1913, there was a significant increase in the number and value of non-railway debentures. This growth came mainly from debentures issued by breweries and commercial/industrial companies (see Appendix Table 1).Footnote 19
NUMBER OF DOMESTIC DEBENTURES TRADED ON U.K. STOCK EXCHANGES, 1860–2002

The debenture market reached its peak in 1909 (as measured by total par value in real terms). Railway debentures constituted 63.5 percent of total par value. Indeed, debentures were so popular that new businesses going public often issued debentures and equity in the proportion of one-third to two-thirds (Jefferys 1977, pp. 270–72, 458–60). At its peak in 1909, the par value of debentures was 22 percent of GDP, but by 1919 it had fallen to just below 8 percent of GDP (Figure 2), following the high inflation during of World War I. The market staged something of a recovery between 1920 and 1939, with new debenture issues by brewing, commercial, and industrial companies in the early 1930s. Although our data series for the number of debentures (Figure 1) is affected by the change in data sources in 1930, the downward trend in debenture issues from 1909 to 1946 is still noticeable, despite a series of new debenture issues in the early 1930s.Footnote 20 From 1909 until 1929 six debentures disappeared annually on average, and between 1939 and 1946 the number of debentures declined from 519 to 319.Footnote 21
VALUE OF DOMESTIC DEBENTURES TRADED ON U.K. STOCK EXCHANGES, 1860–1999

As Figure 1 shows, the debenture market rebounded after 1946. The number of debentures on the market in the 1960s reached its all-time peak.Footnote 22 Despite the increase in the number of different bonds, their par value fell between 1946 and 1959 (Figure 2). This is largely explained by the fact that 70 percent of the total par value of debentures in 1946 belonged to companies that would be nationalized within a matter of months. In addition, the companies which issued debentures in the two decades after 1946 were commercial or industrial companies (i.e., electronics, textiles, television, chemicals, plastics, automobiles, and aircraft), which did not have the same capital needs as those companies which had been nationalized.
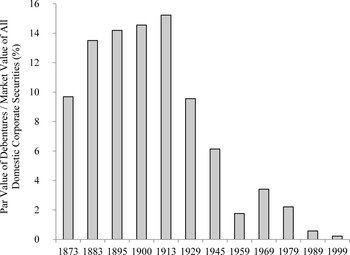
One estimate puts debentures share of company borrowing in 1965–1969 at 42.5 percent,Footnote 23 another suggests that from 1963 to 1972, 15 percent of external funds raised by industrial and commercial companies came from debenture issues (Wilson Committee 1980, p. 51). As can be seen from Figure 1, the debenture market began a rapid decline after 1970, such that by the late 1990s, the market was smaller than it had been a century earlier. In terms of its value (in real terms), the collapse of the market in the 1970s meant that for the rest of the century, the debenture market was smaller than it had been in 1870.Footnote 24 The swift demise of the debenture market resulted in commentators suggesting in the early 1980s that the market was “virtually dead.”Footnote 25Figure 3, which shows the value of the debenture market relative to the total market value of domestic corporate securities, reveals that the debenture market was a relatively important part of the U.K. domestic capital market up until 1913. However, after World War II, the debenture market, despite its brief revival in the 1960s, was a small part of the action.
In terms of other corporate bond markets, in 1913, the U.K. domestic market was large; only the United States, France, and Spain had larger bond markets relative to GDP, but the difference was slight (Musacchio 2010, p. 58). However, nearly one hundred years later, the U.K. corporate bond market is one of the smallest relative to GDP at 36th amongst the 44 most advanced economies 2011.Footnote 26
VALUE OF DEBENTURES RELATIVE TO TOTAL VALUE OF ALL DOMESTIC CORPORATE SECURITIES, 1873–1999

LAW AND THE U.K. CORPORATE BOND MARKET
The “law and finance” hypothesis suggests that creditor protection is associated with better developed debt markets (La Porta et al. 1997, 1998, 2000; La Porta, Lopez-De-Silanes, and Shleifer 2008, p. 294; Djankov et al. 2008). More controversially, however, its proponents also claim that legal origin matters for the strength of these laws, with common law countries having superior protection to civil law countries. Therefore, the United Kingdom (more precisely England), as the home of the common law, is an interesting case study on the evolution of creditor protection law and its relationship to the development of the market for corporate debt.
In the construction of their creditor rights index, there are four rights deemed important by La Porta et al.—no automatic stay on assets, secured creditors get paid first, creditors approve reorganization, and management does not stay during reorganization (La Port et al. 1998, p. 1124).Footnote 27 According to La Porta et al. (1998), the law on the books in 1995 meant that creditors in the United Kingdom had all four of these rights. We examine the evolution of company legislation from the middle of the nineteenth century onwards to see which creditor rights applied over the period 1860 to 2002. Company legislation in the U.K. governed the establishment and operation of U.K. companies and established the rights of creditors as well as shareholders vis-à-vis the company and its management. The Company Clauses Consolidation Act (1845) and the Company Clauses Act (1863) governed the activities of railways and other public utility companies, whilst the Companies Acts from 1862 onwards governed the activities of most other companies. What these acts reveal is that creditors had the four rights deemed important by La Porta et al. (1998) throughout our entire sample period.
The legal origins theory posits that common law countries have better investor protection, and better developed markets. However, as we established above, the market for corporate bonds started contracting after 1913, and essentially became irrelevant after the 1970s, despite a substantial renaissance in the 1950s and 1960s. All this variation occurred without any change in the United Kingdom's creditor protection score. Something other than statute law was driving bond market development over the long run.
In fact, the law and finance literature perhaps overemphasizes the importance of statutory investor protection law in common law countries. In the case of the United Kingdom, there were legal innovations that came from case law that perhaps help us understand the initial takeoff of the bond market. Sometime during the 1860s, English lawyers began drafting contracts with a floating charge, which was where a creditor was granted security against all present and future assets, but was prevented from interfering with the operations of the firm until it officially entered bankruptcy (Armour, Cheffins, and Skeel 2002, p. 1739; Finnie 1931, p. 45). When a firm officially entered the bankruptcy process, the holders of the floating charge debentures had a claim on all the assets of the firm. The floating charge was initially slow to obtain judicial recognition (Pennington 1960, p. 642), but in a series of cases, the validity of the floating charge was upheld.Footnote 28 The innovation of the floating charge and the legal validity it acquired in the 1870s resulted in the widespread use of debentures by all types of companies (Simonson 1920, p. 26; Jefferys 1977, p. 273).Footnote 29
The law and finance school of thought could perhaps argue that the role of the judiciary in supporting the development of the floating charge is perhaps a testament to the common-law way of doing things —judges resolving contractual disputes, responding dynamically to a new business environment, and creating precedents that enabled future, similar contracts to be made on a firmer basis.Footnote 30 However, the doctrine of the floating charge comes from equity not common law principles, and the cases in the 1870s where judges underpinned the validity of the floating charge were heard in the Chancery Court not the common law courts (Curtis 1941, p. 131; Pennington 1960, p. 630).
EXPLAINING VARIATION OF BOND MARKET OVER TIME
The U.K. corporate bond market experienced a great reversal in the twentieth century, albeit with a brief but substantial renaissance in the 1950s and 1960s. As established above, structural theories about legal origin and creditor protection cannot explain this phenomenon. Raghuram Rajan and Luigi Zingales (2003) argue that financial markets contracted during the 1930–1970 period due to incumbent opposition to financial development, which thrived thanks to reduced openness to trade and capital flows. The subsequent recovery of financial markets after the collapse of the Bretton Woods agreement is largely due to the fact that increased capital flows and trade openness undermined incumbent opposition to financial development. However, the development of the U.K. corporate bond market in the twentieth century does not quite fit with this theory. First, the corporate bond market did not contract in the post-1945 period—indeed it expanded rapidly in the 1950s and 1960s. Second, the corporate bond market shriveled up after cross-border trade and capital flows were liberalized after 1970. Consequently, in the rest of this section, we test two hypotheses about what drove U.K. corporate bond markets in the twentieth century. In the first hypothesis, we analyze whether inflation can explain the demise of the U.K. bond market. In the second hypothesis, we examine the role of tax changes on the capital structure preferences of firms to see whether this explains its renaissance in the 1950s and 1960s.
Inflation
There is a well-documented negative relationship between inflation and financial market activity (Huybens and Smith 1999; Boyd, Levine, and Smith 2001). Enrico Perotti and Ernst-Ludwig von Thadden (2006), Perotti and Armin Schwienbacher (2009) and Mark Roe and Jordan Seigel (2009, 2011) go further and argue that inflation partially explains the evolution of and variation across financial markets in the twentieth century. Specifically, Musacchio (2008a) finds that inflation was an important post-1914 driver of corporate bond market size in Brazil. Consequently, we hypothesize that inflation was important to the U.K. corporate bond market, particularly after the devaluation of sterling in 1967.
In order to examine the effect of inflation on the corporate bond market, we calculated yearly nominal total log returns for each debenture by combining coupon payments with the change in the debenture price over the year.Footnote 31 These returns were then used to calculate unweighted annual average returns.Footnote 32 Nominal returns were converted into real returns using inflation data published by the Office of National Statistics (O'Donoghue et al. 2004). When aggregating returns, one also needs to take into account the debentures of failed companies, with the result that the investor could potentially lose some of their initial investment. We checked every delisted debenture against the Register of Defunct Companies, which lists the fate of companies that delisted from the stock exchange from 1875 onwards as well as the payment received by equity and debenture holders if the company was liquidated.Footnote 33 Remarkably, over the whole sample period, only in 13 cases of delisting did debenture-holders lose any capital. This fact underscores the “legendary security” of debentures, which made them very popular with investors (Jefferys 1977, p. 280). As the Register of Defunct Companies usually states the amount paid back to debenture holders, the returns for that debenture were adjusted accordingly.Footnote 34
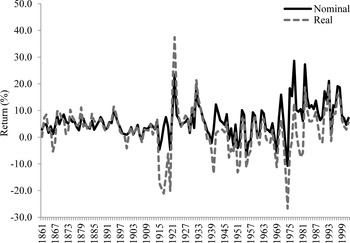
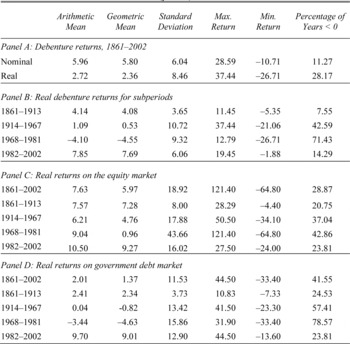
Figure 4 and Appendix Table 1 present annual real and nominal returns for the U.K. corporate bond market over the period 1861–2002.Footnote 35 As can be clearly seen from the difference between the real and nominal returns, inflation had a substantial effect on the corporate bond market during World War I and in the 1970s. Table 1 examines real bond returns and compares them to real returns on equity and government bonds in four distinct inflationary periods — (a) 1861–1913, a period of low and stable inflation; (b) 1914–1967, which contains two bouts of wartime inflation; (c) 1968–1981, a period of high and volatile inflation which started with the devaluation of sterling and ended with the Conservative government's successful attempts to reduce inflation; and (d) 1982–2002, a period when inflation was gradually brought under control. Three things stand out from Table 1. First, the real return on corporate bonds, which averaged 4.14 percent in the pre-1913 era, was only 1.09 percent in 1914–1967, which was largely due to wartime inflation. For example, if we remove the negative returns in 1915–1920, the arithmetic mean rises to 3.27 percent.Footnote 36 Second, the real return during the period 1968–1981, when annual inflation in the U.K. averaged 11.7 percent, was −4.10 percent. Conversely, equities enjoyed a high real average return in this period, whilst government bond returns were as dismal as those of corporate bonds. It is not surprising that inflation kept investors away from the corporate bond market at this time. Third, the high real return in the 1982–2002 period is partially due to firms having to pay higher coupons on their bonds to attract investors following the high inflation of 1968–1981.
NOMINAL AND REAL DEBENTURE RETURNS, 1861–2002

ANNUAL RETURNS ON U.K. DEBENTURE MARKET, 1861–2002 (percent)

Notes:
Debenture log returns are shown, and are adjusted to take account of losses incurred due to company liquidation. Data on payments to debenture-holders in the event of liquidation were obtained from Stock Exchange (1979) and annual supplements to the Stock Exchange Yearbook.
Sources:
Debenture returns are calculated from debenture data obtained from Course of the Exchange (1860–1863), Investor's Monthly Manual (1864–1929), Stock Exchange Daily Official List (1930–2002). O'Donoghue, Goulding, and Allen (2004) is used to convert the nominal returns into real terms. Equity returns are from Acheson et al. (2009) for 1860–1870; Grossman (2002) for 1871–1913; and Dimson, Marsh, and Staunton (2011, pp. 164–66) for 1914–2002. The returns on the government debt market are based on Consol prices for the period 1860 to 1955, and from 1955, a portfolio of high-coupon, long-dated bonds. Consol yields and government bond yields were hand collected from the Course of the Exchange for 1860–1871; the annual Statistical Abstract for the United Kingdom for 1871–1913; and Dimson, Marsh, and Staunton (2011, pp. 164–66) for 1914–2002.
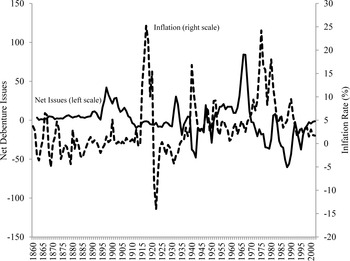
NET DEBENTURE ISSUES (THREE-YEAR MOVING AVERAGE) AND INFLATION RATE, 1860–2002

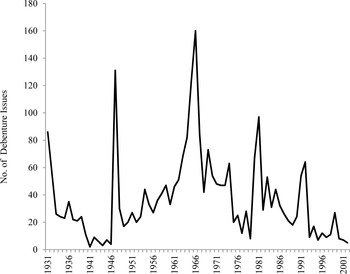
Figure 5 reveals that the inflation which started in the late 1960s was followed by negative net debenture issues for nearly every year for the rest of the sample period, apart from 1980 and 1981, when a large number of property companies issued debentures. As can be seen from Figure 6, there was a substantial fall in the number of debenture issues in the 1970s, but the post-1970 negative net issues is also attributable to the fact that many companies with maturing bonds did not issue replacements. By way of contrast, equity issues, which, as mentioned above, had been relatively low during the 1960s, increased substantially in the 1970s and 1980s (Rajan and Zingales 2003, table 4).
DEBENTURE ISSUES, 1931–2002

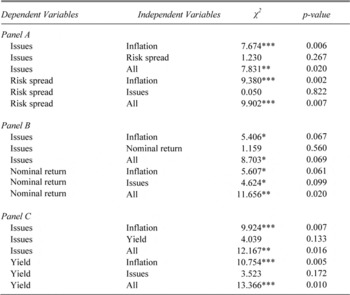
We construct a series of three-factor vector auto regression (VAR) models and use Granger causality tests to determine whether inflation provides statistically significant information about future debenture issues and debenture returns. Our basic hypothesis is that inflation Granger causes debenture issues and returns. We also look at the relationships between inflation, nominal returns, current bond yields, the bond risk premium, and issues. Each time series is tested for unit roots using Augmented Dickey-Fuller tests: we find that inflation, yield, and bond risk premium are non-stationary. Consequently, these series are differenced when analyzing the relationship between them and the other variables. The lag length (i.e., the length of time before inflation affects issues returns) is determined by the Akaike information criterion.Footnote 37
Over the entire sample period, we find (results not tabulated) that inflation does not Granger cause debenture issues, which is not surprising given that inflation was constrained by the gold standard for the majority of our sample. However, whenever we focus on the period after sterling devaluation in 1967, inflation Granger causes debenture issues in every VAR specification in Table 2. In contrast to the United Kingdom, inflation in the United States in the 1970s (and 1980s) was a lot lower and less volatile. For example, the average and standard deviation of the annual inflation rate between 1970 and 1980 was 7.7 and 3.2 percent for the United States, while it was 13.1 and 5.6 percent for the United Kingdom.Footnote 38 In addition, at its peak in 1974–1977, the U.K. inflation rate averaged 18.2 percent, whilst the U.S. rate was only 8.1 percent. Consequently, the U.S. corporate bond market was less affected by inflation, and once inflation fell in the early 1980s, this market, unlike that of the United Kingdom, experienced substantial growth (Jefferis 1990; Schinasi and Smith 1998).
Although the Wilson Committee (1980, p. 237) in 1980 identified the moribund state of the corporate bond market as a serious weakness of the British financial system, the market has never been revived. The Wilson Committee (1980, p. 225) argued that risk aversion on the part of borrowers and lenders, arising from inflation, prevented agreement being reached on appropriate nominal rates. One puzzle is why indexation did not take off in the corporate bond market. The Wilson Committee's (1980, p. 237) 1978 survey of firms suggests that managers were reluctant to accept open-ended and potentially nominal terms large liabilities that could fall due at inopportune times. Their fears were reasonable given that U.K. inflation was volatile as well as high in the 1970s.
Tax Shield
Debt financing is attractive to companies when interest is treated as a cost and thus removed from accounting profits, and when taxes on net income are substantial (Modigliani and Miller 1963; Kemsley and Nissim 2002). Second, when taxation weights on distributed (but not retained) profits then debt finance can be very attractive to companies. Third, if the taxation of dividend income is more severe than interest, then companies will cater to investor preferences for bonds over shares.
GRANGER CAUSALITY TESTS OF FACTORS AFFECTING DEBENTURE ISSUES, 1967–2002

* indicates statistical significance at the 10 percent level.
** indicates statistical significance at the 5 percent level.
*** indicates statistical significance at the 1 percent level.
Notes:
Table presents Granger-causality test statistics (χFootnote 2) as well as their p-values. The dependent variable of the three-factor VAR model for each test is in the first column and independent variable is in the second column. Issues is the number of debenture issues; Inflation is the rate of change in the U.K.'s composite price index; Risk spread is the difference between the yield on debentures and government bonds; Yield is the average current yield on debentures; Coupon is the average coupon rate on debentures. Inflation, Yield, and Risk spread variables are differenced as the ADF tests reveal non-stationarity. Lag length is chosen using Akaike information criterion (AIC). One lag is used in panel A and two lags are used in panels B and C.
The Labour government introduced a profit tax in 1947. The tax was higher for profits distributed to shareholders (25 percent) than for profits retained within the company (10 percent).Footnote 39 The Labour government hoped to limit what was viewed as unmerited income, whilst at the same time encouraging companies to invest in new plant and machinery (Daunton 2002, pp. 201, 248). As interest could be charged against taxable profits, the large increase in the tax rate on distributed profits made debt capital much cheaper to service than equity. Shareholders' reduced dividend income, allied to the fact that share repurchases in this period were illegal, further depressed the demand for equity. As banks in the late 1940s held over 80 percent of their deposits in some form of government debt, they were unable to provide the funds required by companies (Sheppard 1971, pp. 126–27). Consequently, as can be seen from Figure 6, there was a huge spike in debenture issues in 1947, the bond market grew steadily after 1949 (Figure 1). According to W. A. Thomas, tax policy, rather than difficulties in raising equity finance, was the most important influence on the volume of debentures in this period (Thomas 1978, p. 154). The Conservative budget of March 1958, replaced the differential system of profit tax with a single 10 percent tax on all profit. This reform marginally reduced the incentive to use debt borrowing, yet there was no diminution in the size of the debenture market (Figure 1).Footnote 40
In 1965 the Labour government replaced the system of profits tax with a single corporate income tax (initially set at 40 percent) levied on profits. It also introduced a surtax on dividends. The resulting structure was broadly equivalent to the 1947–1958 tax regime save that distributed profits were taxed a lot more heavily than before. The Labour government's goal was to induce companies to retain earnings with the expectation that this would directly benefit the company's workers and result in a more equitable society (Daunton 2002, pp. 290–93). To ensure that these measures would not just result in investors taking profits as capital gains, the Labour government also introduced a long-term capital gains tax of 30 percent (Daunton 2002, p. 292). After 1965 companies' incentives to finance via debt rather than equity were larger than ever before (Thomas 1978, p. 154). And, as can be seen from Figure 6, they did just that, the number of debenture issues reached unprecedented levels in 1965 and 1966. The number of debentures on the U.K. market increased from 567 in 1964 to 801 by 1971 (see Appendix Table 1 for full details). Between 1964 and 1971, £2.25 billion was raised on the U.K. corporate bond market, twice as much as was raised on the equity market (Anon. 1981, pp. 54–56).Footnote 41
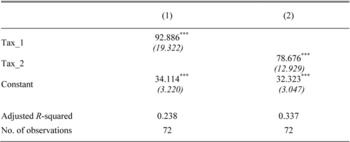
In order to formally test the relationship between these tax changes and debenture issues, we regress a binary variable for the introduction of the new tax regimes upon debenture issues. As the post-1931 data sources are comprehensive, we focus on the 1931–2002 period. We create two binary variables: (a) Tax_1 equals 1 in 1947 and 1965, the years in which profits and corporation tax are introduced respectively, and 0 otherwise; and (b) Tax_2 equals 1 in 1947, 1948, 1965, and 1966, the years of and years just after the taxation changes, and 0 otherwise. In essence, what we are testing is whether the majority of the population of public companies on the market immediately exploits the tax changes. If they do so, as is suggested by Figure 6, then we should not expect above-trend new issues thereafter. The regression results in Table 3 indicate that these tax changes had a statistically and economically significant effect on debenture issues, with the tax-change variables alone explaining 23 and 33 percent of the time-series variation in debenture issues.
Supply of Capital
Did the variation in the importance of the U.K. corporate bond market have a big effect on the supply of capital to firms? Although this question is somewhat beyond the scope of this article, one way of looking at the effect of bond market variation on the overall supply of capital is to look at the proportion of gross fixed capital formation financed via equity and corporate bonds.Footnote 42 In 1938 and 1960 this ratio was 0.12 and 0.11, but due to the inflation-induced fall in the new issue of bonds, the ratio fell to 0.03 in 1970 and 0.04 in 1980. It increased in 1990 and 1999 to 0.07 and 0.09 respectively thanks to an increase in new equity issues. This evidence is consistent with the view that the contraction of the bond market may have had a detrimental effect on the supply of finance from the capital market.
EFFECT OF TAX CHANGES ON DEBENTURE ISSUES, 1931–2002

*** indicates statistical significance at the 1 percent level.
Notes:
Dependent variable is number of debenture issues. Tax_1 equals 1 in 1947 and 1965, the years in which profits and corporation tax are introduced respectively, and 0 otherwise. Tax_2 equals 1 in 1947, 1948, 1965, and 1966, the years of and years after the taxation changes, and 0 otherwise.
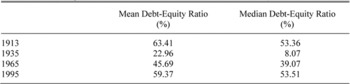
Did the size of the bond market affect the use of debt within firms? In order to see whether the size of the bond market affected the use of debt within firms, we look at debt-equity ratios of the constituents of the Financial Times' FT-30 Index (the United Kingdom's equivalent of the Dow Jones). Prior to 1995 the constituents of this index seldom changed and were all industrial and commercial companies. From Table 4, we see that the average debt-equity ratio is high in 1913 when the corporate bond market was in its heyday in terms of value, and it is high in 1995 when the corporate bond market was very small. In 1935, in the middle of a period of bond market contraction, debt-equity ratios are very low. However, average debt-equity ratios had increased by 1965, when the bond market was in the middle of its renaissance. In other words, apart from in 1995, the variation in debt-equity ratios appears to reflect the variation in the size of the bond market.
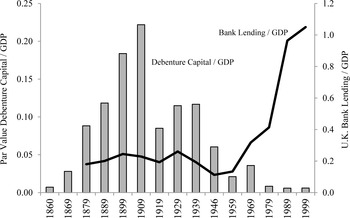
Why is the debt-equity ratio so high in 1995 whenever the corporate bond market had contracted? One possibility is that multinational companies increasingly borrowed on international stock markets and the Eurobond market.Footnote 43 However, this only applies to the largest publicly traded companies. A better explanation is that banks stepped into the gap left by the collapse of the corporate bond market. The increase in bank lending to companies since the early 1970s has been dramatic, with banks financing the majority of companies' borrowing requirement (Thomas 1978, p. 327; Anon. 1981, p. 57). As can be seen from Figure 7, the contraction of the debenture market coincides with the rapid growth in bank lending in the United Kingdom. Banks did not lend much to U.K. public companies prior to the 1960s as they were constrained by government directives which constrained lending to businesses and essentially tied up large proportions of bank deposits in government debt (Nevin and Davis 1970, p. 274; Wadsworth 1973, p. 106). For example, in 1950 holdings of government debt by U.K. banks were equal to 58 percent of bank deposits (Sheppard 1971, p. 127). These constraints were gradually removed during the 1960s and 1970s, and this combined with the entrance of foreign banks into London meant that lending, particularly to businesses, was able to expand dramatically.
DEBT-EQUITY RATIOS OF COMPANIES IN FT-30 INDEX, 1913–1995

Notes:
The FT-30 Index, which was originally the Financial News' FN-30 Index, commenced in 1935; 24 of the 1935 constituents existed in 1913; these plus six additional large commercial / industrial companies are included in the figures for that year.
Sources:
Company accounts for 1995 from Bloomberg, and 1913, 1935, and 1965 company accounts are from Stock Exchange Official Yearbooks.
Notably, the remarkable increase in the number of multiple firm-bank relationships observed in the 1970s is consistent with this growth in bank lending to publicly traded companies (Braggion and Ongena 2011). U.K. banks, as powerful and concentrated incumbents, may have had incentives to frustrate the renaissance of the domestic corporate bond market (Schinasi and Smith 1998, pp. 27–30; Rajan and Zingales 2003).44 Alternatively, as the banking and shadow-banking systems increasingly met the borrowing needs of firms, there may have been less need for a domestic corporate debt market.
What the above evidence seems to suggest is that during the first 100 years of the U.K. bond market's existence, if public companies wanted to finance via debt, the corporate bond market was the only important source of debt finance. However, after the 1960s the rise of the Eurobond OTC markets and the huge increase in bank lending to industry meant that there were substitutes for corporate bonds.
VALUE OF DOMESTIC DEBENTURES TRADED ON U.K. STOCK EXCHANGES AND BANK LENDING, 1860–1999

CONCLUSION
After experiencing over half a century of growth, the U.K. corporate bond market suffered a great reversal in the twentieth century. Structural theories about legal origin and creditor protection cannot explain this phenomenon as creditor protection scores remain unchanged over the entire sample period. Indeed, investor protection legislation and the common law cannot even be credited with stimulating the takeoff of the U.K. debenture market.
We test two explanations for the twentieth-century variation in the U.K. corporate bond market. First, we find that inflation was a major cause of the decline of the market from the late 1960s onwards. The very high inflation in the 1970s and 1980s drove the market down in several ways. Inflation and the uncertainty it caused, eroded the real value of corporate bonds and accelerated bond redemptions without a counterbalancing rise in new issues (Anon. 1981, p. 56; Wilson Committee 1980, pp. 19 and 225). Second, we find that government taxation policies after World War II provided a large incentive to companies to use debt finance. Not only was there the classic tax shield (i.e., interest payments on debt could reduce taxable profits), but there was also a higher tax rate if profits were distributed rather than being retained. Given the constraints on bank lending, companies turned to the corporate bond market. As a result, this market reached its zenith, in terms of the number of debentures traded on the market, in the late 1960s.
Although inflation and taxation policies are visible causes of the variation in the twentieth-century U.K. corporate bond market, they themselves are driven by political economy. The main underlying driving force which may explain the postwar renaissance and post-1970 decline in the U.K. corporate bond market is the growth of social democracy. The advocates of social democratic economic policy in the United Kingdom were empowered by the combination of universal suffrage and the human and physical destruction experienced during World War II.Footnote 45 The voters of the post-World War II period brought to power a government who intended to rebuild the U.K. economy with a combination of government spending on housing and infrastructure and privately funded capital deepening. The tax-induced renaissance of the bond market was an indirect consequence of the postwar Labour government's attempts to redistribute income, stimulate investment, and limit what it perceived to be unmerited income (i.e., dividends). The high inflation of the 1970s had some of its roots in the policy choices of the prevailing social democratic preferences of U.K. voters. The unwillingness of successive U.K. governments in the 1970s to implement contractionary monetary and fiscal policies to combat high inflation was driven by the fear that such policies would result in the then-powerful trade unions fomenting industrial unrest.
Appendix
U.K. CORPORATE BOND MARKET, 1860–2002


U.K. CORPORATE BOND MARKET, 1860–2002