The Clyde Basin (Scotland, UK) occupies a catchment of 3130km2 that flows into the River Clyde (length 176km) and includes the city of Glasgow as well as the outlying towns of Dumbarton, Clydebank, Renfrew, Paisley, Greenock and Port Glasgow. In 2011, this conurbation contained approximately 1.7 million people, which equates to 41 % of the population in Scotland and a density of 3390 inhabitantskm–2 in Glasgow (National Archives of Scotland 2012). The City's industrial growth expanded in the 18th and 19th Centuries and included ship-building, textiles, chemical/coal-gas production as well as coal and ironstone mining (Reed Reference Reed1999). However, present-day manufacturing in the Clyde Basin is now considered light when contrasted with the heavy industry of yesteryear. Consequently, the sediments and soils within the Clyde Basin, have received pollution from this long industrial history which has contributed to sources of persistent organic pollutants (POPs) such as polycyclic aromatic hydrocarbons (PAHs) and polychlorinated biphenyls (PCBs) (Edgar et al. Reference Edgar, Davies, Hursthouse and Matthews1999; Vane et al. Reference Vane, Harrison and Kim2007, Reference Vane, Ma, Chen and Mai2010, Reference Vane, Chenery, Harrison, Kim, Moss-Hayes and Jones2011). Many of these compounds are strongly hydrophobic and lipophilic as well as having a tendency to bio-accumulate in plant and animal tissues. PAHs are present in soil as a result of natural and anthropogenic processes which produce both point source and diffuse emissions (Wilcke Reference Wilcke2000; Boehm Reference Boehm, Morrison and Murphy2006). PCBs are not found naturally in the environment and are mainly present in soils due to point source releases (Johnson et al. Reference Johnson, Quenson, Chiarenzelli, Hamilton, Morrison and Murphy2006) and in made ground comprising construction and demolition waste (Environment Agency 2009).
PCBs were predominantly used as dielectric and coolant fluids in electrical equipment and in heat transfer fluids. They were also used as flame retardants in paints, sealants and other building materials (Andersson et al. Reference Andersson, Ottesen and Volden2004), which makes them potentially ubiquitous in urban areas (Environment Agency 2009). PCBs are environmentally toxic and are possible carcinogens. Consequently, their industrial use and production was banned by the United States Congress in 1979 and by the Stockholm Convention on Persistent Organic Pollutants in 2001 and their environmental distribution and attenuation have been reviewed (Johnson et al. Reference Johnson, Quenson, Chiarenzelli, Hamilton, Morrison and Murphy2006). However, studies have also reported that PCBs are prone to atmospheric transport and deposition, controlled by temperature-induced volatilisation (Irvine & Loganathan Reference Irvine and Loganathan1998; Jones & de Voogt Reference Jones and de Voogt1999). PAHs and PCBs remain in soil for extensive periods of time due to their long half-life, which can range from years to decades (Jones & de Voogt Reference Jones and de Voogt1999; Martin & Cowie Reference Martin and Cowie2008). Bioaccumulation of POPs in organisms that are part of the food web is a potential health hazard if pollutants are concentrated and subsequently consumed by humans. Physico-chemical properties of PAH and PCB (e.g., lipophilic) make them important since they are implicated in having adverse effects on human and environmental health (Hopkins et al. Reference Hopkins, Gowers and Horsford2009; ATSDR 2015; Nathanail et al. Reference Nathanail, McCaffrey, Gillett, Ogden and Nathanail2015).
Previous studies published by the Environment Agency for England and Wales reported elevated concentrations of PAH and PCB in UK urban soil (Creaser et al. Reference Creaser, Wood, Alcock, Copplestone and Crook2007a, Reference Creaser, Wood, Alcock, Copplestone and Crookb). PAH sources were thought to be mixed and predominantly include those from traffic and domestic combustion, while PCBs were likely to have arisen from atmospheric deposition as a consequence of original point source releases. Similar findings have been reported for cities such as London, UK (Vane et al. Reference Vane, Kim, Beriro, Cave, Knights, Moss-Hayes and Nathanail2014), Glasgow, UK (Morillo et al. Reference Morillo, Romero, Maqueda, Madrid, Ajmone-Marsan, Grcman, Davidson, Hursthouse and Villaverde2007); Birmingham, UK (Smith et al. Reference Smith, Edelhauser and Harrison1995); Boston, USA (Bradley et al. Reference Bradley, Magee and Allen1994); and Xiamen, China (Xing et al. Reference Xing, Lu, Dawson, Shi, Zhang, Wang, Liu and Ren2005). From a human health perspective, benzo[a]pyrene, is considered, to be the most significant of the commonly encountered environmental PAHs because it has carcinogenic and mutagenic properties (Menzie et al. Reference Menzie, Potocki and Santodonato1992; CRCE-PHE 2008).
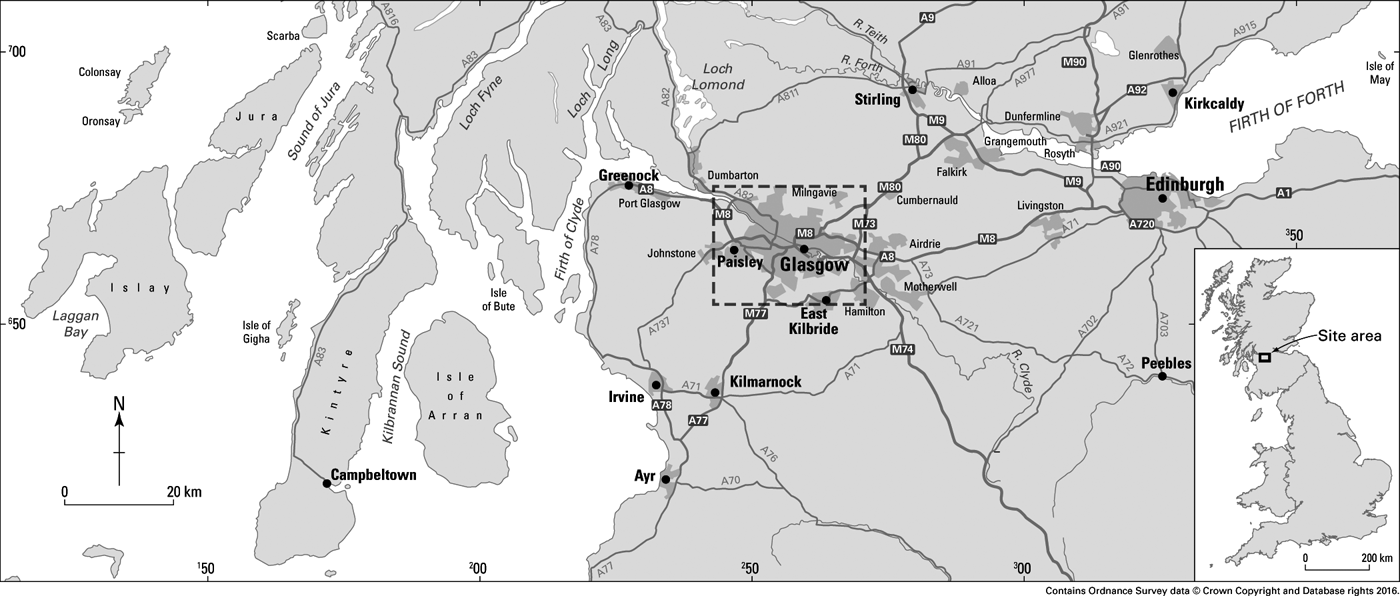
Requirements under the land use planning system in the UK mean that numerous geochemical/environmental site investigations are conducted annually for regulatory purposes, producing a lot of soil pollution information that is not published in peer reviewed journals. Subsequently, there is a scarcity of wide-ranging baseline data on soil PAH and PCB concentrations for the UK. This study helps to address this by systematically sampling an area of 255km2 in Glasgow, one of the UK's main centres of heavy industry during the 18–20th Centuries (Fig. 1). We examine the near-surface soil samples (5–20cm, n=84) from a variety of different land use types and a selection of PAH end members (n=5) to
(1) determine individual concentrations of total organic carbon (TOC), non-volatile total petroleum hydrocarbons (TPHs), PAHs and PCBs;
(2) compare contaminant concentrations to those recorded in similar urban areas to identify whether there are any obvious differences in the Glasgow area;
(3) where possible, discuss the concentrations with respect to published human health generic assessment criteria (GAC) so this dataset can provide a baseline for long-term environmental monitoring and help to quantify the impact of future pollution changes and/or events;
(4) identify, where possible, relative ratios of PAHs and PCBs to describe potential sources of pollution and characterise the likely contribution of emissions.
Location of the Glasgow study area.

1. Methods
1.1. Sampling and sample preparation
Soil samples were collected from the Glasgow area, UK, during July 2011 (Fig. 1). Sites were pre-selected to cover a range of current land uses including urban open space, agricultural/rural, road verge, recreational/municipal, commercial and light industrial; the positions of all sampling locations were recorded using a handheld GPS (accuracy ±5m). At each site soil samples were recovered from four corners and the centre of a 20m by 20m square grid at a depth of 5–20cm using a hand-held Dutch auger. The samples were combined, sealed in a Rilsan bag, stored at ∼4°C until frozen (−18°C). Upon return to the laboratory all soils were freeze-dried, sieved to pass a brass mesh of aperture 2mm and the <2mm fractions ground in an agate TEMA mill to <200μm, this method was found to preserve PAH and minimise relative standard deviation of the concentration data (Bearcock et al. Reference Bearcock, Everett, Scheib, Fordyce, Nice and Vane2012; Beriro et al. Reference Beriro, Vane, Cave and Nathanail2014). All end member samples and soil samples were treated in the same way and were analysed as follows.
1.2. Total organic carbon and non-volatile hydrocarbons
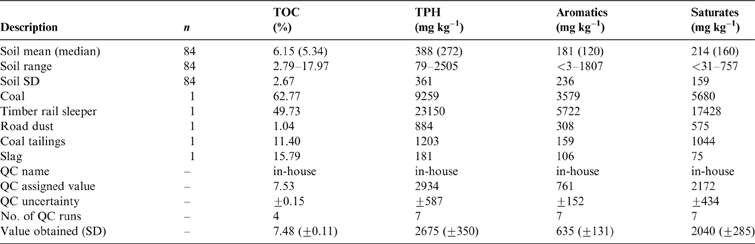
TOC content was determined using an Elementar VarioMax C, N analyser after acidification with HCl (50% v/v) to remove carbonate. The limits of quantification reported for a typical 300mg sample were 0.18%. Non-volatile hydrocarbons, non-volatile TPHs, were determined as reported in Vane et al. (Reference Vane, Harrison, Kim, Moss-Hayes, Vickers and Hong2009). Briefly, samples were extracted with dichloromethane (DCM)/acetone (1:1v/v) mixture using an accelerated solvent extraction (ASE 200 Dionex) system. Saturated and aromatic hydrocarbons were determined using a thin-layer chromatography–flame ionisation detector (TLC-FID) Iatroscan Mk6s instrument. A known concentration and volume of the total organic extract, contained in toluene, was spotted onto the Chromrod and developed using n-hexane followed by toluene to separate the saturate and aromatic fractions respectively. Figures of merit are presented in Table 1.
TOC and TPH concentrations in Glasgow soils and end member samples. Abbreviations: TOC = total organic carbon; TPH = total petroleum hydrocarbon; SD = standard deviation; QC = quality control; n = number of samples. QC data are presented.

1.3. Polycyclic aromatic hydrocarbons
Samples ∼1g were spiked with deuterated internal standards: naphthalene-d8, biphenyl-d10, phenanthrene-d10, pyrene-d10, benzo[a]athracene-d10, benzo[a]pyrene-d12 and benzo[g,h,i]perylene-d12 at concentrations of between 267 and 4000ngg–1 drywt–1, the relative response factors of these standards were used for quantification. Samples, procedural blanks and certified reference materials (CRMs) were extracted using Dionex ASE-200 accelerated solvent extraction (ASE, hexane/acetone 1:1v/v, 100°C, 2000psi). Prior to ASE, activated copper powder (2g) was mixed with the sample to remove elemental sulphur and ∼5g of clean sand added to ensure thorough sample dispersal within each extraction cell. The resultant extracts were reduced in volume to 2–3mL using a TurboVap (Caliper Life Sciences), and passed through a Pasteur pipette packed with anhydrous sodium sulphate (1g) and reduced to ∼0.25mL using a gentle stream of dry nitrogen gas. The extract was quantitatively transferred to a conditioned polymeric sorbent SPE cartridge (Varian, Bond Elute Tph W 500mg Na2SO4, 1g sorbent, 3mL reservoir volume). The cartridge was conditioned immediately prior to use (6mL hexane). The first fraction was eluted with pentane (0.5+1mL) using gravity. The second fraction, which contained the PAHs, was eluted with 6mL hexane/iso-propanol (97:3) v/v. This eluate was spiked with recovery standards: methylnaphthalene-d10 (107ngg–1) and chrysene-d12 (729ngg–1) and reduced in volume to 0.5–1.0mL using a gentle flow of dry nitrogen.
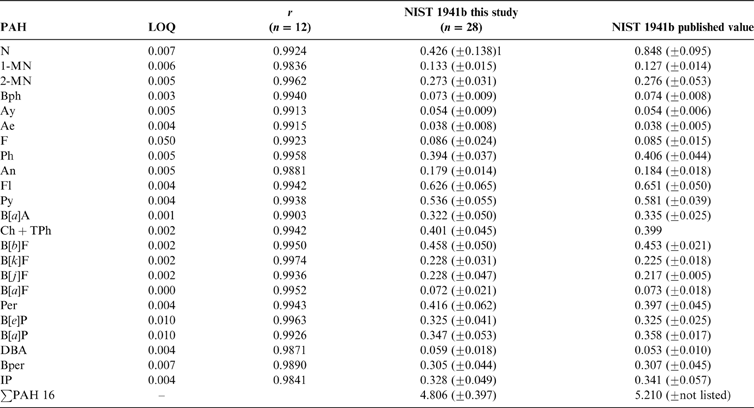
Gas chromatography–mass spectrometry (GC-MS) was performed on a Varian 3800 gas chromatograph coupled to a Varian 1200L triple quadropole mass spectrometer operating in full scan mode (ionisation energy 70eV, mass range 47–500amu). Sample application (1μL) was by splitless injection from 0–0.7min and thereafter a split 1:20 was applied (injector temperature 280°C). The GC was fitted with a fused silica Varian VF-35MS column (30m length×0.25mm i.d.×0.1μm film thickness). The GC oven temperature programme was 60°C (1min isothermal) to 320°C (at 6°Cmin–1) and held isothermally at 320°C for 10min and helium was used as carrier gas (1mLmin–1). The CRM NIST 1941b Organics in Marine Sediment was used and processed using the same procedure as for the other samples. Quality control was achieved by performing duplicate analyses of a single certified reference material (NIST 1941b) at a minimum of every 10 sample intervals throughout the study (Table 2). The LOQ was determined peak height at five times signal/background ratio. The USEPA ∑PAH16 includes N, naphthalene; Ay, acenaphthylene; Ae, acenaphthene; F, fluorene; Ph, phenanthrene; An, anthracene; Fl, fluoranthene; Py, pyrene; B[a]A, benzo[a]anthracene; Ch+TPh, chrysene and triphenylene; B[b]F, benzo[b]fluoranthene; B[k]F, benzo[k]fluoranthene; B[a]P, benzo[a]pyrene; DBA, dibenz[a,h]anthracene; B[ghi]P, benzo[g,h,i]perylene; IP, indeno[1;2;3-c,d]pyrene. The ∑PAH31 also includes 1-MN, 1-methylnaphthalene; 2-MN, 2-methynaphthalene; Bph, biphenyl; C2-N, C2-naphthalenes; DbF, dibenzofuran; C1-F, C1-fluorenes; DBT, dibenzothiophene; C1-An, C1-anthracenes and phenanthrenes; C2-An, C2-anthracenes and phenanthrenes; C1-Fl, C1-fluoranthenes and pyrenes; C1-B[a]A, C1-benzo[a]fluoranthenes and chrysenes; B[j]F, benzo[j]fluoranthene; Per, perylene; B[a]F, benzo[a]fluoranthene; B[e]P, benzo[e]pyrene. Co-elution of Ch and TPh was observed the sum of the two is reported as Ch+TPh.
PAH figures of merit. Limits of quantification (LOQ), regression coefficients and values obtained from a certified reference material of PAH in harbour sediment (mgkg–1). n = number of analyses.

1Naphthalene classified as semi-volatile PAH, possible losses during storage.
1.4. Polychlorinated biphenyls
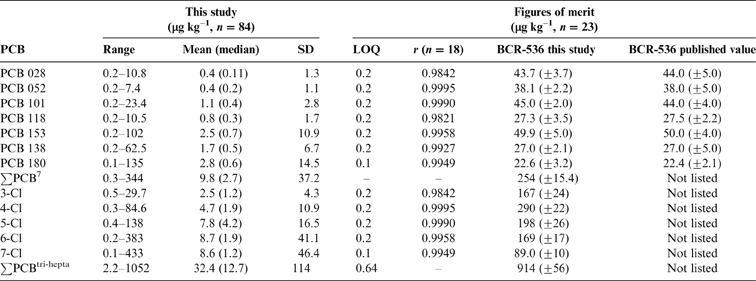
Samples (10g) were spiked with PCB 34, 62, 119, 131 and 173 (9.0–9.7ngg–1) and PCB 19 and 147 (7.9–10.1ngg–1) and extracted using ASE, reduced in volume to 3–4mL followed by addition of concentrated H2SO4 (3×0.6mL) and agitated. The acidic aqueous layer was immediately removed any remaining moisture was removed by passing the organic layer through a glass Pasteur pipette containing anhydrous Na2SO4. The hexane extract was reduced to 0.3–0.25mL and subjected to the same SPE method as for PAH, spiked with PCB 29 and 157 (3.1–3.3ngg–1) and reduced to 0.1–0.2mL. Concentrations of PCB were measured using GCMS fitted with a DB1 column, 60m, 0.25mm i.d., 0.1μm df (Agilent Technologies, Stockport, UK). The MS was operated in selected ion mode (m/z 71, 220, 256, 258, 290, 292, 326, 328, 360, 362, 394, 396) with a scan time of 0.5s. Congener profile distributions for tri to hepta-chlorinated biphenyls (∑PCBtri-hepta) were determined using five separate individual relative response factors for each congener group. A standard consisting of 2×5 individual PCBs based on first and last eluting congener was used to define the ‘retention time window' for each group. The sum of these five groups is ∑PCBtri-hepta and ∑PCB7 comprised congeners 28, 52,101, 118, 153, 138, 180. Quality control was achieved by performing duplicate analyses of a single CRM (BCR-536, PCBs in harbour sediment) every 10 sample intervals throughout the study and analysing it by the same method as for the samples (Table 3). A procedural blank prepared from the pure hydromatrix dispersant – a material devoid of PCBs – was treated in a similar fashion.
PCB concentrations in Glasgow soils and figures of merit obtained (μgkg–1). Limits of quantification (LOQ), regression coefficients and values obtained from a certified reference material BCR-536 of PCB in harbour sediment. n=number of analyses.

1Median less that LOQ due to the method for substitution of non-detects used, 0.5×LOD (Helsel Reference Helsel2006).
2. Results and discussion
2.1. Soil organic carbon
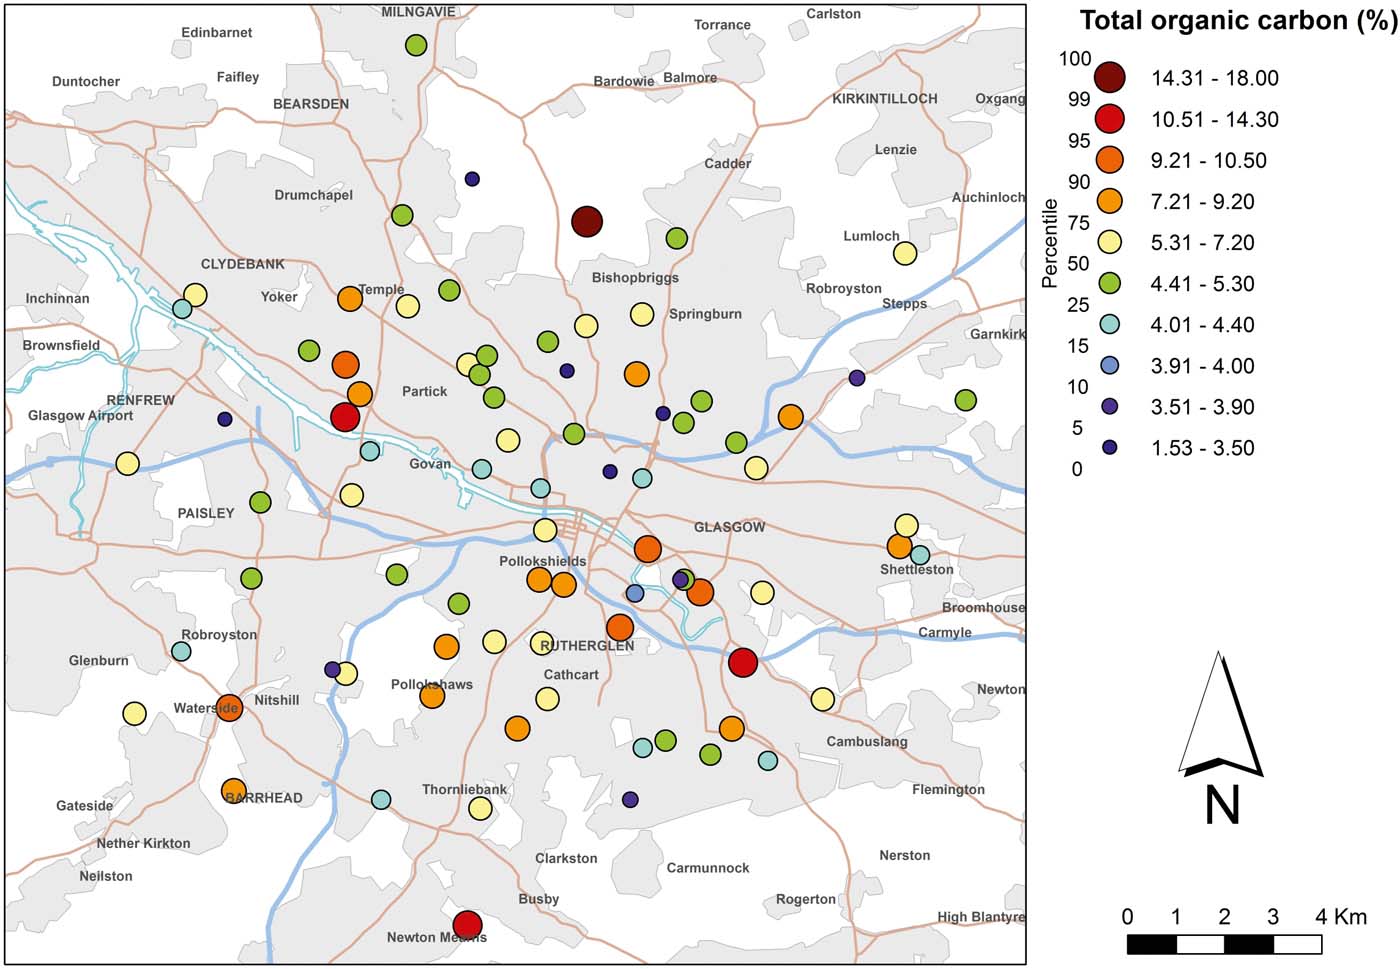
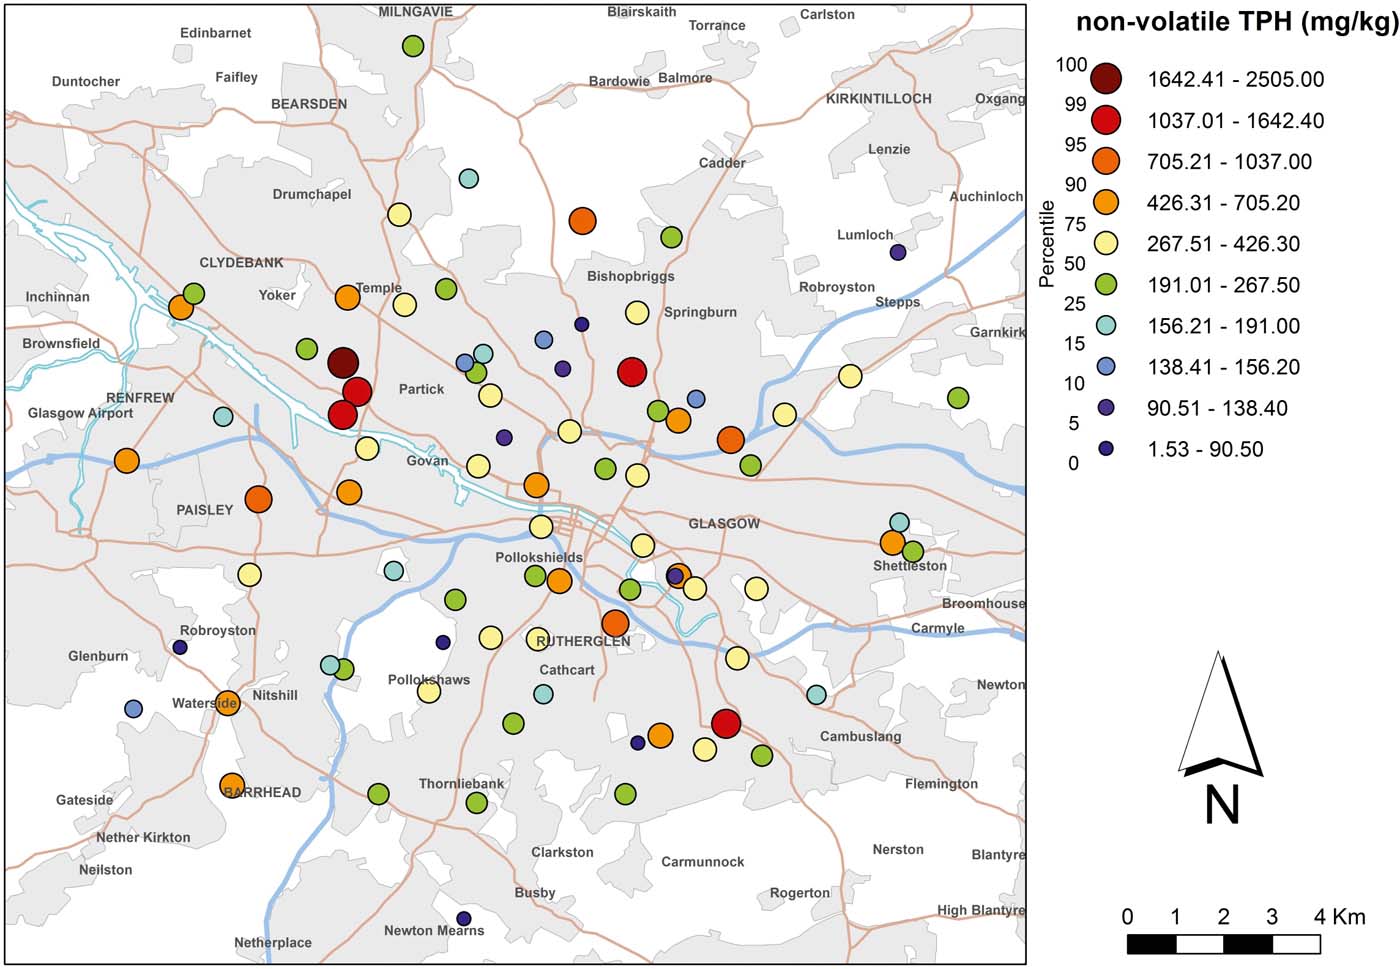
TOC ranged from 2.79 % to 17.97 % with a mean of 6.15 % and a median concentration of 5.34 % (Fig. 2, Table 1). TPHs (non-volatile) ranged from 79 to 2505mgkg–1 with a mean of 388mgkg–1 and a median concentration of 272mgkg–1 (Fig. 3, Table 1). The saturated hydrocarbon (aliphatic) concentrations ranged from <31 to 757mgkg–1 and the aromatic hydrocarbon concentrations ranged from <3 to 1807mgkg–1. No strong visual spatial trend or gradient in soil TPHs (Fig. 3) was immediately evident. However, there is a group of high TPH values (>1037mgkg–1) to the west of Partick that corresponds to one of the current/former centres of ship building and docks. High values (>1037mgkg–1) were found at a former centre of heavy engineering/railway works to the south of Springburn and a railway verge west of Cambuslang. These concentrations are not untypical when the past and current industrial land use is considered (e.g., oil refineries on the Clyde at Bowling and Carless). The importance of soil as a source of sedimentary TPH is demonstrated in a related/partner study examining tributary sediments of the River Clyde that found TPHs in the urban tributaries ranging from 72 to 37,879mgkg–1 with a mean of 2779mgkg–1, this was in contrast to the upper rural Clyde domain, which was found to have a lower TPH of 3 to 260mgkg–1 with mean of 68mgkg–1 (Vane et al. Reference Vane, Lopes dos Santos, Kim, Moss-Hayes, Fordyce and Bearcock2018). No strong correlation was found to exist between the TOC and non-volatile TPHs (R 2 0.1839) and no appreciable correlation was observed between TOC and aromatic (R 2 0.001) or aliphatic hydrocarbon groups (R 2 0.188). This indicates that TPHs are only a minor contributor to TOCs, with the majority of the TOCs comprising natural organic matter.
Concentration of total organic carbon (%) in near-surface soil (5–20cm) of Glasgow. Soil data BGS, © NERC. Contains Ordnance Survey data © Crown Copyright and database rights 2016.

Concentration of non-volatile total petroleum hydrocarbons (TPHs; mgkg–1) in near-surface soils (5–20cm) of Glasgow. Soil data BGS, © NERC. Contains Ordnance Survey data © Crown Copyright and database rights 2016.

In 2015 Land Quality Management Ltd and the Chartered Institute of Environmental Health (LQM/CIEH) developed suitable for use levels (S4UL) GAC for some 85 substances including seven aliphatic (saturate) fractions and eight aromatic hydrocarbon fractions. These are GAC for human health for specified groups of petroleum hydrocarbon fractions, subdivided by equivalent carbon (EC) number ranging between EC >5 and 44. The S4UL for each EC fraction is based on the literature-derived toxicity, physical and chemical properties of each fraction. S4ULs were produced for six different land uses including residential, allotment, commercial and public open spaces for soils containing 1, 2.5 or 6 % soil organic matter (SOM) (Nathanail et al. Reference Nathanail, McCaffrey, Gillett, Ogden and Nathanail2015). An alternative EC fraction-based approach for risk-based clean-up levels has been applied to site-specific contaminated land remediation (Clay & Harris Reference Clay and Harris2002). The current study did not analyse the soils in terms of the EC fractions but in terms of a single measure of non-volatile TPH (as measured by the Iatroscan method). Hence these analytical data do not lend themselves for direct comparison with the EC fraction based S4ULs.
However a regulatory (non risk-based) criterion of 100mgkg–1 for TPH has been used by state agencies in the USA, but with the higher background levels that were typically encountered in the urban soils of New England, USA, of 373mgkg–1 (Bradley et al. Reference Bradley, Magee and Allen1994), the authors suggested the development of a more realistic (higher) concentration. The value of 100mgkg–1 is an indication of environments not affected by anthropogenic sources of contamination and has been used as an indicator of pollution which is supported by previous work that reported TPH concentrations of 38–93mgkg–1 in mangrove soils/sediments of South China and TPH values of approximately 100mgkg–1 in surface sediments from non-industrial/urban impacted salt marshes of New Jersey (Vane et al. Reference Vane, Harrison, Kim, Moss-Hayes, Vickers and Horton2008, Reference Vane, Harrison, Kim, Moss-Hayes, Vickers and Hong2009). In contrast, heavily polluted soils from oil refineries and industrial sites in the US, Canada and Mexico reported TPH concentrations ranging from 1400–36,300mgkg–1 (Napolitano et al. Reference Napolitano, Richmond and Stewart1998). Previous chemical characterisation of 60 urban soils from New England, USA, reported mean TPH values for Boston of 475mgkg–1, Providence of 276mgkg–1 and Springfield of 184mgkg–1 which are broadly comparable with those observed here in Glasgow.
2.2. Polycyclic aromatic hydrocarbons
2.2.1. PAH concentrations
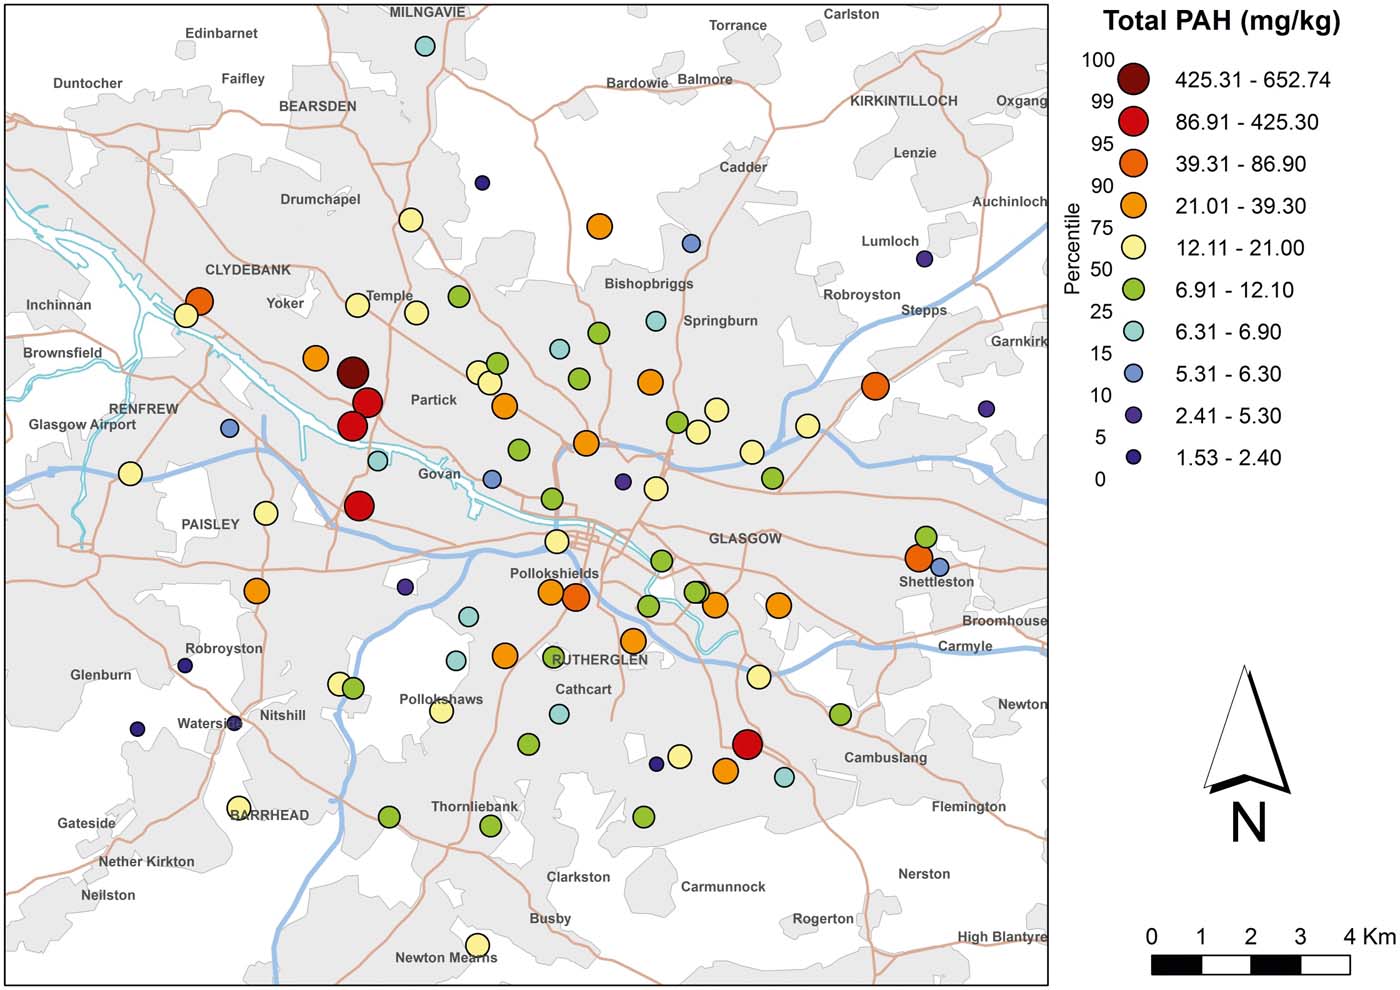
No strong visual spatial trend or gradient in soil ∑16 PAH (Fig. 4) and ∑31 PAH concentration were immediately evident. However there is a group of high ∑16 PAH concentrations (range 86.9–653mgkg–1) along the Govan to Clydebank corridor. Given the area's history of heavy industry (e.g., coal gas production, iron works, coke ovens, brick manufacturing) such concentrations are not untypical and also correspond to the group of high TPH values reported above (Fig. 3). ∑16 PAH concentrations ranged from 1.53 to 653mgkg–1 (Table 4) and for ∑31 PAH ranged from 2.47 to 852mgkg–1. The mean ∑16 PAH was 32.40mgkg–1 and the median value was 12.46mgkg–1 whereas the mean ∑31 PAH was 45.44mgkg–1 and median PAH concentration was 19.01mgkg–1. No appreciable correlation was found to exist between the concentrations of TOCs and ∑16 PAHs (R 2 0.086). A lack of a correlation is not an uncommon finding for soils (Ribes et al. Reference Ribes, Grimalt, Torres García and Cuevas2003; Bucheli et al. Reference Bucheli, Blum, Desaules and Gustafsson2004; Heywood et al. Reference Heywood, Wright, Wienburg, Black, Long, Osborn and Spurgeon2006) and has been ascribed to a situation of non-equilibrium. This is where soot-borne low molecular weight PAH (2–3 rings) partition and equilibrate between the vapour phase and the SOM more readily compared with the more strongly particle bound high molecular weight PAH (4–6 rings) (Bucheli et al. Reference Bucheli, Blum, Desaules and Gustafsson2004). Accordingly, for the Glasgow soils, where HMW PAHs predominate, a lack of correlation of TOC with total PAH concentration may be expected. This is in contrast to sediments, where there is typically some correlation (Charlesworth et al. Reference Charlesworth, Service and Gibson2002; Wang et al. Reference Wang, Sun, Ma and Liu2006; Viguri et al. Reference Viguri, Irabien, Yusta, Soto, Gómez, Rodriguez, Martinez-Madrid, Irabien and Coz2007).
Concentration of polycyclic aromatic hydrocarbons (USEPA; 16 PAH mgkg–1) in near-surface soils (5–20cm) of Glasgow. Soil data BGS, © NERC. Contains Ordnance Survey data © Crown Copyright and database rights 2016.

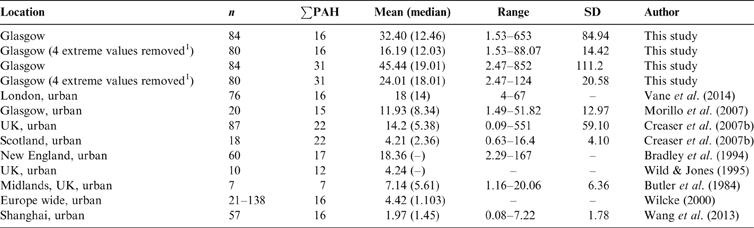
Total PAH concentrations in Glasgow soils compared to urban values obtained by other authors. n = number of samples; ∑PAH = number of PAH compounds determined; SD = standard deviation.

1In the present study PAH concentration ‘extreme values' are defined as 1.5 times the SD.
In the present study the total maximum values, mean and median concentrations were exceeded in all cases when compared with those reported by other workers in five urban areas (Table 4). In a study of PAH in urban soils from 29 towns and cities (n=87) in the UK, Creaser et al. Reference Creaser, Wood, Alcock, Copplestone and Crook2007b reported ∑22 PAH concentrations in the range from 0.09 to 551mgkg–1 (mean 14.2, median 5.38mgkg–1). When the same author selected the data from urban areas of Scotland (n=18) the concentrations were lower from 0.63 to 16.4mgkg–1 (mean 4.21, median 2.36mgkg–1). This difference could be because Creaser et al. (Reference Creaser, Wood, Alcock, Copplestone and Crook2007b) focused on parks, public gardens and common open space areas and the industrial category was separate from their urban category.
The current data set displays a highly positively skewed PAH concentration distribution; four extreme PAH values were observed (∑16 PAH 153–653mgkg–1), and for the purposes of this study this is defined as 1.5 times the standard deviation. Three of these sites were located in the former industrial docklands to the east of central Glasgow and the other from a railway siding, this seems to highlight the correlation of PAH soil contamination with industrial legacy. When these four extreme values were removed from the dataset the ∑16 PAH gave a smaller range from 1.53 to 88mgkg–1 and the ∑31 PAH ranged from 2.47 to 124mgkg–1. The arithmetic mean ∑16 PAH was 16.19mgkg–1 and the median value was 12.03mgkg–1 whereas the mean ∑31 PAH was 24.01mgkg–1 and the median was 18.01mgkg–1. With these four extreme values removed, the concentrations are in broad agreement with the values obtained by other workers listed in Table 4. A direct comparison can be made with a study of urban soils of Glasgow (Morillo et al. Reference Morillo, Romero, Maqueda, Madrid, Ajmone-Marsan, Grcman, Davidson, Hursthouse and Villaverde2007) where ∑17 PAH concentrations (n=20) were reported in the range from 1.49 to 51.82mgkg–1 (mean 11.93, median 8.34mgkg–1). Similarly, Greater London, a UK city with a similar history of heavy industry, has soils with ∑16 PAH concentrations in the range of 4–67mgkg–1 (mean 18, median 14mgkg–1) (Vane et al. Reference Vane, Kim, Beriro, Cave, Knights, Moss-Hayes and Nathanail2014). Urban surface soils from three cities in New England, USA, contained ∑17 PAH 2.29–167mgkg–1 (mean 18.4mgkg–1) (Bradley et al. Reference Bradley, Magee and Allen1994) which again are broadly comparable with those observed here in Glasgow. By contrast, lower amounts of PAHs have been observed in urban soils from Wales and the Midlands/Birmingham (Table 4) (Butler et al. Reference Butler, Butterworth, Kellow and Robinson1984; Wild & Jones Reference Wild and Jones1995). If a typical rural UK soil with 2.24mgkg–1 ∑22 PAH (n=366) is considered (Creaser et al. Reference Creaser, Wood, Alcock, Copplestone and Crook2007b) then the urban soils within this current work contains approximately 14 times the PAH burden based on a mean ∑16 PAH of 32.40mgkg–1. However, it should be borne in mind that the urban and peri-urban concentrations reported here are lower than those found in soils impacted by specific point source pollution such as heavy industry or major chemical spills/leaks. For example, a former tar works site in Newcastle upon Tyne, UK, was found to contain ∑16 PAH concentrations ranging from 6.6 to 1404mgkg–1 in the topsoil (Lorenzi et al. Reference Lorenzi, Cave and Dean2010). Nonetheless, comparison of the Glasgow soil ∑16 PAH concentrations (1.53 to 88mgkg–1; mean 16.19mgkg–1) with those reported for Moscow, Russia (0.06–1.54mgkg–1); Shanghai, China (0.08–7.22mgkg–1, mean 1.97mgkg–1); and Torino, Italy (0.148–23.5mgkg–1; mean 1.99mgkg–1) suggests that Glasgow's soils are more polluted than these other international urban/peri-urban areas (Wilcke et al. Reference Wilcke, Krauss, Safronov, Fokin and Kaupenjohann2005; Morillo et al. Reference Morillo, Romero, Maqueda, Madrid, Ajmone-Marsan, Grcman, Davidson, Hursthouse and Villaverde2007; Wang et al. Reference Wang, Miao, Zhang, Li, Wu and Yu2013).
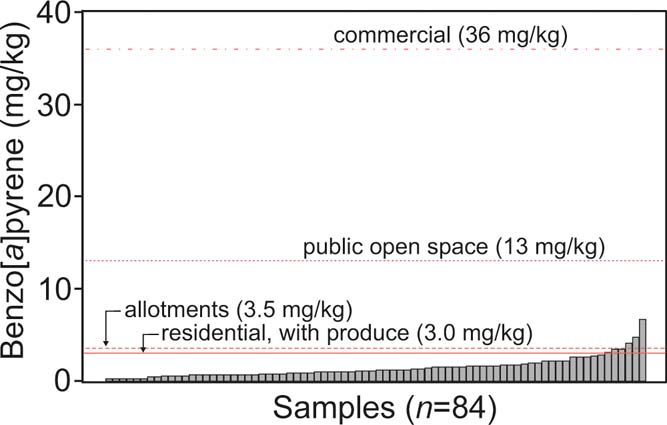
The LQM/CIEH S4ULs include 16 individual PAH compounds, and B[a]P as a surrogate, with six land uses (which included residential, allotment, commercial and public open spaces) and soils up to 6 % SOM. Concentrations of B[a]P were compared with S4ULs for four different land use scenarios (Nathanail et al. Reference Nathanail, McCaffrey, Gillett, Ogden and Nathanail2015) (Fig. 5). In the current study 6% SOM was selected on the basis of 6.15 % TOC (Table 1), whereby a conservative mean of 10.70 %, SOM was calculated using a conversion factor of 1.74 (Pribyl Reference Pribyl2010). Notwithstanding, the B[a]P S4UL for a residential land use with home grown produce was exceeded by six samples, whereas the allotment S4UL was exceeded by three samples. None of the samples exceeded the public open space or commercial S4ULs. In the current study only one sample was collected from each site. This approach does not reflect how representative concentrations for a particular site would typically be derived for risk assessment purposes. In practice many more samples would be taken in the context of informing a conceptual site model of potential linkages between sources of contamination, exposure pathways and relevant receptors.
B[a]P values in Glasgow soils (n=84) compared with four different land use applications LQM/CIEH suitable for use level (S4UL) at 6 % soil organic matter (SOM) (Nathanail et al. Reference Nathanail, McCaffrey, Gillett, Ogden and Nathanail2015). The mean TOC in this study is 6.15 % or 10.70 % SOM.

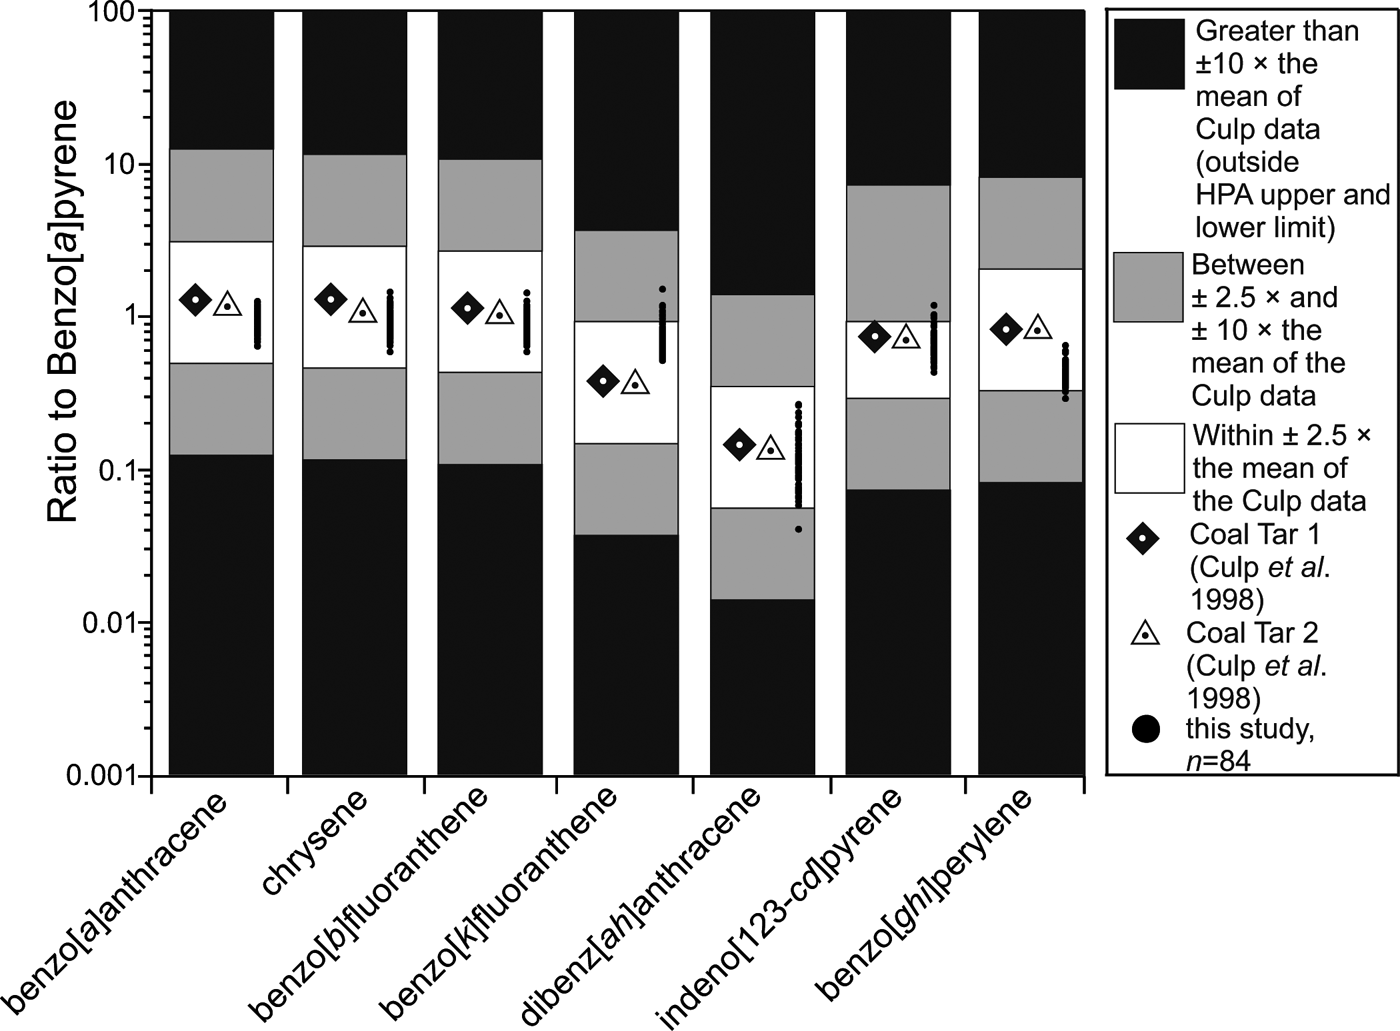
The S4UL for B[a]P as a surrogate marker is intended for use when PAH concentrations can be shown to be equivalent to studies of the toxicity of PAH mixtures (Culp et al. Reference Culp, Gaylor, Sheldon, Goldstein and Beland1998) and used by the Health Protection Agency (HPA 2010). Culp et al. (Reference Culp, Gaylor, Sheldon, Goldstein and Beland1998) reported on toxicity studies of specific mixtures of PAHs. The work remains seminal in our understanding of the toxicity of such mixtures and has informed approaches to human health risk assessment (HPA 2010; Nathanail et al. Reference Nathanail, McCaffrey, Gillett, Ogden and Nathanail2015). If a soil has a PAH mixture sufficiently similar to the ones studied by Culp et al. (Reference Culp, Gaylor, Sheldon, Goldstein and Beland1998), then it is reasonable to use their results to inform risk assessment. A simple spreadsheet tool was used in this study to facilitate the comparison of sample PAH ratios with those studied by Culp et al. (Reference Culp, Gaylor, Sheldon, Goldstein and Beland1998). The Glasgow soils data were compared with, and found to be within an order of magnitude of, the data from Culp et al. Reference Culp, Gaylor, Sheldon, Goldstein and Beland1998 (Fig. 6). This supports the use of B[a]P as a surrogate for the EPA 16 PAHs as advised by the HPA (2010).
Comparison of Glasgow soil PAH concentrations with the mixtures studied by Culp et al. (Reference Culp, Gaylor, Sheldon, Goldstein and Beland1998) indicating the validity of using B[a]P as a surrogate for the US EPA 16 PAH. Figure adapted from LQM spreadsheet tool.

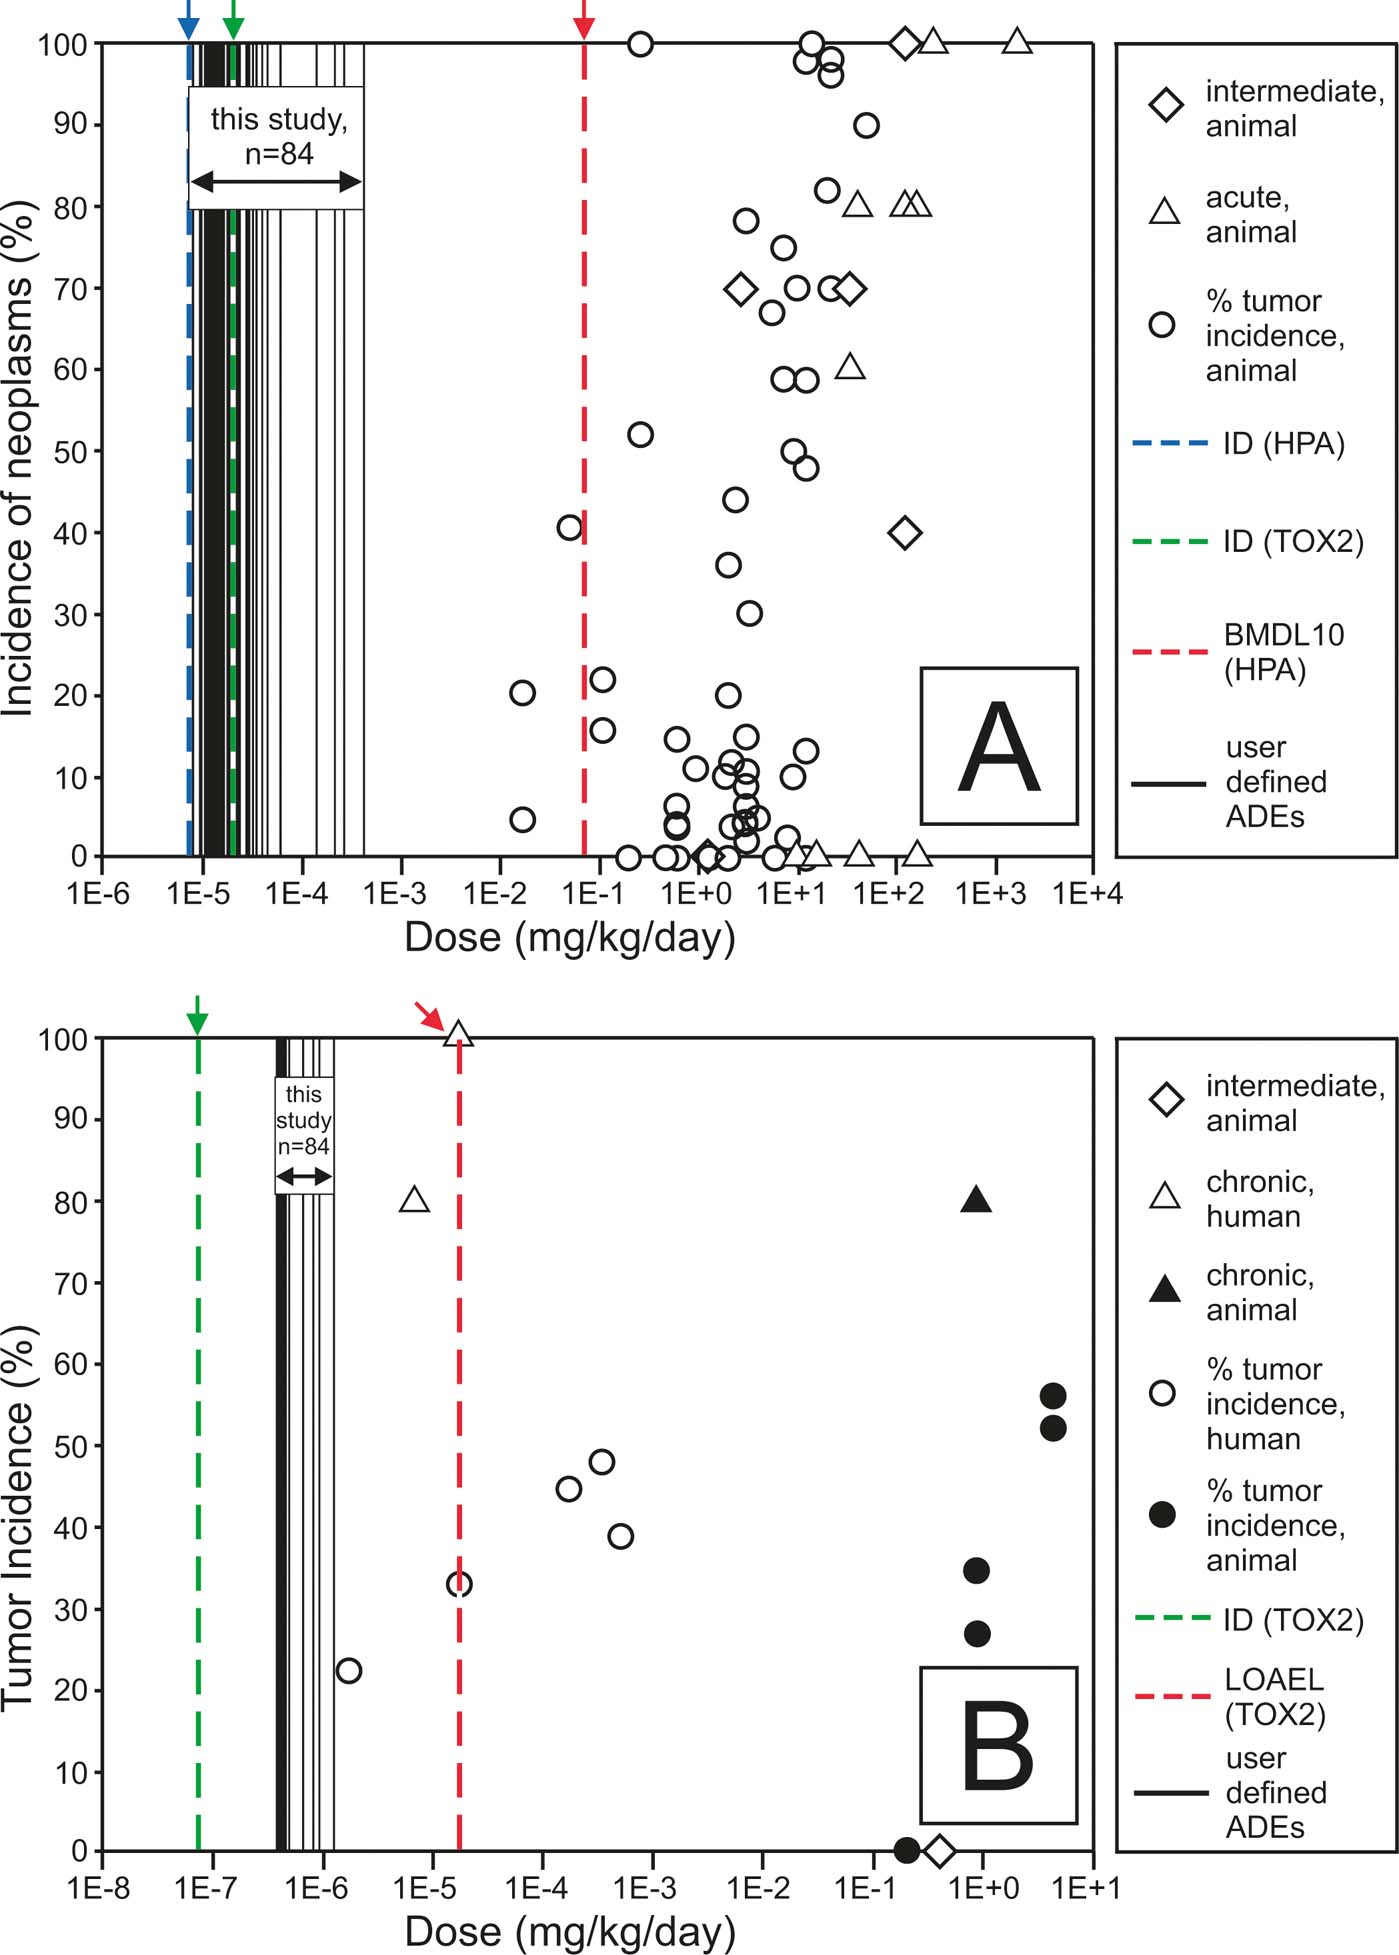
The S4UL are intended as soil-screening values, which if not exceeded, indicate that the soil poses a negligible or minimal level of risk depending on the toxicological behaviour of the contaminant. Some legal regimes require intervention at much higher levels of risk. Part IIA of the Environmental Protection Act 1990 requires Local Authorities in Scotland to determine land as statutory contaminated land if there is likely to be an unacceptable intake of soil contaminant. LQM have developed a series of substance specific tools, the dose–response roadmaps for common contaminants, including B[a]P, to assist in identifying whether or not an intake could be considered unacceptable. The dose–response roadmap for B[a]P allows average daily exposure (ADE) from soil to be plotted on the roadmap and compared against literature values of the adverse effects on human health or laboratory animals. The literature records a wide range of adverse effects of B[a]P (Nathanail et al. Reference Nathanail, McCaffrey, Gillett, Ogden and Nathanail2015). These effects have been converted onto a 10-point scale developed by the US EPA to allow the soil-specific ADE to be compared against all the available toxicological information on a single chart (Fig. 7). This dose–response roadmap shows the ADEs obtained in this study as vertical solid black lines. The adverse effects at different doses are shown using symbols to differentiate human and animal data. Regulatory or other formally published health toxicological values, such as health criteria values, are shown as vertical dashed lines. The dose–response roadmap for B[a]P (Fig. 7) shows that the soils generally would result in exposures lower than the level representing a minimal risk. However, some higher doses are predicted by both ingestion and inhalation. This means that in general the PAHs in the Glasgow soils studied would not pose a level of risk that would trigger determination as contaminated land under Part IIA of the Environmental Protection Act 1990 or would require remediation under the planning regime if a change of land use was being contemplated. Part IIA introduced a new regime specifically to address the legacy of contaminated land, including its identification and remediation. In broad terms, it applies where land is causing unacceptable risks to people or the environment. This is assessed on the basis of the current use and circumstances of the land. However some of the soils studied do represent levels that could result in elevated risk and therefore there is a need for site-specific sampling and risk assessment to support applications for planning permission. Where previous land use history suggests PAHs may have accumulated in the soil in considerable quantities an investigation under Part IIA is reasonable.
Dose–response roadmaps for (A) ingestion exposure and (B) inhalation exposure to soil B[a]P showing that most Glasgow soils would result in exposures posing less than minimal risk but that some individual samples could represent an unacceptable intake. ADE is the average daily exposure; BMDL 10 is the bench mark dose level at 10 % significance level; HPA is the Health Protection Agency; ID is the index dose; LOAEL is the lowest observed adverse effect level (i.e., lowest dose of a chemical in a study, or group of studies, that produces statistically or biologically significant increases in the frequency or severity of adverse effects between the exposed population and its appropriate control). Figure adapted from LQM spreadsheet tool.

2.2.2. PAH distribution and source allocation
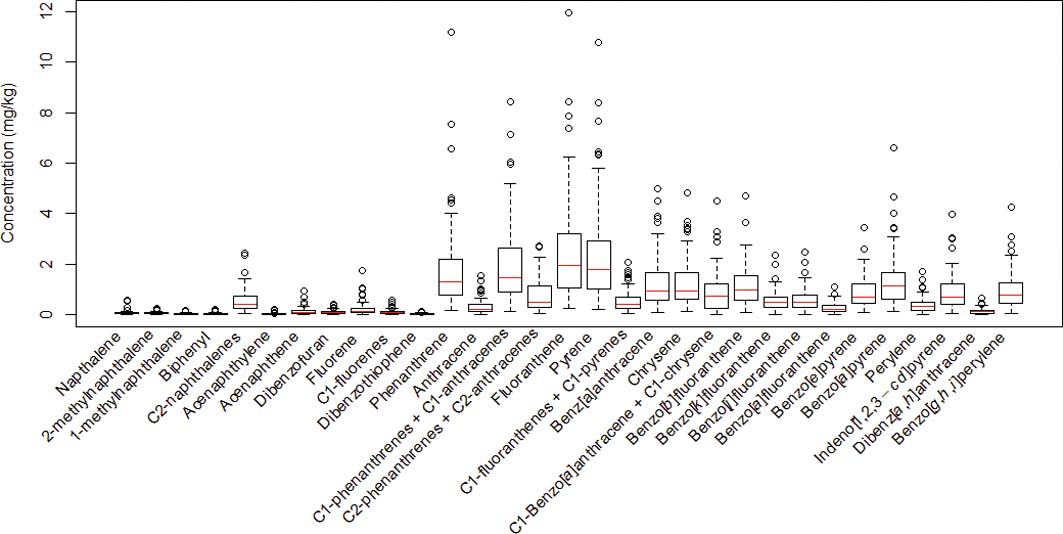
The PAH distribution profiles of Glasgow soils (shown in Fig. 8 with the four extreme values omitted) epitomised the PAH assemblages from the study area. All of the soils presented minor contributions of low molecular weight parent PAH (2–3 rings) such as naphthalene, 1-methylnaphthalene, 2-methylnaphthalene, fluorene, acenapthene and acenapthylene. By contrast, major contributions from higher molecular weight parent PAH (4, 5, 6 rings) including fluoranthene, pyrene, benzo[a]anthracene, chrysene, benzo[k]fluoranthene, benzo[a]pyrene, indenol [1,2,3-cd]pyrene, dibenzo[a,h]anthracene and benzo[g,h,i]perylene were observed (Fig. 8). The exception to this observation being that phenanthrene, the most thermodynamically stable of the 3-ringed parent PAHs, was present also at relatively high amounts in all soils, a similar finding was reported in the soils from Greater London (Vane et al. Reference Vane, Kim, Beriro, Cave, Knights, Moss-Hayes and Nathanail2014).
Box-plot distribution of individual polycyclic aromatic hydrocarbon (PAH) concentrations for Glasgow soils with the four extreme values removed (n=80). The plot shows the upper and lower quartiles (boxes) and median values (horizontal line).

Generally, the soils contained 4-, 5- and 6-ring PAHs, which normally signifies PAHs originating from combustion of fossil fuel (McCready et al. Reference McCready, Slee, Birch and Taylor2000; Vane et al. Reference Vane, Harrison and Kim2007). This is substantiated by the fact that the main pyrolytic PAHs, namely fluoranthene, pyrene, benzo[a]anthracene, chrysene, benzo[k]fluoranthene, benzo[a]pyrene, indenol[1,2,3-cd]pyrene, dibenzo[a,h]anthracene and benzo[g,h,i]perylene, were present at higher concentrations (Fig. 8). Nevertheless, it should be considered that natural processes such as solubilisation, volatilisation and biodegradation can significantly modify PAH distribution (Wilcke Reference Wilcke2000; Katsoyiannis et al. Reference Katsoyiannis, Sweetman and Jones2011). For example, parent PAHs and low molecular weight PAHs are more susceptible to microbial degradation than alkylated PAH and high molecular weight compounds (Douglas et al. Reference Douglas, Bence, Prince, Mcmillen and Butler1996). Consequently, the distribution of parent PAHs in the current study suggests an environmentally altered pyrolytic source.
Perylene is a diagenetic product derived from natural precursors during early diagenesis (Venkatesan Reference Venkatesan1988; Silliman et al. Reference Silliman, Meyers and Eadie1998; Conde et al. Reference Conde, Ayala, Afonso and González2005; Wilcke Reference Wilcke2007) and formed in situ in river sediments (Luo et al. Reference Luo, Chen, Mai, Sheng, Fu and Zeng2008); however, only trace amounts of perylene are produced during combustion (Gonzalezvila et al. Reference Gonzalezvila, Lopez, Martin and del Rio1991; Kakareka & Kukharchyk Reference Kakareka and Kukharchyk2003). Previous workers (Vane et al. Reference Vane, Rawlins, Kim, Moss-Hayes, Kendrick and Leng2013) have demonstrated that perylene was one of the predominant PAHs in five species of upland vegetation and had a greater relative abundance (10–18 %) than is usually observed in particles/soils (<2 %) receiving PAH of anthropogenic/pyrolytic origin. The proportion of perylene to ΣPAH16 in the soils ranged from 1 % to 5 % with a mean of 3 %. Therefore, a possible explanation for a relatively low proportion of perylene in the Glasgow soils is that they are derived from anthropogenic sources.
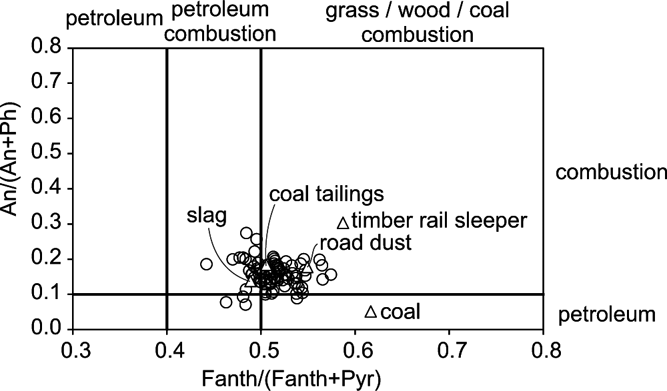
Further evidence for identifying petrogenic vs. pyrolitic PAH sources is demonstrated in the use of isomeric ratio cross-plots which were constructed based on the relative concentrations of isomeric pairs of PAH whose ratios have been identified as diagnostic of their origin (Budzinski et al. Reference Budzinski, Jones, Bellocq and Pierard1997; Yunker et al. Reference Yunker, Macdonald, Vingarzan, Mitchell, Goyette and Sylvestre2002; Tobiszewski & Namiesnik Reference Tobiszewski and Namiesnik2012). This approach can help to elucidate the provenance of PAH in soils and sediments. Owing to source mixing and environmental attenuation, these plots can be considered as indicative and cannot be used to definitely identify PAH pollution sources. An example of this technique is the anthracene/(anthracene + phenanthrene) An/(An+Ph) and fluroanthene/fluroanthene + pyrene Fl/(Fl+Py) cross-plot. Petrogenic PAH can be distinguished from PAH from incomplete combustion/pyrolitic origins because phenanthrene and fluroanthene are more thermodynamically stable than the anthracene and pyrene isomers. Therefore, PAH formed at low temperature (e.g., slow thermal maturation of organic matter in petroleum) produce An/(An+Ph) ratios of <0.1 and Fl/(Fl+Py) of <0.4, whereas PAH formed at higher temperatures (combustion of fossil fuels and vegetation) provide An/(An+Ph) ratios of >0.1 and Fl/(Fl+Py) of >0.4. In the current study, the resulting cross-plot (Fig. 9) revealed that combustion/petroleum combustion sources of PAHs predominated.
Polycyclic aromatic hydrocarbon (PAH) isomeric ratio cross-plot for Glasgow soils (circles) and end members (triangles) showing petroleum vs. combustion (pyrolytic) PAH source apportionment.

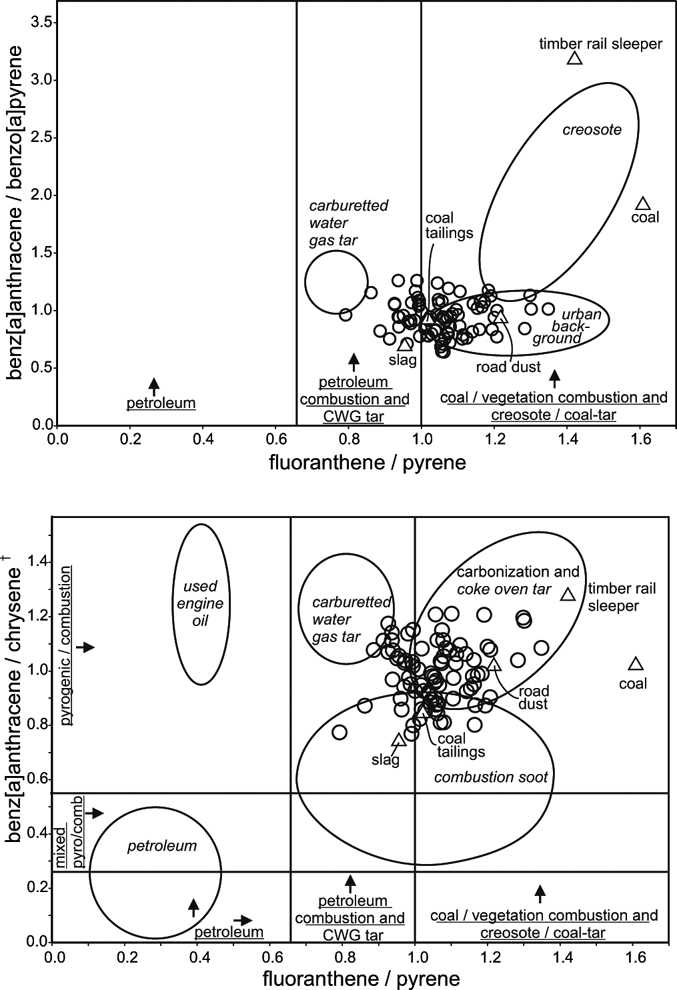
Other isomeric double ratio plots can be applied in a similar way to assess the sample set and help to assess PAH source apportionment (Costa & Sauer Reference Costa and Sauer2005), these are presented in Figure 10. In these two plots, the B[a]A/B[a]P and B[a]A/Ch are plotted against the Fl/Py ratio. The cluster of points in the B[a]A/B[a]P plot shows that the soil PAHs seem to be mainly derived from combustion of petroleum, coal and vegetation, which is indicative of the urban background. However, there does seem to be a possible contribution from carburetted coal water gas (CWG) manufacturing as evidenced by an Fl/Py ratio between 0.65 and 1.00 (McGregor et al. Reference McGregor, Gauchotte-Lindsay, Daéid, Thomas and Kalin2012). Similarly the B[a]A/Ch vs. Fl/Py distribution (Fig. 10) demonstrates a mixed contribution from CWG, coke oven tar production and soot PAH sources.
Double ratio polycyclic aromatic hydrocarbon (PAH) isomeric plots for Glasgow soils (circles) and end members (triangles) showing indicative PAH source apportionment (Costa & Sauer Reference Costa and Sauer2005). CWG, carburetted coal water gas manufacturing. †Ratio calculated using chrysene+triphenylene.

Traffic sources (i.e., diesel soot, road asphalt, uncombusted petroleum) can be a major source of pyrolytic PAH producing a relatively high concentration of B[ghi]P compared to B[a]P. Traffic source PAHs can be inferred when the ratio of B[ghi]P to B[a]P is >3.14 (Creaser et al. Reference Creaser, Wood, Alcock, Copplestone and Crook2007b); however, in this current study all of the soils were <3.14, and ranged from 0.43 to 1.52 with a mean of 0.74mgkg–1. These ratios suggest a pyrolytic PAH source and cannot be definitively assigned to traffic sources, but may arise from other potential sources, which include power stations, combustion by industry and domestic fires/bonfires (Wilcke Reference Wilcke2000, Reference Wilcke2007). A probable explanation for the dominance of high molecular weight combustion derived PAH compounds in the Glasgow soils could be that they are sourced from decommissioned coal burning industry (including steel works and iron), coal gas production sites and domestic fires/bonfires.
In addition to the soils, five end member samples are presented in the cross and double ratio plots (Figs 9, 10) they were a locally sourced coal from a shallow narrow coal seam, industrial slag, coal tailing, road dust and a timber railway sleeper. One example of each end member is presented and some variation between the same end member types would be expected within this study area. For the purpose of this study these five samples are presented to give an indication of broad differences and similarities.
The coal sample was found to have ∑16 PAH concentration of 226mgkg–1 which is broadly similar to some high rank bituminous coals reported to contain up to 164mgkg–1 (Willsch & Radke Reference Willsch and Radke1995). In contrast, the concentrations of ∑16 PAH and B[a]P (226mgkg–1 and 5mgkg–1 respectively) in the Glasgow coal is approximately 20 times greater than the maximum concentration of 11mgkg–1 and 0.25mgkg–1 respectively reported in pure coals from the USA (Stout & Emsbo-Mattingly Reference Stout and Emsbo-Mattingly2008). Consequently coals are a recognised source of native PAH contamination (Achten & Hofmann Reference Achten and Hofmann2009). This particular coal sample also had a high TPH of 9259mgkg–1 with 61 % saturated hydrocarbons (Table 1), which supports the bituminous character observed. In addition the datum point for Fl/Py and B[a]A/B[a]P plots away from the general area of the soil samples in the region of coal combustion, coal tar and creosote (Fig. 10), which demonstrates that significant contribution from this local coal may influence source apportionment inferences.
The PAH from the timber railway sleeper was indicative of creosote application (a timber preservative). Strong evidence for this is presented in Figure 10, whereby examination of the B[a]A/B[a]P vs. Fl/Py isomeric plot of the sleeper datum point falls definitively within the vicinity of the creosote area. The B[a]P concentration was found to be 23mgkg–1; this concentration, although lower, is not too dissimilar to those determined by other workers where the B[a]P ranged from 58 to 749mgkg–1 with a mean of 239mgkg–1 (Ikarashi et al. Reference Ikarashi, Kaniwa and Tsuchiya2005). The order of PAH abundance was Ph > Fl > Py > F > Ae at 555, 413, 290, 160 and 106mgkg–1 respectively, which is in broad agreement to that of Ikarashi et al. Reference Ikarashi, Kaniwa and Tsuchiya2005. The TPH was found to be 23,150mgkg–1 with 75 % being saturated hydrocarbons (Table 1), which suggests that it may have been contaminated by railway engine mineral and/or fuel oil while in use.
The other three end members (road dust, slag and coal tailings) all fell within the range of ratios of the soil samples, indicating a pyrolytic signature and that they all contribute to the urban background (Fig. 10).
2.3. Polychlorinated biphenyls
2.3.1. PCB concentrations
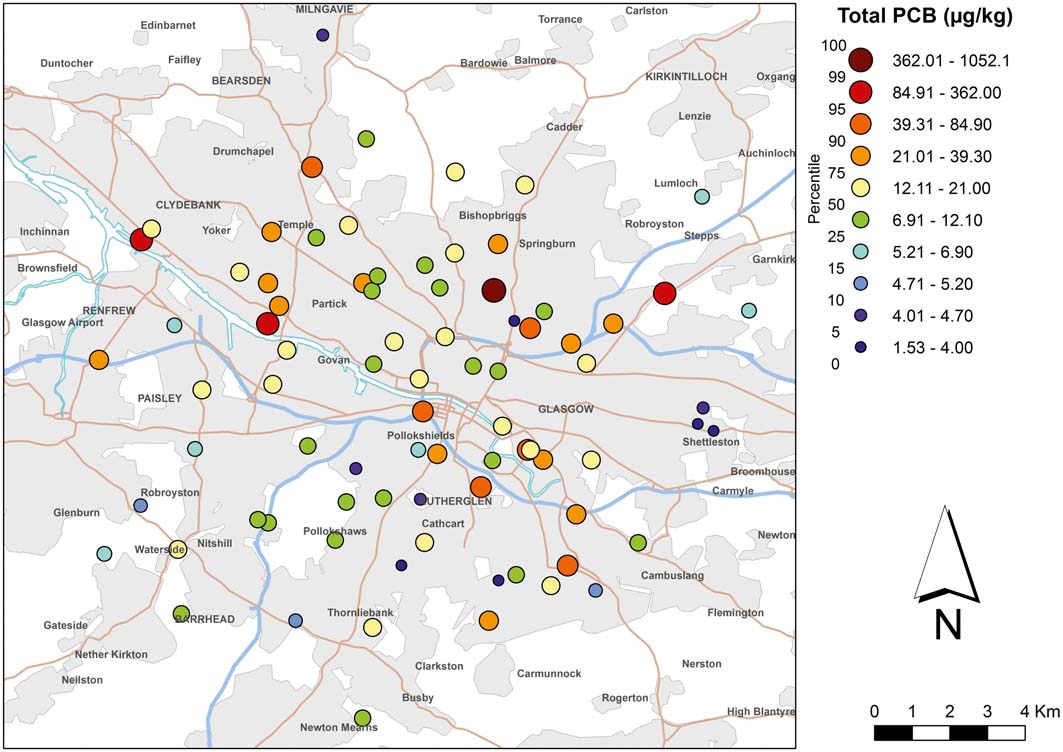
The spatial distribution of PCBs in Glasgow soils is presented in Figure 11. No perceivable visual trend or gradient in soil ∑PCBtri-hepta is observed. ∑PCBtri-hepta concentrations ranged from 2.2 to 1052μgkg–1, with a mean of 32.4μgkg–1 and a median of 12.7μgkg–1 whereas the range of the ∑PCB7 was 0.3 to 344μgkg–1 with a mean of 9.8μgkg–1 and median of 2.7mgkg–1 (Table 3). These concentrations are in comparable agreement with those of a similar study of urban Glasgow where the median of ∑PCB19 was found to be 22μgkg–1 (Cachada et al. Reference Cachada, Lopes, Hursthouse, Biasioli, Grcman, Otabbong, Davidson and Duarte2009). In the current study the lower median of 12.7μgkg–1 probably reflects the fact that peri-urban and some rural soils were included. There was no significant correlation between ∑PCBtri-hepta concentrations and TOC (R2 0.091). This suggests that other factors (e.g., proximity to sources and weather conditions) and/or building demolition waste may be an important controlling factor when considering PCB soil loading (Andersson et al. Reference Andersson, Ottesen and Volden2004; Creaser et al. Reference Creaser, Wood, Alcock, Copplestone and Crook2007a; Cachada et al. Reference Cachada, Lopes, Hursthouse, Biasioli, Grcman, Otabbong, Davidson and Duarte2009).
Concentration of polychlorinated biphenyls (∑PCBtri-hepta μgkg–1) in near-surface soils (5–20cm) of Glasgow. Soil Data BGS, © NERC. Contains Ordnance Survey data © Crown Copyright and database rights 2016.

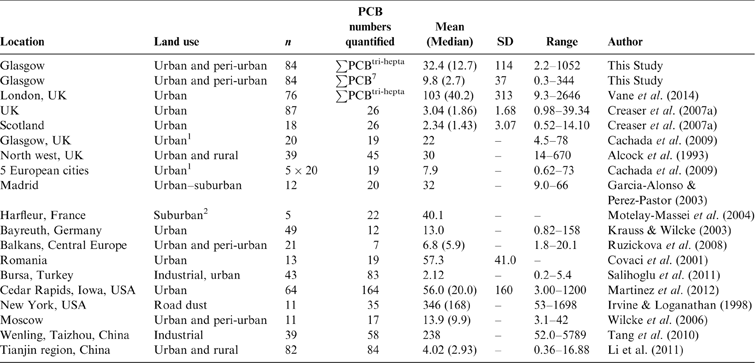
In this study the mean ∑PCBtri-hepta concentration of 32.4mgkg–1 (median 12.7mgkg–1) is broadly similar to those of other national and international urban soils, but are higher than those of other urban studies (Table 5). For example, the Environment Agency reported lower urban soil values in Scotland, where the mean and median ∑PCB26 were 2.34 and 1.43μgkg–1 respectively (Creaser et al. Reference Creaser, Wood, Alcock, Copplestone and Crook2007a). This difference could be due to the larger sum of PCBs used in the current study or the fact that the Creaser et al. (Reference Creaser, Wood, Alcock, Copplestone and Crook2007a) study focused on sampling urban green space rather than the fuller range of land use types investigated in the present study. This can be substantiated in that the current data display a highly positive skewed PCB concentration distribution. The highest recorded concentrations of ∑PCBtri-hepta 1052 and 189μgkg–1 were from sites classified as a former industrial works and a road verge by industrial docks respectively. The presence of these two extreme concentrations (defined as 1.5 times the standard deviation) and two additional sites of high to medium-high concentrations (Fig. 11, key range 84.9–362μgkg–1) from a road verge and the industrial dock area demonstrate the importance of PCB contributions from local sources as evidenced by a large standard deviation of this sample set (mean ∑PCBtri-hepta 32.4±114μgkg–1). These sources possibly originate from a relatively recent leakage from a damaged electrical capacitor or transformer that has undergone minimal soil dilution (Johnson et al. Reference Johnson, Quenson, Chiarenzelli, Hamilton, Morrison and Murphy2006), a site of PCB manufacture (Stratton & Sosebee Reference Stratton and Sosebee1976) and/or from urban road dust (Irvine & Loganathan Reference Irvine and Loganathan1998). These high concentrations are not untypical of other studies (Table 5) that have found similar maximum values in urban areas ranging from 158–5789μgkg–1 (Alcock et al. Reference Alcock, Johnston, McGrath, Berrow and Jones1993; Irvine & Loganathan Reference Irvine and Loganathan1998; Krauss & Wilcke Reference Krauss and Wilcke2003; Tang et al. Reference Tang, Shen, Shi, Cheema, Khan, Zhang and Chen2010; Martinez et al. Reference Martinez, Erdman, Rodenburg, Eastling and Hornbuckle2012; Vane et al. Reference Vane, Kim, Beriro, Cave, Knights, Moss-Hayes and Nathanail2014).
PCB concentrations in Glasgow soils (μgkg–1) compared to values obtained by other authors. n = number of samples; SD = standard deviation.

1Public spaces and away from known contamination.
2Near industry.
Comparing and contrasting median soil ∑PCB concentrations in the global temperate zone, Glasgow has a higher concentration of 12.7μgkg–1 than other soils. For example, concentrations from European cities were found to have 7.9μgkg–1 (Cachada et al. Reference Cachada, Lopes, Hursthouse, Biasioli, Grcman, Otabbong, Davidson and Duarte2009) and in the Balkans, Central Europe, it was 5.9μgkg–1 (Ruzickova et al. Reference Ruzickova, Klánová, Čupr, Lammel and Holoubek2008). It is not unexpected that Glasgow has these elevated concentrations given its long industrial history. It is more comparable to similar urban areas such as London, UK (median 40.2μgkg–1), Bayreuth, Germany (median 13.0μgkg–1), Moscow, Russia (9.9μgkg–1) and Cedar Rapids, USA (20.0μgkg–1) (Krauss & Wilcke Reference Krauss and Wilcke2003; Wilcke et al. Reference Wilcke, Krauss, Safronov, Fokin and Kaupenjohann2006; Martinez et al. Reference Martinez, Erdman, Rodenburg, Eastling and Hornbuckle2012; Vane et al. Reference Vane, Kim, Beriro, Cave, Knights, Moss-Hayes and Nathanail2014). The mean value of 32.4μgkg–1 in the Glasgow soils is approximately seven times less than the city of Taizhou in China (mean 238μgkg–1), which has experienced recent pollution from handling electronic and electrical waste (Tang et al. Reference Tang, Shen, Shi, Cheema, Khan, Zhang and Chen2010).
The seven PCB congeners (PCB 28, 52, 101, 118, 153, 180) as recommended for monitoring by the International Council for the Exploration of the Sea (ICES)/European Union Community Bureau of Reference are commonly measured. In the current study the median soil ∑PCB7 was 2.7μgkg–1 (mean 9.8μgkg–1) and ranged from 0.3 to 344μgkg–1 (Table 3). The proportion of ∑PCB7 was 20 % of the ∑PCBtri-hepta, this is similar to 17 % (of ∑PCB83) from an industrial city in Turkey (Salihoglu et al. Reference Salihoglu, Salihoglu, Aksoy and Tasdemir2011) and 20 % (of ∑PCB57) found in urban and rural soils from Dalian, China (Wang et al. Reference Wang, Yang, Jia, Zhou and Li2008).
A soil guideline value (SGV) (also a GAC) for dioxins furans and dioxin-like PCBs has been published on behalf of Defra by the Environment Agency that uses the World Health Organization (WHO) toxic equivalency factors for deriving average daily exposures and thus the SGV (Environment-Agency 2009). In this study they found that the maximum dioxin-like PCB concentration was 4.01μgkg–1 for PCB 118 (mean 0.44μgkg–1). This PCB is only one of many dioxins, furans and dioxin-like PCBs that may have been present in the samples. PCB 118 contributes 0.1 % to the total exposure of these contaminants at a concentration equivalent to the SGV for congener profiles recorded in UK soils (8μgkg–1 for residential land use with plant uptake) (Environment Agency 2009). These findings suggest that exceedance is possible (mean PCB 118 concentration 0.44μgkg–1 is 18 % of SGV) and that further consideration in future studies may be needed.
An alternative approach, in terms of land quality assessment, the ∑PCB7 concentrations were compared to the Dutch guidelines (VROM 2000). Here the ‘target value' for soil/sediment is 20μgkg–1 and the ‘intervention value' is 1000μgkg–1. Of the 84 sites examined, none was above the intervention threshold and eight sites (10 %) were above the target value. The target value indicates the level at which there is a sustainable soil quality, i.e., it indicates the level that has to be achieved to fully recover the functional properties of the soil for humans and biota and gives the benchmark for environmental quality in the long term on the assumption of negligible risks to the ecosystem. Soil quality guideline (SQG) values of total PCBs were published by the Canadian Council of Ministers of the Environment (Environment-Canada 1999). The approach here defines total PCB as quantified using a ‘total homologue basis, as opposed to individual congeners or Aroclors' and the SQG is derived for different land uses where different receptor and exposure scenarios are considered. These are agricultural, 500μgkg–1; residential parkland, 1300μgkg–1; and commercial/industrial, 33,000μgkg–1. All the Glasgow soils were below the ‘Canadian agricultural SQG' with the exception of one derelict former industrial site where ∑PCBtri-hepta was 1052μgkg–1. This is considerably lower than the specified SQG of 33,000μgkg–1 for commercial/industrial use.
2.3.2. PCB congener distribution
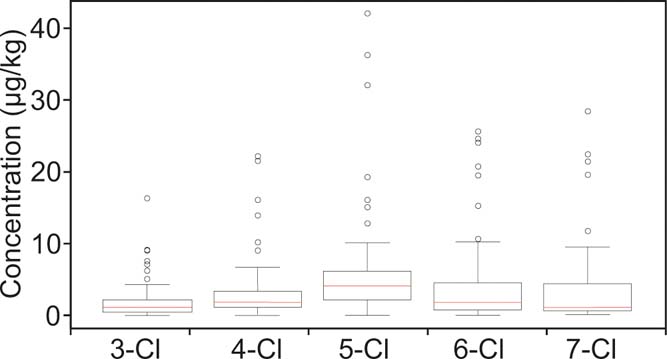
The five separate groups of congener profiles (tri-, tetra-, penta-, hexa- and hepta-CBs) are presented in Figure 12. The interquartile range of the relative contribution of each congener group is represented by the bars to demonstrate the variability between different locations throughout the study area. Generally, the soils are enriched in penta-, hexa- and hepta- chlorobiphenyls (81 % in mean mass). This concurs with the findings of Cachada et al. (Reference Cachada, Lopes, Hursthouse, Biasioli, Grcman, Otabbong, Davidson and Duarte2009), who reported a greater proportion of penta-CB in Glasgow soils. The results are also in agreement with those in urban soils from Cedar Rapids, USA (85 %, which included mono-, di- and octa-CB) (Martinez et al. Reference Martinez, Erdman, Rodenburg, Eastling and Hornbuckle2012).
Box-plot distribution of polychlorinated biphenyl (PCB) congener group concentrations for near-surface soils of Glasgow with two extreme values removed (n=82). Plots show the upper and lower quartiles (boxes) and median values (horizontal line).

Although homologue distributions encountered in urban Glasgow are probably from industrial Aroclor formulations, the proportion of tri-chlorinated was lower than would be expected (Fig. 12). The most plausible explanation being that factors such as volatilisation and partitioning from air to water to soil have probably modified the congener profiles and homologue distributions (Harrad et al. Reference Harrad, Sewart, Alcock, Boumphrey, Burnett, Duarte-Davidson, Halsall, Sanders, Waterhouse, Wild and Jones1994; Johnson et al. Reference Johnson, Quenson, Chiarenzelli, Hamilton, Morrison and Murphy2006). Loss of tri- and tetra-CB congeners (via volatilisation) and the concomitant relative dominance of the heavier chlorinated biphenyls over time (25 years) have been reported (Lead et al. Reference Lead, Steinnes, Bacon and Jones1997). Similarly, Motelay-Massei et al. (Reference Motelay-Massei, Ollivon, Garban, Teil, Blanchard and Chevreuil2004) also reported a depletion of lighter PCB congeners in urban soils compared with rural sites in France. Creaser et al. (Reference Creaser, Wood, Alcock, Copplestone and Crook2007a) commented that using a ratio of PCB 28 to total PCBs as a simple indicator confirms that the average PCB 28 contribution in rural soils is 7 %, while that in urban soils is 2.5 %. The current study demonstrates a similar PCB 28 to total PCB ratio of 3 %, which lends credence to the explanation of the congener pattern in the Glasgow soils.
Other studies have demonstrated the importance of non-Aroclor PCB sources. For example, nona/deca-chlorinated congeners are a by-product in the manufacture of TiCl4 in pigment production and PCB 11 (a dichlorinated PCB) is used to produce diarylide yellow pigment (Du et al. Reference Du, Belton and Rodenburg2008; Praipipat et al. Reference Praipipat, Rodenburg and Cavallo2013). However in the current study the di-, octa-, nona- and deca-CBs were not determined and consequently we are not able to distinguish a non-Aroclor congener signal.
3. Conclusions
This study reports the concentrations of TPHs, PAHs and PCBs in 84 soil samples (5–20cm depth) taken from a 255km2 area of Glasgow during July 2011. ∑16 PAH ranged from 1.53 to 653mgkg–1 with a mean of 32.40mgkg–1 and ∑31 PAH ranged from 2.47 to 852mgkg–1 with a mean of 45.44mgkg–1. Of these, four sites were found to have extreme concentrations that caused the data set to have a highly positively skewed distribution, once these four hotspots were removed the total PAH concentrations were comparable with other cities that have had a long industrial history, giving ∑16 PAH ranging from 1.53 to 88.07mgkg–1 with a mean of 16.19mgkg–1 and ∑31 PAH ranging from 2.47 to 124mgkg–1 with a mean of 24.01mgkg–1. A group of three high PAH concentrations were located in areas of current and former industrial land use. The mean and median B[a]P concentrations in Glasgow soils were 2.83 and 1.16mgkg–1 respectively. Individual B[a]P concentrations were assessed against four different land use scenarios (irrespective of current use) using a GAC, at 6 % SOM. The S4UL criteria were exceeded in six samples for a residential land use (with home grown produce) and three samples for allotment use, but none for public open space or commercial use.
These exceedances suggest PAH may need to be considered where a change in land use is being planned. Isomeric PAH ratios and relative abundance of perylene suggest multiple and environmentally modified pyrogenic PAH sources, inferred to be representative of diffuse pollution.
∑PCBtri-hepta concentrations showed a positively skewed distribution that ranged from 2.2 to 1052μgkg–1 with a mean of 32.4μgkg–1 and the median of 12.7μgkg–1 and was comparable with soils from other industrialised cities. All sites were below the Canadian SQG land use criteria for total PCB concentration. The ∑PCB7 ranged from 0.3 to 344μgkg–1 with a mean of 9.8μgkg–1; these concentrations did not exceed the Dutch (VROM 2000) ‘intervention value' soil guideline of 1000μgkg–1. However 10 % of the sites did exceed the 20μgkg–1 ‘target value', which is the level at which there is a sustainable soil quality. PCB congener profiles were generally dominated by penta-, hexa- and hepta-chlorinated congeners which comprised 81 % of the ∑PCBtri-hepta, which was attributed to loss of tri- and tetra-CB congeners (via volatilisation) and the concomitant relative dominance of the heavier chlorinated biphenyls over time.
4. Acknowledgements
The work documented here was carried out under the British Geological Survey (BGS) Geochemical Baseline Survey of the Environment (G-BASE) and Organic Geochemistry Programmes as part of the Clyde and Glasgow Urban Super Project (CUSP). A.W. Kim and co-authors would like to thank the G-BASE staff and student volunteers for their contributions to the survey including Dr Jenny Bearcock, Andreas Scheib, Sarah Nice and Kevin Barker. Dr Chris Johnson and Dr Diarmad Campbell are thanked for their support and Henry Holbrook for assistance with GIS. Dr Andy Gillett and Dr Richard Ogden of Land Quality Management Ltd are thanked for their assistance in with the PAH profiling, dose-response roadmap and double ratio plot tools. The study was carried out in collaboration with Glasgow City Council and the authors are very grateful to Simon Watson, David Hay, Donald Linn and Robert Watson for their support and assistance with access to allotment sites. Farmers and land owners in the Glasgow area are greatly thanked for their cooperation during the survey. This paper is published by permission of the Executive Director, British Geological Survey. BGS/NERC reference: PRP18/022.