



1. Introduction
When boundary-layer flows are subjected to moderate or high levels of free-stream turbulence (FST), the orderly route to turbulence through amplification and breakdown of linear instabilities can be bypassed, and laminar-to-turbulent transition follows the sporadic eruption of turbulent spots. This complex scenario is common in turbomachinery applications due to the highly perturbed environment (Mayle Reference Mayle1991). Understanding how the FST characteristics affect the so-called bypass transition is thus of utmost importance to predict and model boundary-layer development on turbine blades. Indeed, the laminar or turbulent state of the boundary layer can drive vortex shedding from the blade trailing edge and affect the turbine losses. In this work, we are motivated by the particular case of turbines in organic Rankine cycles (ORCs), which are used to recover waste heat, for example. Since they operate at low temperatures, heat transfer fluids are molecularly complex organic vapours, with high heat capacities and densities compared with light fluids such as air. In recent years, there has been increasing interest in the study of transition in such fluids, which can deviate significantly from the perfect gas model. However, there are still few experimental facilities available (Guardone et al. Reference Guardone, Colonna, Pini and Spinelli2024), and high-fidelity numerical simulation can be used to guide the development of transition models (Cinnella & Gloerfelt Reference Cinnella and Gloerfelt2023). Such ORC applications often imply small-dimension turbines compared with conventional steam turbines, but due to the high fluid density, high Reynolds number conditions are experienced. As a consequence, relatively large-scale turbulence compared with the boundary-layer thickness is oncoming on turbine blades. For instance, in the closed loop organic vapour wind tunnel (CLOWT) facility built at Münster University to study non-ideal-gas dynamics (Reinker et al. Reference Reinker, Hasselmann, aus der Wiesche and Kenig2016), recent experiments (Hake et al. Reference Hake, aus der Wiesche, Sundermeier, Bienner, Gloerfelt and Cinnella2023) have been done to characterize the FST using the perfluorinated ketone Novec649. For typical operating conditions (pressure 4 bar and temperature 100 $^\circ$C), the density of Novec649 is 48.5 kg m
 $^{-3}$, and the integral length scale (
 $L_{f}$, see definition in § 2.4) is of the order of 3 mm, with turbulence intensity
 $T_u=\sqrt {(u'^2+v'^2+w'^2)/3} / U_\infty \sim 3\,\%$ (Hake et al. Reference Hake, aus der Wiesche, Sundermeier, Bienner, Gloerfelt and Cinnella2023). This corresponds to a very high Reynolds number based on
 $L_{f}$ (
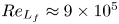 $Re_{L_{f}}\approx 9\times 10^5$), compared with low-speed experiments on bypass transition in air. The main subject of the present study is thus to understand how large-scale intense turbulence can affect the bypass transition. As a first step, a zero-pressure-gradient (ZPG) boundary layer over a flat plate is considered using Novec649 vapour in conditions representative of the CLOWT facility.
1.1. Effects of the integral length scale on FST-induced transition
While it is clear that an increase of  $T_u$, when keeping the other parameters constant, moves the transition upstream (Brandt, Schlatter & Henningson Reference Brandt, Schlatter and Henningson2004; Nagarajan, Lele & Ferziger Reference Nagarajan, Lele and Ferziger2007; Pinto & Lodato Reference Pinto and Lodato2019; Fransson & Shahinfar Reference Fransson and Shahinfar2020; Muthu, Bhushan & Walters Reference Muthu, Bhushan and Walters2021), the effect of the FST integral length scale is less obvious. In the experiments of Jonas, Mazur & Uruba (Reference Jonas, Mazur and Uruba2000) at
 $T_u=3\,\%$, it was found that the final stages of transition occur earlier for FST with large-scale incoming structures, whereas the extent of the transition region shortens with decreasing length scales. Brandt et al. (Reference Brandt, Schlatter and Henningson2004) also reported in their numerical simulations that for a fixed
 $T_u$, larger values of the integral length scale promote earlier transition. Similar results were reported by Ovchinnikov, Piomelli & Choudhari (Reference Ovchinnikov, Piomelli and Choudhari2004), Pinto & Lodato (Reference Pinto and Lodato2019) and Muthu et al. (Reference Muthu, Bhushan and Walters2021). More recently, the extensive experiments of Fransson & Shahinfar (Reference Fransson and Shahinfar2020) showed two scenarios depending on the FST intensity: for low
 $T_u$ (
 ${\le }2.45\,\%$), the transition was moved forward as
 $L_{f}$ increased, whereas the opposite was obtained with larger values of
 $T_u$ (
 ${\ge }2.8\,\%$).
Since streamwise laminar streaks are generally forerunners of the appearance of turbulent spots in most FST-induced transitions, the role of the integral length scale on their characteristics is of the utmost importance. One key property of the streaks is their spanwise scale, which is related to the spanwise velocity gradient, thus affecting the streak destabilization. The spanwise distance between streaks was initially thought to be relatively independent of the FST conditions (see discussion in Fransson & Shahinfar Reference Fransson and Shahinfar2020). Klebanoff (Reference Klebanoff1971) observed in his experiments (reported in Kendall Reference Kendall1998) that the minima of two-point spanwise correlations of the streamwise velocity, corresponding to the average spanwise half-wavelength of the streaks, were almost constant and seemed to be relatively independent of  $T_u$. Kendall (Reference Kendall1985) estimated that the mean distance between low-speed and high-speed streaks was approximately equal to the boundary-layer thickness but was also similar to the lateral scale of the FST. With FST scales approximately twice as big as in Kendall (Reference Kendall1985), Westin et al. (Reference Westin, Boiko, Klingmann, Kozlov and Alfredsson1994) found similar spanwise scales, thus inferring that the spanwise scales were weakly correlated to the FST conditions. Similar streak spanwise distances were also found by Jacobs & Durbin (Reference Jacobs and Durbin2001). Under variable FST intensity (1 %–6 %), Matsubara & Alfredsson (Reference Matsubara and Alfredsson2001) measured a relatively constant value of
 $3\delta ^*$ (
 $\delta ^*$ being the displacement thickness in the transition region), confirming the previous observations. However, this asymptotic value was attained for some cases within the turbulent boundary layer (TBL) and not in the transitional region. The spanwise scales found in the direct numerical simulations (DNS) of Brandt et al. (Reference Brandt, Schlatter and Henningson2004), similar to those of Matsubara & Alfredsson (Reference Matsubara and Alfredsson2001), seemed to be only weakly affected by the FST scales, at least for
 $Re_{L_f}$ between
 $750$ and
 $2250$, where
 $Re_{L_f}$ is the Reynolds number based on the integral length scale and the free-stream velocity. These observations, which contrast sharply with more recent studies, may be due to the fact that relatively similar FST conditions were used in all cited studies.
The experiments of Fransson & Alfredsson (Reference Fransson and Alfredsson2003) were the first to report a significant change in streak spacing due to FST characteristics. Specifically, a significant increase in FST intensity was found to reduce the spanwise distance between streaks. They also suggested that the FST scales play an important role in the spanwise scale selection process. Moreover, they observed that a reduction of the boundary-layer thickness by a factor of two left the streak spacing unchanged, demonstrating that the latter is not directly correlated with the former. Ovchinnikov, Choudhari & Piomelli (Reference Ovchinnikov, Choudhari and Piomelli2008) used two different  $Re_{L_f}$ at comparable FST intensities in order to reproduce numerically the T3B experimental configuration (Roach & Brierley Reference Roach and Brierley1992). They observed that the increase of the integral length scale leads to increased spanwise scales. Similarly, the large-eddy simulations (LES) of FST-induced transition over a turbine blade of Zhao & Sandberg (Reference Zhao and Sandberg2020) showed that the streak spacing depends on the FST and is not directly connected to the boundary-layer thickness. Faúndez Alarcón et al. (Reference Faúndez Alarcón, Morra, Hanifi and Henningson2022) used DNS to study FST transition on an NACA0008 wing, and found that the scales of the free-stream vorticity play an important role in the induced streaks. The preferred spanwise wavenumbers are already set in the FST, and are shown to correspond to those predicted by the optimal disturbance theory (at least for low levels of turbulence intensity where the linear theory is applicable). Thanks to a comprehensive investigation over a wide range of
 $T_u$ (1.8 %–6.2 %) and
 $Re_{L_f}$ (6400–10 000), Fransson & Shahinfar (Reference Fransson and Shahinfar2020) demonstrated that the streak spacing was correlated not to
 $T_u$ or
 $L_f$ separately, but rather to a combination of these two FST parameters. They introduced a Reynolds number
 $Re_{FST}=Re_{L_f}\times T_u$ that reflects this double dependence, and proposed an empirical correlation for the streak spanwise scale.
1.2. Turbulent spot precursors
The second key feature in FST-induced transition is the generation of turbulent spots. In many situations, the turbulent spot precursors come from the destabilization of Klebanoff modes inside the boundary layer. The main breakdown path is related to laminar streaks undergoing secondary instabilities. Andersson et al. (Reference Andersson, Brandt, Bottaro and Henningson2001) carried out secondary instability analyses of optimal streaks and found two different instability modes, namely the sinuous (antisymmetric) and varicose (symmetric) mode. The sinuous and varicose modes, associated respectively with spanwise and wall-normal mean velocity gradients, have been observed in numerous experiments and simulations. In their experiments, Matsubara & Alfredsson (Reference Matsubara and Alfredsson2001) observed that the streak breakdown can be associated with secondary instabilities. In a computational domain containing a single pair of streaks, Brandt & Henningson (Reference Brandt and Henningson2002) simulated an antisymmetric instability leading to the streamwise streak breakdown in a ZPG flat-plate boundary layer. The DNS of Brandt et al. (Reference Brandt, Schlatter and Henningson2004) described in detail the varicose and sinuous instabilities of low-speed streaks, and also suggested that the low-speed and high-speed streaks interactions are important to the breakdown. This was further assessed in Brandt & Lange (Reference Brandt and Lange2008), where sinuous and varicose breakdowns were produced directly due to streak collisions and interactions, without any external disturbances. Mans (Reference Mans2007) reported in his experimental work that the breakdown leading to turbulent spots was initiated by sinuous and varicose modes, and that the critical amplitude of the latter was higher. The relevance of the sinuous secondary instability mechanism for turbulent spots generation was further demonstrated by Schlatter et al. (Reference Schlatter, Brandt, de Lange and Henningson2008). Hoepffner, Brandt & Henningson (Reference Hoepffner, Brandt and Henningson2005) observed that the breakdown of subcritical streaks (with respect to the linear secondary instability theory) can occur by non-modal transient growth, and reported that the spanwise shear participates in the growth of both sinuous and varicose disturbances, whereas varicose perturbations are driven by the action of the wall-normal shear. In such cases, as noted by Durbin (Reference Durbin2017), secondary streak instability could therefore take the form of combined sinuous and varicose modes.
Including the leading edge of the flat plate in their simulations to reproduce the T3A and T3B benchmark cases (Roach & Brierley Reference Roach and Brierley1992), Nagarajan et al. (Reference Nagarajan, Lele and Ferziger2007) also observed that the transition occurs through low-speed streak secondary instabilities for sharp leading edge and low  $T_u$, but interestingly, with increasing FST intensity and bluntness, breakdown is initiated by wavepacket-like disturbances in the boundary layer. Another type of streak instability was discovered by Vaughan & Zaki (Reference Vaughan and Zaki2011). These authors studied secondary instability of idealized streaks, extending the work of Andersson et al. (Reference Andersson, Brandt, Bottaro and Henningson2001) to an unsteady base flow. They identified two unstable modes: inner (varicose) and outer instabilities, named after their vertical position inside the boundary layer. The outer mode, which corresponds to the previously identified sinuous instability (Andersson et al. Reference Andersson, Brandt, Bottaro and Henningson2001), can take the form of a combination of sinuous and varicose instabilities in the case of unsteady streaks. Even if they were not located on a low-speed streak, the near-wall wavepackets spot precursors reported by Nagarajan et al. (Reference Nagarajan, Lele and Ferziger2007) were linked to the inner mode described by Vaughan & Zaki (Reference Vaughan and Zaki2011). Hack & Zaki (Reference Hack and Zaki2014) then compared in detail secondary instabilities of streaks using DNS, either by directly tracking the streak inside the boundary layer or by comparing with two-dimensional (2-D) linear analyses in a cross-section, confirming the theoretical conclusions of Vaughan & Zaki (Reference Vaughan and Zaki2011). Nolan & Zaki (Reference Nolan and Zaki2013) identified the inner instability in their simulations and demonstrated that this mode was promoted by a strong adverse pressure gradient. Finally, Bose & Durbin (Reference Bose and Durbin2016a) identified a helical inner mode in their simulations, resulting from the interaction between Tollmien–Schlichting (TS) waves and streaks.
In some other studies, the turbulent spots are not necessarily associated with streak destabilization. Using a numerical set-up similar to that of Nagarajan et al. (Reference Nagarajan, Lele and Ferziger2007), but with an integral length scale three times larger, Ovchinnikov et al. (Reference Ovchinnikov, Choudhari and Piomelli2008) found an alternative transition mechanism. While the transition was initiated by streak instabilities in their low- $Re_{L_f}$ simulation, the authors reported that for large-scale FST (high
 $Re_{L_f}$), the breakdown was driven by low-speed
 $\Lambda$-shaped structures that did not originate from TS waves and that were formed upstream of laminar streaks. Such low-speed
 $\Lambda$ structures were associated with
 $\Lambda$ vortices, originating from a spanwise vortex filament stretched in the streamwise and wall-normal directions by the boundary-layer mean shear. Similarly, Wu et al. (Reference Wu, Moin, Wallace, Skarda, Lozano-Duràn and Hickey2017) observed that the same
 $\Lambda$ vortices formation mechanism was responsible for the turbulent spot formation in their DNS, and that the low-speed streaks forming downstream were not involved in turbulent breakdown. In a recent review about turbulent spots, Wu (Reference Wu2023) reported that the paths to turbulent spot inception were likely to be classified in two categories: if
 $T_u \le 2\,\%$, then the breakdown occurs by laminar streaks instabilities, whereas for
 $T_u > 2.5\,\%$, the breakdown is driven by oblique vortices interacting with a
 $\Delta$-shaped low-speed patch underneath. The
 $\Delta$-shaped low-speed patch, shown in their supplementary movies available at https://doi.org/10.1017/jfm.2024.567, are analogous to the
 $\Lambda$ low-speed structures reported in Ovchinnikov et al. (Reference Ovchinnikov, Choudhari and Piomelli2008), which appeared by varying the incoming turbulence scale only.
1.3. Scope of the present study
In the present study, we are interested in investigating the influence of high integral length scales ( $L_f$) on the bypass transition on a flat plate for different turbulent intensities (
 $T_{u}$), with specific focus on configurations of interest for ORC turbomachinery. In particular, two different integral length scales, which differ by a factor of seven, are considered at different FST intensities. The linear stability and natural transition of a high-subsonic ZPG flat-plate boundary layer of Novec649 was studied recently by Gloerfelt, Bienner & Cinnella (Reference Gloerfelt, Bienner and Cinnella2023). The flow conditions were selected as representative of the CLOWT, with
 $M=0.9$, temperature 100
 $^\circ$C, and pressure 4 bar. The influence of the thermo-physical models was analysed, and DNS results were compared with LES with or without implicit time marching, demonstrating the suitability of the latter for further FST studies. The stability of the laminar boundary layer was found to be weakly affected by the gas nature in the high-subsonic and low-supersonic velocity range, while dramatic differences were predicted for high-supersonic and hypersonic flow speeds compared with a perfect gas. The main reason for such deviations is that temperature fluctuations are absorbed by the internal degrees of freedom of the complex organic gas, so that boundary-layer thickening due to heat friction is almost absent, and boundary-layer velocity profiles remain close to the incompressible limit. Furthermore, the natural transition triggered by a pair of oblique TS modes was studied by means of DNS and LES. The transition pattern was found to be similar to oblique transition in air flows, while the velocity mean and fluctuating profiles in the turbulent state are almost superimposed with the ones from incompressible DNS, even at the high-subsonic conditions. Inspection of thermo-physical properties essentially showed that the thermal mode is drastically reduced in the dense gas. However, unusual density variations were observed, correlated with pressure ones, thus showing that genuine compressibility effects are still present. For instance, the acoustic mode is not reduced but slightly reinforced compared with air flows. Since the vortical mode is weakly affected by the gas thermodynamic behaviour, it is expected that non-ideal gas effects should play a minor role on FST-induced transition (at least at the considered flow speeds), and that FST transition is driven mainly by the interactions of the large-scale, high-Reynolds-number incoming turbulence with the very thin boundary layer. To prove that, for selected cases, we compare the Novec649 at
 $M=0.9$ with air flows at the same Mach number and at nearly incompressible conditions (
 $M=0.1$). Furthermore, the two cases in air allow us to investigate potential effects of compressibility in the FST-induced transition, which have been addressed in only a relatively small number of studies. Specifically, Klebanoff streaks were found to be slightly stabilized in the compressible boundary layer due to enhanced temperature fluctuations and reduced streamwise velocity fluctuations (Ricco & Wu Reference Ricco and Wu2007; Marensi, Ricco & Wu Reference Marensi, Ricco and Wu2017). This conclusion was also obtained by applying the optimal perturbation theory to the compressible boundary layer (Tumin & Reshotko Reference Tumin and Reshotko1984), showing that the threshold to destabilize laminar streaks is increased. The onset of bypass transition is thus delayed by increasing the Mach number (Ohno et al. Reference Ohno, Selent, Kloker and Rist2023). In the context of Görtler vortices, the Mach number was found not only to affect the strength of the streaks but also to impact the secondary instability process (Ren & Fu Reference Ren and Fu2015).
The present paper is organized as follows. The numerical set-ups are described in § 2. The effects of changing FST properties ( $L_f$ and
 $T_u$) of the gas nature (air versus Novec649) and of compressibility (
 $M=0.1$ and 0.9) are highlighted in § 3. Two competing transition scenarios are analysed in § 4, namely the destabilization of laminar streaks and the generation of
 $\Lambda$ vortices close to the inlet. The existence of these linear and nonlinear routes to turbulence is discussed in § 5, and the main conclusions are summarized in § 6. Appendices A to E give further implementation details and validation cases.
2. Numerical set-up and flow configuration
2.1. Flow solver
The compressible Navier–Stokes equations are solved. They are supplemented with the Peng–Robinson–Stryjek–Vera (PRSV) equation of state (Stryjek & Vera Reference Stryjek and Vera1986) and the Chung–Lee–Starling model (Chung et al. Reference Chung, Ajlan, Lee and Starling1988) for the transport properties for Novec649 vapour. The ideal gas law and Sutherland's model are used for air flows.
The in-house finite-difference code Musicaa is used to solve the governing equations. The inviscid fluxes are discretized by means of tenth-order centred differences, whereas fourth-order finite differences are used for the visco-thermal fluxes. For a prescribed dispersion error of  $5 \times 10^{-4}$, the accuracy limit of the finite-difference scheme is 5.25 points per wavelength. A tenth-order selective filtering is applied to eliminate fluctuations at wavenumbers greater than the finite-difference scheme resolvability. The filter also acts as an implicit LES model, a strategy that has been demonstrated to be effective (Gloerfelt & Cinnella Reference Gloerfelt and Cinnella2019). A four-stage low-storage Runge–Kutta algorithm is used for time integration. To enlarge its stability limit and allow the use of larger time steps, a fourth-order implicit residual smoothing (IRS) method (Cinnella & Content Reference Cinnella and Content2016) is applied. The high-order IRS acceleration, with modifications to enhance robustness (Bienner et al. Reference Bienner, Gloerfelt, Yalçín and Cinnella2023), has been shown to be very efficient in terms of savings of computational time while maintaining a similar accuracy as the explicit method. Periodicity is enforced in the spanwise direction, and adiabatic no-slip conditions are applied at the wall. The non-reflecting conditions of Tam & Dong (Reference Tam and Dong1996) are imposed at the inlet, top and outflow boundaries. Finally, a sponge zone combining grid stretching and a Laplacian filter is added at the outlet.
The solver Musicaa has already been used in previous studies of wall-bounded flows of a heavy fluorocarbon (PP11) in compressible channel flows (Sciacovelli, Cinnella & Gloerfelt Reference Sciacovelli, Cinnella and Gloerfelt2017) and supersonic boundary layers (Sciacovelli et al. Reference Sciacovelli, Gloerfelt, Passiatore, Cinnella and Grasso2020). More recently, the LES strategy and time implication have been assessed carefully for the spatial development of TBLs of Novec649 (Gloerfelt et al. Reference Gloerfelt, Bienner and Cinnella2023). In particular, the fourth-order IRS yielded results in good agreement with the DNS and slightly better than the time-explicit LES, thanks to the less frequent application of the numerical filter.
2.2. Inlet synthetic turbulence
To create turbulent inlet conditions, we use a synthetic flow field based on random Fourier modes (RFMs) (Béchara et al. Reference Béchara, Bailly, Lafon and Candel1994). A homogeneous isotropic turbulent velocity field is generated as the sum of  $N$ independent RFMs:
 \begin{equation} \boldsymbol{u}'_{in}(\boldsymbol{x},t)=\sum_{n=1}^N \hat{u}_n \cos(\boldsymbol{k}_n(\boldsymbol{x}-\bar{\boldsymbol{u}}t)+ \omega_n t+\psi_n)\boldsymbol{a}_n. \end{equation}
Given a logarithmic distribution for the wavenumbers  $k_n=|\boldsymbol {k}_n|$, the mode amplitude
 $\hat {u}_n=\sqrt {2E(k_n)\,\Delta k_n}$ is prescribed from a von Kármán spectrum with Saffman viscous dissipation function and a bottleneck correction (Kang, Chester & Meneveau Reference Kang, Chester and Meneveau2003):
 \begin{align} E(k) &=1.453\,\frac{(u'_{rms})^2 k^4/k_e^5}{\exp(17/6\log(1+(k/k_e)^2))} \times\exp({-}1.5 c_K (k\eta)^2) \nonumber\\ &\quad \times \left[1+0.522\left(\frac{1}{\rm \pi}\arctan(10\log_{10}(k\eta)+12.58)+ \frac{1}{2}\right)\right] \end{align}
with 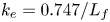 $k_e=0.747/L_f$,
 $c_K=1.613$, and
 $\eta$ the Kolmogorov viscous scale. In (2.1), the phase term
 $\psi _n$, the wavenumber orientation
 $\boldsymbol {k}_n/k_n$ and the velocity direction
 $\boldsymbol {a}_n$ are random variables with given probability density functions. An unfrozen turbulent field is obtained by incorporating the convection velocity
 $\bar {\boldsymbol {u}}$ and the pulsation
 $\omega _n$, accounting for the temporal evolution of the perturbations. In the present simulations, we use
 $N=100$ RFMs. More details on the generation of RFMs can be found in Appendix A. This stochastic velocity
 $\boldsymbol {u}'_{in}$ is windowed by a van-Driest-type damping function to mimic the exponential damping of continuous Orr–Sommerfeld modes in the boundary layer. We use the function proposed by Pinto & Lodato (Reference Pinto and Lodato2019), defined as
 \begin{equation} \sigma_{damp}(y) = (1 - \exp({-y/(0.137 \times h)}))^{1000}, \end{equation}
where  $h$ corresponds to the height where the coefficient is equal to
 $0.5$, and needs to be prescribed by the user. The synthetic turbulence is also damped at the upper corner of the inlet to prevent it from being injected too close to the upper boundary condition. It is entered using a modified Tam–Dong boundary condition (see Appendix in Gloerfelt et al. Reference Gloerfelt, Bienner and Cinnella2023). The T3A benchmark case (Roach & Brierley Reference Roach and Brierley1992) is used in Appendix B to validate the strategy based on synthetic turbulence. In particular, the injection height
 $h$ is a free parameter that can influence the precise location of transition. Nonetheless, FST-induced transition is well reproduced as long as the turbulence is injected above
 $\delta _{99,in}$. Thereafter,
 $h$ is kept equal to
 $1.21\delta _{99,in}$, for all cases (see figure 1a).
(a) Damping function  $\sigma _{damp}$, identical among cases, and (b) initial kinetic energy spectra for the inlet synthetic turbulence. Low
 $L_f$ at
 $T_u=2.5\,\%$ (
 ), 4 % (
 ) and 6.6 % (
 ); high
 $L_f$ at
 $T_u=2.5\,\%$ (
 ) and 4 % (
 ).

2.3. Operating conditions
The operating conditions are given in table 1. The selected configuration for Novec649 vapour corresponds to nominal operating conditions of the CLOWT facility (Reinker et al. Reference Reinker, Hasselmann, aus der Wiesche and Kenig2016), which is a continuously running a pressurized closed-loop wind tunnel using Novec649 in the high subsonic speed range. Two flow speeds are chosen for simulations with air: a low subsonic speed ( $M=0.1$) to reproduce an incompressible-like case, and a high subsonic speed (
 $M=0.9$) corresponding to the Mach number used for Novec649. The fundamental derivative of gas dynamics, defined as
 $\varGamma =1+({\rho }/{c}){({\partial c}/{\partial \rho })}_s$ (
 $s$ being the entropy) governs the nonlinear thermodynamic behaviour of dense gases. It is equal to
 $(\gamma +1)/2$ for a perfect gas. At the conditions chosen for Novec649,
 $\varGamma$ has a value below 1, meaning that the flow operates in the dense-gas thermodynamic region, often encountered in ORC applications. A preliminary study of oblique transition of a Novec649 boundary layer was carried out for the same thermodynamic conditions (Gloerfelt et al. Reference Gloerfelt, Bienner and Cinnella2023), and assessed the use of PRSV/Chung–Lee–Starling models to describe the fluid behaviour.
Thermodynamic and aerodynamic free-stream conditions (subscript  $\infty$):
 $M$ denotes the Mach number,
 $U$ the velocity,
 $c$ the sound speed,
 $p$ the pressure,
 $T$ the temperature,
 $\rho$ the density,
 $\mu$ the dynamic viscosity and
 $\varGamma$ the fundamental derivative of gas dynamics.

2.4. Set-up of LES
Simulations are initialized with similarity solutions of the compressible laminar boundary layer with zero pressure gradient. The Reynolds number at the inlet is taken as  $Re_{x,in} = 10^4$. In the Novec cases, five different FST conditions are analysed. For the lowest value of the integral length scale (hereafter referred to as ‘low-
 $L_f$’), three turbulent intensities (2.5 %, 4 % and 6.6 %) are tested. The ‘high-
 $L_f$’ cases consider an integral length scale target multiplied by a factor of ten for two values of
 $T_{u,in}$ (2.5 % and 4 %). For simulations in air, the low-
 $L_f$ and high-
 $L_f$ cases are reproduced at
 $T_u=4\,\%$ for two values of the Mach number (0.1 and 0.9). The different LES are summarized in table 2, with the corresponding grids and line legends. For the low-
 $L_f$ cases, the Reynolds number based on the integral length scale,
 $Re_{L_f}$, is the same as that used to reproduce the T3A experiment in Appendix B, and it is of similar magnitude to that used in most published FST transition experiments (Mans Reference Mans2007; Mandal, Venkatakrishnan & Dey Reference Mandal, Venkatakrishnan and Dey2010) and simulations (Brandt et al. Reference Brandt, Schlatter and Henningson2004; Nagarajan et al. Reference Nagarajan, Lele and Ferziger2007; Pinto & Lodato Reference Pinto and Lodato2019). The effective integral length scale
 $L_f$ at the inlet is determined by integration of the temporal autocorrelation function
 $f$ of the velocity signal:
 \begin{equation} L_f = U_\infty \int_0^{t} f(\tau) \,{\rm d}\tau, \end{equation}
where the upper limit of integration is set as the first zero crossing of  $f$ (Kurian & Fransson Reference Kurian and Fransson2009). The Reynolds number based on the integral length scale is defined as
 $Re_{L_f} = L_f U_\infty \rho _\infty / \mu _\infty$. For the high-
 $L_f$ cases, the target value
 $Re_{L_f,t}$ has been multiplied by ten to investigate the effect of large incoming disturbances. The calculated value is
 $Re_{L_f,c} \sim 14\,000$, corresponding in the end to a factor of seven. The differences in turbulent scales are clearly visible in figure 2. Following Fransson & Shahinfar (Reference Fransson and Shahinfar2020), we also introduce an FST Reynolds number,
 $Re_{FST}=T_u\times Re_{L_f}$, given in table 2.
Computational grid and FST properties of the simulations.

Snapshot of the streamwise velocity in the mid-span plane. Colour scale between  $0.9 U_\infty$ (blue) and
 $1.1 U_\infty$ (red) for (a) low-
 $L_f$ and (b) high-
 $L_f$ Novec cases at
 $T_u=4\,\%$. For the high-
 $L_f$, high-
 $T_u$ case in (b), only half of the domain height is shown.

The computational grid resolution needs to comply with two major constraints. The first concerns the resolution of the near-wall boundary-layer flow, for which a target resolution in wall units  $\Delta x^+\times \Delta y_{w}^+\times \Delta z^+\sim 30\times 1.0\times 11$ has been determined in a previous study (Gloerfelt et al. Reference Gloerfelt, Bienner and Cinnella2023). The second constraint is the resolution of the free-stream disturbances, which is driven by the values of the RFM wavenumber bounds
 $k_{min}$ and
 $k_{max}$. In the high-
 $L_f$ simulations,
 $k_{min}$ is such that the crossflow dimensions
 $L_y$ and
 $L_z$ are at least
 ${\sim }10 L_{f}$, which leads to
 $L_y/\delta ^*_{in} = 1100$ and
 $L_z/\delta ^*_{in} = 980$. The obtained
 $L_z$ is halved in the low-
 $L_f$ simulations, yielding
 $L_z\sim 50 L_{f}$. In particular, in the low-
 $L_f$ simulations,
 $L_z/\delta ^*_{in} = 490$ and
 $L_y/\delta ^*_{in} = 270$. We then choose
 $k_{max}\ge 7 k_{L_f}$, which gives a maximal value for the grid spacings to accurately resolve the injected modes (based on the resolvability limit of the current numerical scheme). The resulting resolutions given in table 2 are typical of wall-resolved LES. The streamwise resolution
 $\Delta x^+\sim 13$–
 $14$ for the low-
 $L_f$ cases is dictated by the FST, as shown by the inlet spectra in figure 1(b). On the contrary, when the integral length scale is relatively large, the boundary-layer resolution constraint is more restrictive and the streamwise spacing is
 $\Delta x^+\sim 27$–
 $28$. These resolutions have been shown to be sufficient to accurately capture a modal transition and the fully turbulent state of the boundary layer (Gloerfelt et al. Reference Gloerfelt, Bienner and Cinnella2023). To make sure that the receptivity to FST is not affected by grid resolution, the high-
 $L_f$, high-
 $T_u$ case at
 $M=0.9$ in air has been simulated on a grid with a DNS resolution
 $\Delta x^+\times \Delta y_{w}^+\times \Delta z^+\sim 10.5\times 0.8\times 4.3$, keeping the same RFM wavenumber bounds as the LES. Although transition occurs a little earlier (as also observed e.g. in Sayadi & Moin Reference Sayadi and Moin2012), the results, reported in Appendix C, remain nearly superimposed with DNS in the transitional region, which validates the present LES resolution. Furthermore, a second run of DNS has been performed with
 $k_{max}$ increased to match the limit imposed by the DNS grid to investigate the influence of an increase of the high-frequency content of the FST on the breakdown. The results are perfectly superimposed on the first DNS, validating the choice
 $k_{max}\ge 7 k_{L_f}$ used for the LES study. The sensitivity to the choice of
 $k_{min}$ has also been checked in Appendix D.
After the initial transient has been discarded, span- and time-averaged quantities are collected over  $70\,000$ time steps for the cases at
 $M=0.9$, and
 $300\,000$ time steps for those at
 $M=0.1$. The evolutions of the averaged FST intensity are compared for the five Novec cases in figure 3(a). As expected, when
 $L_f$ is increased, the decay slope of the FST evolution is decreased. Therefore, in the high-
 $L_f$ cases, the turbulence intensity remains greater than 3 % and 2 % for the high- and low-
 $T_u$ cases, respectively, whereas the turbulence intensities for the low-
 $L_f$ cases are rapidly below
 $2\,\%$. In order to estimate the homogeneity of the FST,
 $T_u$ evolutions are plotted in figure 3(b) at three wall-normal locations in the free stream and compared with the averaged one for the low-
 $L_f$, high-
 $T_u$ Novec case. The curves match perfectly, meaning that good homogeneity is obtained for the injected synthetic turbulence. Furthermore, to assess the turbulence isotropy,
 $T_u$ evolutions for the three velocity components are reported in figure 3(c). Slight discrepancies can be observed close to the inlet, but the intensity of the three velocity components stays within 7 % of
 $T_u$, so the FST can be considered as approximately isotropic.
Evolution of the turbulence intensity for the different Novec cases: (a) low  $L_f$ at
 $T_u=2.5\,\%$ (
 ), 4 % (
 ) and 6.6 % (
 ); high
 $L_f$ at
 $T_u=2.5\,\%$ (
 ) and 4 % (
 ). FST homogeneity (b) and isotropy (c) of the Novec low-
 $L_f$, high-
 $T_u$ case. Here,
 $T_u=\sqrt {(u'^2+v'^2+w'^2)/3}/ U_\infty$,
 $T_{u,x} = \sqrt {u'^2}/ U_\infty$,
 $T_{u,y} = \sqrt {v'^2}/ U_\infty$ and
 $T_{u,z} = \sqrt {w'^2}/ U_\infty$.

3. Influence of flow conditions on transition location
First, the influence of the FST characteristics on the bypass transition is analysed for the organic vapour flows. Then for  $T_u=4\,\%$, the Novec boundary layers are compared with air flows in an incompressible-like (
 $M=0.1$) and compressible (
 $M=0.9$) configuration in order to quantify dense-gas and compressibility effects on the FST-induced transitions.
3.1. Influence of FST characteristics
The friction coefficient evolutions in the dense-gas boundary layers are reported in figure 4. All the flows transition to a fully turbulent state in the computational domain, except for the low- $L_f$, low-
 $T_u$ case. Here, onset of transition denotes the location of minimal friction coefficient, and the end of the transition is the location of maximal friction coefficient. As expected, an increase of the inlet turbulence intensity always leads to a faster onset and termination of the transition, for both high- and low-
 $L_f$ cases. Similarly to Fransson & Shahinfar (Reference Fransson and Shahinfar2020), a double effect is observed by changing
 $L_f$. For
 $T_u=2.5\,\%$, an increase of the integral length scale moves the transition region upstream, whereas for
 $T_u=4\,\%$, an increase of
 $L_f$ extends the transition region. For
 $T_u=4\,\%$, the slope of the
 $C_f$ rise in the transition region with a high
 $L_f$ is smoother than with a low
 $L_f$, so that even if the transition onset occurs earlier, the end of the transition region is shifted downstream.
Distribution of the friction coefficient for the different cases with Novec649 vapour: low  $L_f$ at
 $T_u=2.5\,\%$ (
 ), 4 % (
 ) and 6.6 % (
 ); high
 $L_f$ at
 $T_u=2.5\,\%$ (
 ) and 4 % (
 ). The black solid line shows laminar correlation
 $C_{f,lam}=0.664/\sqrt {Re_x}$.

The streamwise evolutions of the maximum of  $u_{rms}$, in figure 5(a), are often correlated with the streak growth. For the low-
 $L_f$, high-
 $T_u$ case, a fast increase of
 $u_{rms,max}$ is observed in the pre-transitional region, i.e. prior to the minimum of skin friction (at
 $Re_\theta \approx 220$), and can be associated with the transient energy growth in the early streak development. The growth rate then slows down before a secondary growth phase, associated with the eruption of turbulent spots (Nolan & Zaki Reference Nolan and Zaki2013), yields the peak at approximately
 $Re_\theta =340$. A slower growth of
 $u_{rms,max}$ in the pre-transitional region is obtained for the low-
 $L_f$, low-
 $T_u$ boundary layer, in accordance with the lower FST intensity. An inflection point is visible near
 $Re_\theta \sim 120$ for the low-
 $L_f$ cases with
 $T_u=2.5\,\%$ and 4 %. For the low-
 $L_f$ case with
 $T_u=6.6\,\%$, the growth is so fast that no inflection is noticeable before the main peak. For the high-
 $L_f$ cases, a first peak is visible in the pre-transitional region, just prior to the location of the inflection point of the low-
 $L_f$ cases. This first local maximum is not linked to the laminar streak growth, and is also present in the results extracted from the database of Wu et al. (Reference Wu, Moin, Wallace, Skarda, Lozano-Duràn and Hickey2017). In their simulation, homogeneous isotropic turbulence (HIT) is injected at a height equal to 15
 $\delta _{99,in}$ with an inlet
 $Re_\theta =80$, explaining the offset with our curves. As their simulation was characterized by the appearance of low-speed
 $\Lambda$-shaped structures prior to laminar streaks, the early secondary peak can be associated with the growth of these structures, which could also be present in the high-
 $L_f$ simulations. In figure 5(b), the height for the maximum of
 $u_{rms}$ is approximately the same for all cases. The location
 $y(u_{rms,max})$ moves from values approximately
 $1.2\delta ^*\unicode{x2013}1.4\delta ^*$ in the pre-transitional region, as predicted by the optimal perturbation theory (Andersson, Berggren & Henningson Reference Andersson, Berggren and Henningson1999; Luchini Reference Luchini2000), towards a low level in the TBL, associated with the near-wall turbulent streaks. The evolutions are also in agreement with low-speed airflow results of Wu et al. (Reference Wu, Moin, Wallace, Skarda, Lozano-Duràn and Hickey2017), except for a slightly lower altitude in the laminar region.
Evolution of (a)  $u_{rms,max}/U_\infty$ and (b) its height
 $y(u_{rms,max})/\delta ^*$. Low
 $L_f$ at
 $T_u=2.5\,\%$ (
 ), 4 % (
 ) and 6.6 % (
 ); high
 $L_f$ at
 $T_u=2.5\,\%$ (
 ) and 4 % (
 ).

Instantaneous top views of the streamwise velocity fluctuations at  $y/\delta ^*_{in} = 3.1$ are shown in figure 6, using the same streamwise and spanwise extents to provide an overview of the structures present inside the boundary layer and a first qualitative comparison of the Klebanoff streaks. The streak formation and the presence of turbulent spots are clearly revealed for each case, except for the case
 $T_u=6.6\,\%$, which is highly disturbed. A first important observation is that the scales associated with Klebanoff modes are different between the low-
 $L_f$ and high-
 $L_f$ cases. At constant
 $L_f$ and to a lesser degree, the spanwise distribution of the laminar streaks is also affected by the FST intensity, in particular for the low-
 $L_f$ boundary layers. In the low-
 $L_f$, low-
 $T_u$ case, the spanwise scale of the Klebanoff modes increase as the boundary layer thickens. Moreover, the presence of low-speed
 $\Lambda$-shaped structures is clearly revealed in the instantaneous snapshots for the high-
 $L_f$ cases, as highlighted by the grey circles in the figure. These
 $\Lambda$-shaped structures bear a strong resemblance to the quasi-periodic spanwise structures described by Ovchinnikov et al. (Reference Ovchinnikov, Choudhari and Piomelli2008), and the
 $\Delta$-shaped structures in Wu et al. (Reference Wu, Moin, Wallace, Skarda, Lozano-Duràn and Hickey2017). As in Ovchinnikov et al. (Reference Ovchinnikov, Choudhari and Piomelli2008), they are located prior to laminar streaks. For
 $T_u=2.5\,\%$, a
 $\Lambda$ structure begins to emerge at the location
 $(x/\delta ^*_{in},z/\delta ^*_{in})=(75,125)$, at approximately
 $Re_{\theta }=100$, where the first peak was identified in figure 5. The low-
 $L_f$,
 $T_u=6.6\,\%$ case, in figure 6(c) also seems to show several similar structures close to the inlet, but as this case is very disturbed, this is difficult to observe clearly. For the low-
 $L_f$ cases in figures 6(a,b), the visualizations do not clearly reveal similar structures near the inlet. This point is discussed in details at the end of § 4.2.
Instantaneous streamwise fluctuations in a wall-parallel plane at  $y/\delta ^*_{in} = 3.1$. Low-
 $L_f$ cases (a)
 $T_u=2.5\,\%$, (b)
 $T_u=4\,\%$ and (c)
 $T_u=6.6\,\%$; and high-
 $L_f$ cases (d)
 $T_u=2.5\,\%$ and (e)
 $T_u=4\,\%$. The vertical dashed lines mark the location where
 $Re_{\theta }=100$. Some occurrences of
 $\Lambda$-shaped structures are marked by grey ellipses.

3.2. Compressibility and dense-gas effects
For  $T_u=4\,\%$, additional simulations are carried out at the same conditions (same resolution) with air at Mach numbers
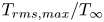
 $M=0.1$ and 0.9, to sort out compressibility and non-ideal gas effects on the FST-induced transition. The friction coefficient evolutions show the same trend for low (figure 7a) and high (figure 7b) integral length scales. First, comparing air boundary layers at the two flow speeds, an increase of the Mach number tends to slightly delay the transition and reduces the friction value in the turbulent state due to the friction heating at the wall. As reported by Marensi et al. (Reference Marensi, Ricco and Wu2017) and Ohno et al. (Reference Ohno, Selent, Kloker and Rist2023), temperature fluctuations are enhanced by compressibility, and streamwise velocity fluctuations are consequently reduced. This can be seen in figure 8, where thermal streaks present in the air boundary layer at
 $M=0.9$ (figure 8a) have an intensity
 $T_{rms,max}$ (
 ${\sim }3\,\% T_\infty$) significantly higher than at
 $M=0.1$ (figure 8b). Note that thermal fluctuations for the dense-gas flow at
 $M=0.9$ are very low due to the high thermal capacity of the organic vapour. As a consequence, the
 $C_f$ levels of Novec649 simulations in the fully turbulent state collapse on those of air boundary layers at
 $M=0.1$ or of incompressible simulations (as noted in previous studies such as Gloerfelt et al. Reference Gloerfelt, Bienner and Cinnella2023). However, the
 $C_f$ curves of Novec simulations in the transitional region show that the use of an organic vapour delays the transition even more than the effects of compressibility. This can be explained by the excitation of internal degrees of freedom of the complex Novec649 molecules, that further reduces streamwise velocity fluctuations. This stabilizing effect is of the same nature as that due to the increase in thermal fluctuations, but is more significant. It was also noted in the boundary layer stability of Gloerfelt et al. (Reference Gloerfelt, Bienner and Cinnella2023), where the neutral curve for Novec649 at
 $M=0.9$ is contained in that for the same boundary layer in air. The evolutions of
 $u_{rms,max}$ for low and high
 $L_f$ are reported in figures 9(a,b), respectively. The hierarchy observed for transition onset is respected, i.e. velocity fluctuations in air at
 $M=0.1$ are slightly reduced in air at
 $M=0.9$, and further reduced in Novec at
 $M=0.9$ for both FST length scales. The curves are, however, very close for a given
 $L_f$, meaning that the compressibility and non-ideal gas effects are present but secondary compared with the effects of the FST length scale. It can be concluded that the observations made in § 3.1 about the influence of
 $L_f$ on transition are the same in the air and organic vapour flows.
Distribution of the friction coefficient for the (a) low- $L_f$ and (b) high-
 $L_f$ cases at
 $T_u=4\,\%$ for Novec649 at
 $M=0.9$ (circles) and for air at
 $M=0.1$ (diamonds) and 0.9 (triangles). The solid black line shows laminar correlation
 $C_{f,lam}=0.664/\sqrt {Re_x}$.

(a) Instantaneous temperature fluctuations  $T'/T_\infty$ at
 $y/\delta ^*_{in}=3.1$ in the low-
 $L_f$, high-
 $T_u$ air
 $M=0.9$ case. (b) Evolution of
 $T_{rms,max}/T_\infty$ for the low-
 $L_f$ cases at
 $T_u=4\,\%$, for Novec at
 $M=0.9$ (
 ) and for air at
 $M=0.1$ (
 ) and 0.9 (
 ).

Evolution of  $u_{rms,max}/U_\infty$ for the (a) low-
 $L_f$, high-
 $T_u$ and (b) high-
 $L_f$, high-
 $T_u$ cases, for Novec649 at
 $M=0.9$ (circles) and for air at
 $M=0.1$ (diamonds) and 0.9 (triangles).

The similarities between the various flows is shown further by the instantaneous views of  $u'$ in a wall-parallel plane in figure 10 (see supplementary movies). At a given free stream
 $L_f$, the laminar streaks retain at first sight similar spanwise distributions and are weakly affected by compressibility or non-ideal gas effects (this will be quantified in § 4.1). For high-
 $L_f$ cases, the same
 $\Lambda$-shaped structures are observed in air flows, meaning that their presence is linked to the FST characteristics rather than dense-gas or compressibility effects. Overall, at the selected thermodynamic conditions, the FST-induced transition is only slightly modified by the high-subsonic regime or the organic vapour thermo-physical properties.
Comparison of air and Novec transitional flows at  $T_u=4\,\%$ with (a,c,e) low
 $L_f$ and (b,d,f) high
 $L_f$, for (a,b) Novec, (c,d) air
 $M=0.1$, and (e,f) air
 $M=0.9$. Instantaneous streamwise fluctuations in a wall-parallel plane at
 $y/\delta ^*_{in}=3.1$.

4. Paths to transition
In all the simulations, laminar low-speed streaks, which are a key element in the formation of turbulent spots in FST-induced transitions, are generated inside the boundary layer. In the high- $L_f$ cases, low-speed
 $\Lambda$-shaped structures are also observed. As reported by several authors (Ovchinnikov et al. Reference Ovchinnikov, Choudhari and Piomelli2008; Wu et al. Reference Wu, Moin, Wallace, Skarda, Lozano-Duràn and Hickey2017), these
 $\Lambda$-shaped structures can play an important role in the generation of turbulent spots. Therefore, their participation in the transition process is investigated in this section. First, laminar streaks and
 $\Lambda$-shaped structures are further characterized, and then the competition between these two transition paths is analysed.
4.1. Laminar streaks
As some variability in the streamwise streak sizes was observed in figure 6, the influence of the FST characteristics on their spanwise scale is investigated. The distance  $l_z$ that corresponds to a minimum of the spanwise correlation of the streamwise velocity,
 $R_{uu}$, can be related to the spanwise half-wavelength of the streaks (Fransson & Shahinfar Reference Fransson and Shahinfar2020). Here,
 $R_{uu}$ is evaluated in the transitional region at the height of the maximum
 $u_{rms}$, and time averaged. The evolution of
 $\lambda _z=2 l_z$ for the Novec649 cases, estimated using a cubic interpolation, is reported in figure 11(a). Some important differences between the cases are observed during transition, before all the curves tend to similar values in the TBL, except for the low-
 $L_f$, low-
 $T_u$ case, which does not fully transition in the domain. In particular, the latter case exhibits a significant increase in
 $\lambda _z$ from the inlet, with a spanwise scale eventually larger than the high-
 $L_f$, high-
 $T_u$ case. Figure 11(b) compares the Novec cases with air flows at
 $M=0.1$ and 0.9 for
 $T_u=4\,\%$. The results show that a similar spanwise scale is achieved for a given
 $L_f$, indicating that compressibility and dense-gas effects are of secondary importance.
(a) Evolution of spanwise wavelength of the streamwise streaks in the transitional region for the Novec649 cases, and (b) comparison between Novec and Air cases at  $T_u=4\,\%$. Novec cases: low
 $L_f$ at
 $T_u=2.5\,\%$ (
 ), 4 % (
 ) and 6.6 % (
 ); high
 $L_f$ at
 $T_u=2.5\,\%$ (
 ) and 4 % (
 ). Air
 $M=0.1$ cases: low
 $L_f$ (
 ) and high
 $L_f$ (
 ). Air
 $M=0.9$ cases: low
 $L_f$ (
 ) and high
 $L_f$ (
 ). The colours are lighter outside the transition region between
 $C_{f,min}$ and 60 % of
 $C_{f,max}-C_{f,min}$. In (a), crosses denote the positions
 $\gamma _{peak}=0.1$ and 0.5 for the Novec cases at
 $T_u=4\,\%$.

As the minima of the correlation functions vary greatly across the transitional boundary layer for the different cases, the region considered for the evaluation of  $\lambda _z$ is restricted between the location of
 $C_{f,min}$ and the location at 60 % between
 $C_{f,min}$ and
 $C_{f,max}$. This region includes the locations where the intermittency function
 $\gamma _{peak}$ is
 $10\,\%$ and
 $50\,\%$ for the
 $T_u=4\,\%$ cases (see § 4.3 for the definition of
 $\gamma _{peak}$), as used in Fransson & Shahinfar (Reference Fransson and Shahinfar2020). Along this region, the spanwise distance between streaks remains relatively constant, except for the high-
 $L_f$, high-
 $T_u$ case, which exhibits significant variations due to the appearance of
 $\Lambda$-shaped structures prior to the laminar streaks. The hierarchy between the different cases is more apparent when restricted to this region. At constant
 $L_f$, an increase of
 $T_u$ leads to a decrease of
 $\lambda _{z}$, as in Fransson & Alfredsson (Reference Fransson and Alfredsson2003). Conversely, at constant
 $T_u$, an increase of
 $L_f$ leads to an increase of
 $\lambda _{z}$. Fransson & Shahinfar (Reference Fransson and Shahinfar2020) showed that
 $\lambda _{z}$ varies monotonically not with
 $T_u$ and
 $L_f$, but rather with a combination of these two FST parameters. They proposed an empirical correlation for the spanwise length, which was fitted to their extensive database and was given by
 \begin{equation} \lambda_{z,FS} = L_{f} T_{u} (\mathcal{D}_1\,Re_{FST}^{{-}1/\sqrt{2}} + \mathcal{D}_2)^2, \end{equation}
with  $(\mathcal {D}_1,\mathcal {D}_2)=(186, 0.8)$ to match at
 ${\pm }10\,\%$ the measured values. The estimator
 $\lambda _{z,FS}$ is plotted as a function of
 $Re_{FST} = T_u \times Re_{L_f}$ in figure 12, along with the experimental results of Fransson & Shahinfar (Reference Fransson and Shahinfar2020) at
 $Re_{FST}$ between 135 and 561 (evaluated at an intermittency level
 $\gamma _{peak}$ of
 $10\,\%$). The measurements from Mamidala et al. (Reference Mamidala, Weingärtner and Fransson2022), which contain lower
 $Re_{FST}$ values (down to 57) and were obtained with an experimental set-up similar to that used by Fransson & Shahinfar (Reference Fransson and Shahinfar2020), are also reported. The mean values of
 $\lambda _z$ along the evaluation region in the current simulations are also displayed. As noted earlier, the length scale varies with
 $x$ for the high-
 $L_f$, high-
 $T_u$ cases, so to observe its influence on the results,
 $\lambda _z$ values are plotted with their variations in the inset. Values from other experimental or numerical studies of FST-induced transition are also reported. In the high-
 $Re_{FST}$ range shown in the inset of figure 12, even taking into account the large
 $\lambda _z$ variations, the present high-
 $L_f$ results are in good agreement with the estimator
 $\lambda _{z,FS}$ for incompressible-like air flows but also for the air and organic vapour boundary layers at
 $M=0.9$. The results of Ovchinnikov et al. (Reference Ovchinnikov, Choudhari and Piomelli2008) are also in fair agreement (
 ${\sim }{-35}\,\%$), showing that the estimator works well for large
 $Re_{FST}$, at least for the data considered. The majority of data in the literature are concentrated around lower
 $Re_{FST}$ (
 ${\le }150$) and lower
 $Re_{L_f}$ (
 ${\le }3000$). In this region, containing only one point from the Fransson & Shahinfar data, the comparison is less convincing. The increase of
 $\lambda _z/(L_{f}\times T_{u})$ as
 $Re_{FST}$ decreases is captured correctly by the estimator, but
 $\lambda _z$ values predicted by (4.1) are twice the spanwise distance obtained in our low-
 $L_f$ cases. Our results are, however, in good agreement with the more recent experiment of Mamidala et al. (Reference Mamidala, Weingärtner and Fransson2022). Despite some scatter in the results from the literature, the general trend indicates that the correlation is less accurate for low
 $Re_{FST}$.
Spanwise wavelength of the streamwise streaks as a function of  $Re_{FST}$. Novec cases: low
 $L_f$ at
 $T_u=2.5\,\%$ (red square), at
 $T_u=4\,\%$ (blue circle) and at
 $T_u=6.6\,\%$ (olive triangle); high
 $L_f$ at
 $T_u=2.5\,\%$ (yellow square) and at
 $T_u=4\,\%$ (purple circle) cases. At
 $T_u=4\,\%$, air
 $M=0.1$ for low-
 $L_f$ (blue diamond) and high-
 $L_f$ (magenta diamond) cases, and air
 $M=0.9$ for low-
 $L_f$ (blue down triangle) and high-
 $L_f$ (purple down triangle) cases. Regarding the literature results,
 $\lambda _z$ was either directly available (Jacobs & Durbin Reference Jacobs and Durbin2001; Brandt et al. Reference Brandt, Schlatter and Henningson2004; Mans Reference Mans2007; Ovchinnikov et al. Reference Ovchinnikov, Choudhari and Piomelli2008; Fransson & Shahinfar Reference Fransson and Shahinfar2020; Mamidala, Weingärtner & Fransson Reference Mamidala, Weingärtner and Fransson2022) or evaluated from
 $R_{uu}$ profiles (Mandal et al. Reference Mandal, Venkatakrishnan and Dey2010; Muthu et al. Reference Muthu, Bhushan and Walters2021). The vertical bars in the inset show the variability in the transition region.

Turbulent breakdowns due to low-speed streak instabilities are observed in all the simulations. As the FST levels are relatively high, the streaks rapidly become distorted, making it difficult to distinguish clearly between the sinuous and varicose modes. Also, knowing that the symmetric and antisymmetric modes have been shown to combine in the case of streak transient growth (Hoepffner et al. Reference Hoepffner, Brandt and Henningson2005) or unsteady base streaks (Vaughan & Zaki Reference Vaughan and Zaki2011), no attempt has been made to classify the streak instabilities. An example of each mode is given below for the high- $L_f$, low-
 $T_u$ Novec case to show that despite the competition with another breakdown mechanism and relatively wider streaks, both modes are active with the larger FST length scale. An example of a sinuous breakdown is illustrated in figure 13 using three successive three-dimensional (3-D) views of the low-speed streak before the breakdown. In the first view, two quasi-streamwise vortices are observed on each side of the low-speed streak. In particular, the streak is flanked by a high-speed streak on only one side. This is similar to the one-sided sinuous mode described in Brandt et al. (Reference Brandt, Schlatter and Henningson2004), where a high-speed streak approaches a low-speed region on one side. In figure 13(c), the low-speed streak begins to be fully disrupted, prior to the emergence of a turbulent spot. A varicose-like breakdown is shown in figure 14. In figure 14(a), vortices, identified by the Q-criterion, are characterized by alternating V and
 $\Lambda$ structures joining in the middle of the low-speed streak, as described by Brandt et al. (Reference Brandt, Schlatter and Henningson2004). The
 $\Lambda$ vortices evolve into hairpin vortices in figure 14(b), and the low-speed streak is disrupted symmetrically relative to the centre of the streak.
Observation of a sinuous-like breakdown in the high- $L_f$, low-
 $T_u$ case at three successive times (
 $t^* = (t-t_0) U_\infty / \delta ^*_{in}$, with
 $t_0$ the time of the first snapshot). Isosurfaces of the streamwise velocity fluctuations:
 $u'=0.16 U_\infty$ (white),
 $-0.16 U_\infty$ (green). Isosurfaces of the Q-criterion are also depicted in light brown.

Observation of a varicose-like breakdown in the high- $L_f$, low-
 $T_u$ case at two successive times (
 $t^* = (t-t_0) U_\infty / \delta ^*_{in}$, with
 $t_0$ the time of the first snapshot). Isosurfaces of the streamwise velocity fluctuations:
 $u'=0.16 U_\infty$ (white),
 $-0.16 U_\infty$ (green). Isosurfaces of the Q-criterion are also depicted in light brown.

4.2.  $\Lambda$-shaped structures

An important difference between the low- $L_f$ and high-
 $L_f$ cases is the presence of low-speed
 $\Lambda$-shaped structures in the latter. The formation of these
 $\Lambda$-shaped structures is illustrated in figure 15 through 3-D views in the high-
 $L_f$, low-
 $T_u$ Novec case. First, several quasi-spanwise vortices appear close to the wall due to the interaction of the boundary layer with the FST. Similarly to Ovchinnikov et al. (Reference Ovchinnikov, Choudhari and Piomelli2008), these structures are stretched in the streamwise direction, leading to the formation of
 $\Lambda$ vortices. The strong
 $\Lambda$ vortex in the upper right corner is associated with a low-speed patch of velocity that evolves further downstream in the
 $\Lambda$ structure. The
 $\Lambda$ vortex in the bottom of the images is linked to a one-leg
 $\Lambda$, whose head then connects to a downstream low-speed streak.
The  $\Lambda$ structure formation in the high-
 $L_f$ Novec case with
 $T_u=2.5\,\%$ at four successive times (
 $t^* = (t-t_0) U_\infty / \delta ^*_{in}$, with
 $t_0$ the time of the first snapshot). Isosurfaces of the streamwise velocity fluctuations (
 $u'=0.12 U_\infty$ in white,
 $-0.12 U_\infty$ in green), and isosurface of the Q-criterion in light brown.

The breakdown of a low-speed  $\Lambda$ structure is illustrated in figures 16(a,c,e). The
 $\Lambda$ vortex, flanking the low-speed structures, evolves into a hairpin vortex, the tips of which turn into the characteristic
 $\Omega$ shape. As observed in figures 16(b,d,f) in an
 $xy$-plane located in the middle of the low-speed structure, the breakdown imprints both the spanwise and wall-normal velocity components in the upper half region of the boundary layer, consistent with the observations in Ovchinnikov et al. (Reference Ovchinnikov, Choudhari and Piomelli2008) or more generally with descriptions in the literature of horseshoe vortices evolution and breakdown (see e.g. Bake, Meyer & Rist Reference Bake, Meyer and Rist2002).
(a,c,e) Observations of a  $\Lambda$ structure undergoing turbulent breakdown in the high-
 $L_f$, high-
 $T_u$ case, with
 $z/\delta ^*_{in} \in [-11,1]$, at three successive times (
 $t^* = (t-t_0) U_\infty /\delta ^*_{in}$, with
 $t_0$ the time of the first snapshot). Isosurfaces of the streamwise velocity fluctuations (
 $u'=0.2 U_\infty$ in white,
 $-0.2 U_\infty$ in green), and isosurface of the Q-criterion in light brown. (b,d,f) Wall-normal (upper images) and spanwise (lower images) components of velocity fluctuations at the
 $z$ position denoted by the transparent white plane on the associated images (a,c,e), with levels
 ${\pm }0.07 U_\infty$ from black to white, and
 $x$- and
 $y$-axes aspect ratios 1.4, 1.2 and 1.0 for (b,d,f), respectively.

Interestingly, these structures are often organized obliquely in an  $xz$-plane, as shown in figure 17(a). A similar organization can be observed in figure 16 of Ovchinnikov et al. (Reference Ovchinnikov, Choudhari and Piomelli2008) (not commented by the authors). As the
 $\Lambda$ structures break down into turbulence, an oblique turbulent band may form eventually. In the high-
 $L_f$, high-
 $T_u$ case, on a total of nine relatively well-defined oblique bands, the angle is estimated between
 $25^\circ$ and
 $40^\circ$, with an average value at approximately
 $30^\circ$. This point is discussed further in § 5.
Observation of  $\Lambda$ structures in the high-
 $L_f$, high-
 $T_u$ Novec case: (a) organized in a oblique manner, and (b) leading to a turbulence band. Wall-normal velocity fluctuations (
 $v' = \pm 0.01 U_\infty$ , from black to white). Isolines of the Q-criterion projection around the wall-normal position of the plane plotted in red.

As reported in § 3, a first peak marks the evolution of  $u_{rms,max}$ (see figure 5) in the large-scale FST simulations around the position where
 $\Lambda$ structures emerge, which is related to their development. Similarly, the inflection points, observed on
 $u_{rms,max}$ evolution for the low-
 $L_f$ cases at
 $T_u=2.5\,\%$ and 4 %, are an indication that similar structures may also be present in these simulations. However, no low-speed
 $\Lambda$-shaped structures are observed by inspection of snapshots of the streamwise fluctuations (e.g. figure 6). A more careful examination of 2-D and 3-D visualizations of the low-
 $L_f$, high-
 $T_u$ case also failed to reveal the presence of low-speed
 $\Lambda$-shaped structures, but did reveal the presence of spanwise and
 $\Lambda$ vortices close to the inlet, such as in figure 18. Relative to the high-
 $L_f$ simulations, the vortices are smaller and may not be strong enough to be associated with the low-speed
 $\Lambda$ structures.
Comparison of  $\Lambda$ structures between (a) low-
 $L_f$ and (b) high-
 $L_f$ cases at
 $T_u=4\,\%$ for
 $x/\delta ^*_{in} \in [33,181]$ and
 $z/\delta ^*_{in} \in [-230,230]$. Isosurfaces of the streamwise velocity fluctuations (
 $u'=0.22 U_\infty$ in white,
 $-0.22 U_\infty$ in green), and isosurface of the Q-criterion in light brown.

4.3. Competition between the two breakdown mechanisms
To get more insights into the competition between these two breakdown scenarios, a laminar–turbulent discrimination is applied on the low- $L_f$ and high-
 $L_f$ cases in Novec at
 $T_u=4\,\%$ over the transitional region, to identify turbulent spot inception locations. The discrimination algorithm is adapted from Durovic (Reference Durovic2022) and applied on volume snapshots, allowing the spatial separation into laminar and turbulent regions in the boundary layer. A detailed description is provided in Appendix E. In particular, the peak of the intermittency distribution inside the boundary layer at each streamwise location can be retrieved, as plotted in figure 19(a). The intermittency function corresponds to the probability of the flow being turbulent at a given location. A dimensionless streamwise coordinate
 $\xi =(x-x_{tr})/\Delta x_{tr}$ (
 $x_{tr}$ being the position where
 $\gamma _{peak} = 0.5$, and
 $\Delta x_{tr}$ being the distance between
 $x_{\gamma _{peak} = 0.1}$ and
 $x_{\gamma _{peak} = 0.9}$) is used as in Fransson & Shahinfar (Reference Fransson and Shahinfar2020). The intermittency curves are in relatively good agreement with the correlation of Fransson & Shahinfar (Reference Fransson and Shahinfar2020), despite the presence of the two competing mechanisms in the high-
 $L_f$, high-
 $T_u$ case. The conditioned
 $u_{rms,max}$ evolution is plotted in figure 19(b) for the low-
 $L_f$, high-
 $T_u$ case, and in figure 19(c) for the high-
 $L_f$, high-
 $T_u$ case. The laminar-conditioned curve in the low-
 $L_f$, high-
 $T_u$ case is initially coincident with the unconditioned statistics before deviating around
 $Re_\theta \sim 250$. It does not exhibit the secondary growth observed in the unconditioned curve, related to the eruption of turbulent spots (Nolan & Zaki Reference Nolan and Zaki2013). By contrast, in the high-
 $L_f$, high-
 $T_u$ case, the laminar-conditioned
 $u_{rms}$ quickly deviates from the unconditioned data. This early deviation can be attributed to the turbulent breakdown of low-speed
 $\Lambda$-shaped structures near the inlet, which is consistent with the earlier transition onset reported on the
 $C_f$ evolution in figure 4 and the extension of the transitional region. While characterizing turbulence in transitional boundary layers with inlet
 $T_u$ of 2.5 % and 3 %, Marxen & Zaki (Reference Marxen and Zaki2019) reported for the standard-averaged
 $u_{rms,max}$ a peak larger than both the laminar- and turbulent-averaged values that the authors linked to the contribution of the change in mean velocity to the total stress. Peaks were also present in the different simulations of Nolan & Zaki (Reference Nolan and Zaki2013) with
 $T_u$ of 3 %, except for their case that transitioned the fastest. Interestingly, such peak is, however, absent in figure 19, but is present on the high-
 $L_f$, low-
 $T_u$ case (not shown here for brevity), which corresponds to a lower
 $T_u=2.5\,\%$. This could be a consequence of the higher
 $T_u$ in our low-
 $L_f$, high-
 $T_u$ and high-
 $L_f$, high-
 $T_u$ simulations, and/or the fact that these cases transition relatively quickly.
(a) Peak intermittency evolutions for the low- $L_f$, high-
 $T_u$ (solid blue) and high-
 $L_f$, high-
 $T_u$ (dashed purple) cases, and correlation of Fransson & Shahinfar (Reference Fransson and Shahinfar2020) (
 ). Evolution of
 $u_{rms,max}/U_\infty$ for unconditioned and conditioned statistics for (b) low-
 $L_f$, high-
 $T_u$ and (c) high-
 $L_f$, high-
 $T_u$ cases in Novec.

Based on the laminar–turbulent discrimination, the turbulent spots are tracked in the Novec cases with  $T_u=4\,\%$. First, using a snapshot of the
 $xz$-plane from the binary segmentation, an estimation of the
 $xz$ location is obtained for each spot. Then the evolution of the spot footprint in the different directions is reconstructed, and the 3-D locations of the spots are determined. A total of
 $N_s=327$ and 381 spots are counted for the low-
 $L_f$, high-
 $T_u$ and high-
 $L_f$, high-
 $T_u$ cases, respectively. When divided by the spanwise extent of the computational domain, the comparison of
 $N_s/L_z$ clearly shows a more intense turbulent spot production in the low-
 $L_f$, high
 $T_u$ case, consistent with its shorter transition length. The streamwise and wall-normal histograms of spot inception locations are reported in figure 20. The histograms are normalized so that the sum of the bins is equal to 100 %. The standard shape for spot nucleation rate is recovered for the streamwise distributions of the low-
 $L_f$ simulation (Kreilos et al. Reference Kreilos, Khapko, Schlatter, Duguet, Henningson and Eckhardt2016; Dellacasagrande et al. Reference Dellacasagrande, Lengani, Simoni, Pralits, Durovic, Hanifi and Henningson2021). Increasing
 $L_f$ gives a more spread distribution, in line with the smoother and wider transition length in the high-
 $L_f$ case. Interestingly, the streamwise distribution in the high-
 $L_f$ case has two maxima, one of which is very close to the inlet and contributes to the spreading of the transition region. The second maximum can be related to the turbulent breakdown of laminar streaks, while the first is due to the presence of
 $\Lambda$-shaped turbulent spot precursors. Due to their large number, spots are not directly categorized as being linked to streak instability or
 $\Lambda$ structures. Instead, the first three bars of the spot inceptions streamwise location in the high-
 $L_f$ case, which encompass the first peak and represent spots associated mostly with
 $\Lambda$-shaped turbulent spot precursors, are represented in orange. Conversely, the spots in green are mostly associated with streak instability. Overall, we observe that
 $\Lambda$ precursors account for about a third of the total number of spots. No significant differences are observed between the simulations for their wall-normal distribution (figure 20b). The maxima of the distributions, associated with streak instabilities, are located at approximately
 $y/\delta _{99} \sim 0.4$–0.5, i.e. slightly lower than the value (
 ${\sim }0.55$) in the ZPG case of Nolan & Zaki (Reference Nolan and Zaki2013). This reveals that the outer instability is dominant in the simulations, and that increasing
 $L_f$ does not tend to promote inner instabilities (Vaughan & Zaki Reference Vaughan and Zaki2011). Similarly, the location of the peak of the wall-normal distribution of the orange spots, associated with
 $\Lambda$ structures in the high-
 $L_f$, high-
 $T_u$ case, is located in the outer region (
 ${\sim }0.6$), which is consistent with the observations of Ovchinnikov et al. (Reference Ovchinnikov, Choudhari and Piomelli2008) and the turbulent breakdown mechanism described in figure 16.
Normalized distributions of (a) streamwise and (b) wall-normal positions of the spot inceptions. The solid lines in (a) represent the intermittency function, and the horizontal dashed lines in (b) denote the boundary-layer thickness  $\delta _{99}$. In the high-
 $L_f$, high-
 $T_u$ case, the first three bars of the spot inceptions streamwise location in (a), which are associated with the first peak, are represented in orange in order to observe their vertical position in the boundary layer in (b).

The competition between these two mechanisms is analysed further by looking at the distribution of the laminar streaks amplitude. Using a detection algorithm (Nolan & Zaki Reference Nolan and Zaki2013), the streamwise streaks are identified in the laminar region (see Appendix E), and represented as a collection of points, each characterized by a position and a value of  $u'$. In figure 21, the repartitions of the streak amplitude
 $u'$ along the streamwise direction, smoothed by a 2-D kernel density estimator and normalized by the integral, are shown for the
 $T_u=4\,\%$ Novec cases. A distribution similar to that in Nolan & Zaki (Reference Nolan and Zaki2013) is obtained for the low-
 $L_f$, high-
 $T_u$ case, where only the classical streak instability mechanism is present. The distribution of streak amplitudes spreads out quickly in the pre-transitional region to reach high intensities, which then remain relatively constant. In the two cases, very intense low-speed and high-speed streaks are present, with the 1 % most intense streaks (marked by the 99 % line) reaching amplitudes as high as 40 % of
 $U_\infty$. Even if the values of
 $u_{rms,max}$ (represented by the cyan dashed line) generally underestimate the low-speed streak amplitudes (Nolan & Zaki Reference Nolan and Zaki2013), the median distribution and the
 $u_{rms,max}$ evolution are in fairly good agreement. The amplitudes of the low-speed and high-speed streaks in closest proximity of the turbulent spot locations (see figure 20) are identified by black circles in figure 21. In the low-
 $L_f$ case, the turbulent spots are associated with streak amplitudes
 $u'/U_\infty \sim 0.2$–0.4, consistent with the values found in Nolan & Zaki (Reference Nolan and Zaki2013). The vast majority of the associated streaks lie within the median and the 99th percentile of the streak population, well above the laminar-conditioned
 $u_{rms,max}$ evolution, which peaks at approximately 0.15 (see figure 19). The same observations can be made in the high-
 $L_f$ simulation for the turbulent spots located beyond
 $Re_x=80 \times 10^3$, which are mainly associated with streak instabilities. Closer to the inlet, however, the amplitude distribution shows a different shape in the high-
 $L_f$ case. The median distribution of the low-speed streaks (denoted by 50 %) quickly reaches a first level and then rises to a second level along the transition region. As the low-speed
 $\Lambda$ shapes are captured by the detection algorithm, the initial small peak in the pre-transitional region is reflected in the median amplitude distribution. This gives an indication of how intense the low-speed
 $\Lambda$ structures leading to turbulent breakdowns can be, as the turbulent spots located below
 $Re_x = 80 \times 10^3$ are associated with amplitudes greater than
 $0.4 U_\infty$ for a non-negligible fraction. Moreover, while
 $\approx$10 % of turbulent spots can be linked to the most extreme 1 % of streak population amplitudes in the low-
 $L_f$, high-
 $T_u$ case, this percentage increases to 16 % in the high-
 $L_f$, high-
 $T_u$ case, mostly due to the
 $\Lambda$ structures, which tend to favour such events.
The 2-D density function of the streak amplitude, plotted between the inlet and the station where  $\gamma _{peak}=90\,\%$. Darker colours denote higher density; colour levels between 0 and
 $3 \times 10^{-7}$ (low-
 $L_f$, high-
 $T_u$) and
 $2.6 \times 10^{-7}$ (high-
 $L_f$, high-
 $T_u$). Black circles indicate the positive and negative streak amplitudes in closest vicinity to the turbulent spot inception locations.

5. Discussion about linear and nonlinear transition mechanisms
Two competing scenarios emerge from the previous analysis. The classical one, sometimes referred to as ‘bypass transition in the narrow sense’ (Wu Reference Wu2023), occurs preferentially when the incoming turbulence intensity is moderate (typically  $T_u<2$–4 %), and has been described in a lot of studies (Jacobs & Durbin Reference Jacobs and Durbin2001; Matsubara & Alfredsson Reference Matsubara and Alfredsson2001; Brandt et al. Reference Brandt, Schlatter and Henningson2004; Durbin & Wu Reference Durbin and Wu2007; Mans, de Lange & van Steenhoven Reference Mans, de Lange and van Steenhoven2007; to cite a few). The classical scenario can be summarized as the linear non-modal growth of streaks, which then experience secondary instabilities (sinuous or varicose) and lead to the generation of turbulent spots. The second scenario is characterized by the appearance of
 $\Lambda$-shaped structures, which are further stretched to hairpin vortices before breaking down to turbulence. This alternative route was first described by Ovchinnikov et al. (Reference Ovchinnikov, Choudhari and Piomelli2008), who simulated large-scale incoming turbulence impinging a flat plate with an elliptic leading edge to reproduce T3B experiments. The same phenomenology, called a
 $\Delta$-shaped structure, was obtained in the DNS of Wu et al. (Reference Wu, Moin, Wallace, Skarda, Lozano-Duràn and Hickey2017), who excited a flat plate by the periodic passage of a cube of HIT at high intensity. In his recent review, Wu (Reference Wu2023) reports that the classical scenario is found with the same set-up by reducing the intensity of the incoming turbulence (
 $T_u\sim 1.5\,\%$), which is supported by the present observations. He thus proposed a sub-categorization of bypass transition as a function of the incoming turbulence intensity. In the present study, we show that the integral length scale also contributes in the definition of an upper bound for the classical scenario (or, at least, in determining what we refer to as high turbulence intensity). In this section, we discuss the alternative routes of bypass transition in view of earlier works. Even if the conditions of the previous experimental, numerical or theoretical studies are different, a number of common features can be identified through a qualitative comparison.
Spot inceptions due to  $\Lambda$-shaped/
 $\Delta$-shaped/hairpin vortices can occur at earlier locations than the streak growth of the classical scenario. We are then faced with a competition between bypass transition in the narrow sense, and nonlinear response mechanisms that ‘bypass’ this route. Depending on the FST parameters (
 $T_u$,
 $L_f$) and the set-up (shape of the leading edge, presence of pressure gradients), either the transition is already achieved due to the nonlinear response, or it is partially realized, and the streak growth and breakdown then take over. At the lower bound of the classical scenario, in the overlapping range
 $0.5\,\%< T_u<1.5\,\%$, a similar competition has been described. This competition, between natural (orderly transition due to TS waves) and bypass transition in the narrow sense, referred to as ‘mixed mode transition’ (Durbin & Wu Reference Durbin and Wu2007; Bose & Durbin Reference Bose and Durbin2016b), can lead to complex interactions. The present high-
 $L_f$, high-
 $T_u$ case represents a competing scenario for the upper bound of the classical scenario. Even for the higher
 $T_u$ and
 $L_f$ conditions, only approximately one-third of transitional spots are due to the
 $\Lambda$-shaped events, the rest being due to streaks.
As discussed in § 4.2, a striking feature observed when  $\Lambda$ structures are generated close to the inlet is their oblique arrangement, which is reminiscent of the laminar–turbulent bands described in the context of subcritical turbulence. This intriguing patterning has excited the curiosity of numerous researchers (see the reviews of Manneville Reference Manneville2017; Tuckerman, Chantry & Barkley Reference Tuckerman, Chantry and Barkley2020). It appears clearly in flows that are linearly stable, meaning that another mechanism, namely a nonlinear response due to the intrinsic nonlinearity of the Navier–Stokes operator, is responsible for the onset of turbulence. The first configuration where band turbulence has been observed is the annular Couette flow. Such banded patterns have also been obtained in wall-bounded turbulence on plane surfaces, namely plane Couette and Poiseuille flows (see Manneville Reference Manneville2017; Tuckerman et al. Reference Tuckerman, Chantry and Barkley2020; Wu Reference Wu2023). In linearly stable flows, the main analysis approach consists in decreasing the Reynolds number from a fully turbulent state. For instance, in channel flow, the fully turbulent flow gives rise to a patterning regime with turbulent bands exhibiting an almost constant angle of 25
 $^\circ$ with respect to the mean flow direction (Kashyap, Duguet & Dauchot Reference Kashyap, Duguet and Dauchot2020). In the present nonlinear transition, an angle of approximately 30
 $^\circ$ has been obtained, even if the bands are less marked since the flow is inhomogeneous in the streamwise direction. In order to shed light on the reasons for such a pattern, Xiao & Song (Reference Xiao and Song2020a,Reference Xiao and Songb) have studied the dynamics of the turbulent bands in large channel domains. They found that the downstream end of the band displays fast streak growth, whereas streaks at the upstream end tend to decay. This asymmetry is responsible for the transverse growth of the band (Duguet & Schlatter Reference Duguet and Schlatter2013).
The task is more complex for boundary layers, which can develop unstable TS waves above a low supercritical  $Re$ and thus present a less marked subcritical character. Many routes, corresponding to the multiplicity of solutions in phase state, are then possible, depending on the characteristics of the inflow. The main way of studying subcritical response of boundary layers consists in finding the disturbance that experiences the largest energy growth at a certain time level, called nonlinear optimal disturbance because a nonlinear optimization problem is solved. For instance, Cherubini et al. (Reference Cherubini, De Palma, Robinet and Bottaro2011b) studied the boundary-layer transition induced by such nonlinear optimal perturbations, which consists of vortices inclined in the streamwise direction surrounding a region of intense streamwise disturbance velocity. This ‘minimal seed’ triggers nonlinear effects that lead to the formation of
 $\Lambda$ vortices rapidly breaking down into turbulent spots. The methodology has been applied to the FST-induced transition in Cherubini, Robinet & De Palma (Reference Cherubini, Robinet and De Palma2014), yielding the same sub-categorization as found in the present simulations. For weak inlet perturbations (low
 $T_u$ and low
 $L_f$), the optimal disturbances are laminar streaks corresponding to linear transient growth (the classical scenario). For high
 $T_u$ and high
 $L_f$, the response is dominated by nonlinear structures that are
 $\Lambda$ vortices turning to hairpin vortices in their more mature phase. The search for edge states, which are sitting on the laminar–turbulent boundary in a phase-space perspective, is another step to find the most probable germs able to drive the transition (Cherubini et al. Reference Cherubini, De Palma, Robinet and Bottaro2011a; Biau Reference Biau2012; Duguet et al. Reference Duguet, Schlatter, Henningson and Eckhardt2012). Duguet et al. (Reference Duguet, Schlatter, Henningson and Eckhardt2012) obtained the edge state structure as combination of localized streaks and hairpin-like structures that can be self-sustained by a Waleffe-type mechanism (Waleffe Reference Waleffe1997). Kerswell (Reference Kerswell2018) summarizes these approaches as ‘nonlinear non-modal stability’, as a counterpoint to the linear non-modal theory of transient growth (Schmid Reference Schmid2007).
In all scenarios in which nonlinearity plays the essential role,  $\Lambda$- or hairpin-like vortices are present in the boundary layer. More generally, the response of a laminar shear layer to large-amplitude localized disturbances is through the formation of hairpin vortices (see Suponitsky, Cohen & Bar-Yoseph (Reference Suponitsky, Cohen and Bar-Yoseph2005), and references therein). The latter show that the ubiquitous character of streaks and hairpin vortices in boundary layers is due to the wall shear. Using various shapes of initial disturbances, their results demonstrate that ‘a small-amplitude initial disturbance (linear case) eventually evolves into a streaky structure independent of its initial geometry and orientation, whereas, a large-amplitude disturbance (strongly nonlinear case) evolves into a hairpin vortex (or a packet of hairpin vortices) independent of its geometry over a wide range of the initial disturbance orientations’ (Suponitsky et al. Reference Suponitsky, Cohen and Bar-Yoseph2005, p. 96).
Alternative bypass scenarios also fall into the category of nonlinear response to intense localized disturbances. For instance, depending on the leading edge bluntness of a flat plate, Nagarajan et al. (Reference Nagarajan, Lele and Ferziger2007) described wavepacket events that break down into turbulent spots before the development of streak instabilities. In their case, the initial seed is a streamwise vortex due to the stretching/tilting effect at the leading edge (Goldstein Reference Goldstein2014). Ovchinnikov et al. (Reference Ovchinnikov, Choudhari and Piomelli2008) considered that this route is different from the one with  $\Lambda$-shaped structure (as found in the present study) for several reasons: (i) the seed for
 $\Lambda$ vortices is a spanwise vorticity perturbations rather than a streamwise one; (ii) the wavepackets are characterized by wall-normal rather than spanwise velocity fluctuations in Nagarajan et al. (Reference Nagarajan, Lele and Ferziger2007); (iii) the wavepacket growth is not confined to the inner part of the boundary layer. In fact, the different nonlinear evolutions are due to different germs: a spanwise vorticity
 $\omega _z=\partial v/\partial x-\partial u/\partial y$ amplifies wall-normal disturbances, significant away from the wall, whereas a streamwise vorticity
 $\omega _x\sim \partial w/\partial y$ highlights spanwise fluctuations at the wall vicinity. The nonlinear response in Nagarajan et al. (Reference Nagarajan, Lele and Ferziger2007) is due not to intense large-scale events in the FST but to the intensification of FST in the leading edge region, amplifying spanwise fluctuations. A motive for the present research being the transition in turbomachinery, and in particular ORC turbines, it is interesting to mention some earlier studies in that context. Zhao & Sandberg (Reference Zhao and Sandberg2020) also reported various routes of bypass transition for a high-pressure turbine blade. For low
 $T_u$ and low
 $L_f$, the streak instability mechanism prevails, whereas for high
 $T_u$ and high
 $L_f$, the spot inceptions occur upstream due to intense streamwise vortices generated at the thick rounded leading edge. A wavepacket scenario is found, close to the observations of Nagarajan et al. (Reference Nagarajan, Lele and Ferziger2007), where near-wall spanwise disturbances precede the breakdown. As in Nagarajan et al. (Reference Nagarajan, Lele and Ferziger2007), the distortion at the leading edge is essential in creating the transition germ. The wavepacket then evolves in a reverse
 $\Lambda$-shaped structure. In the context of transition on compressor blades, Mao et al. (Reference Mao, Zaki, Sherwin and Blackburn2017) found that the nonlinear development of high-amplitude disturbances on the pressure side generates
 $\Lambda$ structures, which are further stretched to hairpin vortices before breaking down to turbulence.
A link may also be drawn with the presence of  $\Lambda$-shaped structures in wake-induced transition. For instance, Kyriakides et al. (Reference Kyriakides, Kastrinakis, Nychas and Goulas1999) provided experiments of the interaction between a cylinder wake and a flat-plate boundary layer, and they observed the formation of secondary vortical structures in the near-wall region. The authors reported that these structures took a characteristic
 $\Lambda$ shape. Pan et al. (Reference Pan, Wang, Zhang and Feng2008), in a similar configuration, reported similar structures, which were due to the deformation of initially 2-D spanwise vortices generated inside the boundary layer in response to the von Kármán vortex street and which lead to the formation of a turbulent spot. The same conclusions were drawn in the experimental study of Mandal & Dey (Reference Mandal and Dey2011) (see their figure 4). The low-speed
 $\Lambda$-shaped structures observed in the present study also originate from the interaction with large scales present in the free stream, as in the case of cylinder wakes. This further stresses the importance of FST scales in the generation of such structures. In the case of a high-pressure turbine stage, due to the interaction of incoming periodic wakes with the suction side, this breakdown mechanism already competes with streak breakdown for the generation of turbulent spots (Wang et al. Reference Wang, Zhao, Leggett and Sandberg2023).
6. Conclusions
The influence of large-scale disturbances on free-stream-induced transitions has been investigated by means of LES, for perfect and non-ideal gas boundary layers. The integral length scale  $L_f$ is increased by one order of magnitude between the low- and high-
 $L_f$ cases, which represent a large variation compared with what has been done in the literature. Dense-gas simulations are carried out using the organic vapour Novec649 in conditions representative of ORC applications (
 $T_\infty =100$
 $^\circ$C,
 $p_\infty =4$ bar), at Mach number 0.9 and for various FST intensities. A direct comparison with air flows in low- and high-subsonic conditions (
 $M=0.1$ and 0.9, respectively) is performed to sort out dense-gas and compressibility effects on the FST-induced transition. The results show that increasing the inlet turbulent intensity always promotes transition, and as in Fransson & Shahinfar (Reference Fransson and Shahinfar2020), a double effect is observed for the integral length scale. For
 $T_u=2.5\,\%$, increasing
 $L_f$ accelerates the transition, whereas it delays transition for FST intensity 4 %. The FST scales also influence the extent of the transition region and the size of the laminar streaks. By comparing boundary layers in air at
 $M=0.1$ and 0.9, we observe that compressibility slightly delays the transition onset due to the generation of near-wall thermal streaks by friction heating. This compressibility effect is absent in Novec649 flows due to the high thermal capacity of the organic vapour, which severely attenuated the thermal fluctuations. The transition in the dense-gas boundary layers at
 $M=0.9$ is nonetheless further delayed with respect to air boundary layers. This somewhat paradoxical effect is the result of the excitation of internal degrees of freedom of the complex vapour molecules, which induces a slight attenuation of the velocity fluctuations. However, compared with the influence of the scales of the incoming turbulence, the non-ideal gas and compressibility effects appear to be largely of secondary importance, so that the main outcomes are robust for perfect and non-ideal gas boundary layers.
In all cases, laminar streaks are produced within the boundary layer, as expected for FST-induced transitions. For the high  $L_f$ cases, low-speed
 $\Lambda$-shaped structures are generated in the boundary layer prior to the formation of laminar streaks, in both air and Novec flows. These structures, previously observed by other researchers (Ovchinnikov et al. Reference Ovchinnikov, Choudhari and Piomelli2008; Wu Reference Wu2023), are found to be promoted not only by high
 $T_u$ but also by high
 $L_f$ of external turbulence. Their trace appears as a first secondary peak in the streamwise evolution of
 $u_{rms,max}$ near the inlet. They can lead to early turbulent breakdowns, thus competing directly with streak instability mechanisms in the generation of turbulent spots. This is particularly noticeable in the
 $T_u=4\,\%$ cases, where the increase of the integral scale results in a double-peaked distribution of the turbulent spots in the streamwise direction. The first peak near the inlet is related to the eruption of
 $\Lambda$ structures, while the second represents the later breakdowns due to laminar streak destabilization. However, even in the high-
 $L_f$, high-
 $T_u$ case, the majority of turbulent breakdowns still occur via laminar streak instabilities (sinuous or varicose). As noted by Fransson & Shahinfar (Reference Fransson and Shahinfar2020), the spanwise spacing of the laminar streaks is also affected by both the FST intensity and integral length scale. The spanwise distance between streaks varies little between air and Novec flows, meaning that the streak growth is little affected by the compressibility or dense-gas effects. A laminar streak detection reveals that the amplitude distribution of the laminar streaks is also affected by the integral length scale, due to the emergence of the intense
 $\Lambda$ structures near the inlet for the high-
 $L_f$, high-
 $T_u$ case.
Supplementary movies
Supplementary movies are available at https://doi.org/10.1017/jfm.2024.567.
Acknowledgements
This work was granted access to the HPC resources of IDRIS and TGCC under the allocation A0112A01736 made by GENCI (Grand Equipement National de Calcul Intensif).
Funding
This research has been funded by the Agence Nationale de la Recherche through the ANR-20-CE92-0019 project Regal-ORC.
Declaration of interests
The authors report no conflict of interest.
Data availability statement
Data that support the findings of this study are made available for download at https://zenodo.org/records/12915280. Supplementary data are available on demand.
Appendix A. Generation of synthetic turbulence based on RFMs
For homogeneous turbulence, the 3-D Fourier transform in space of the fluctuating velocity field can be defined as
 \begin{equation} \boldsymbol{u}'(\boldsymbol{x})=\int \hat{\boldsymbol{u}}(\boldsymbol{k})\exp({{\rm i}\boldsymbol{k}\boldsymbol{\cdot}\boldsymbol{x}})\,{\rm d}\boldsymbol{k}, \end{equation}
where  $\boldsymbol {k}$ denotes the wavenumber vector. The incompressibility condition yields
 $\hat {\boldsymbol {u}}(\boldsymbol {k})\boldsymbol {\cdot }\boldsymbol {k}=0$. The wavenumber
 $\boldsymbol {k}$ is plotted in the
 $k$-space in figure 22. Introducing the local frame
 $(\tilde {\boldsymbol {k}}_1, \tilde {\boldsymbol {k}}_2, \tilde {\boldsymbol {k}}_3)$ corresponding to the spherical coordinates
 $(k, \theta, \phi )$, since
 $\tilde {\boldsymbol {k}}_3$ is aligned with
 $\boldsymbol {k}$, the normality condition deduced from the continuity constraint indicates that the vector
 $\hat {\boldsymbol {u}}$ is necessarily in the
 $(\tilde {\boldsymbol {k}}_1, \tilde {\boldsymbol {k}}_2)$ plane. In this frame, we note
 $\hat {\boldsymbol {u}}=\hat {u}\boldsymbol {a}=\hat {u}(\cos \alpha,\sin \alpha )$, with the angle
 $\alpha$ defined in figure 22(b). The turbulent inlet field is generated as the sum of
 $N$ independent RFMs whose amplitudes
 $\hat {u}_n$ are determined from a turbulent kinetic energy spectrum. The fluctuating velocity field is then expressed as a Fourier series:
 \begin{equation} \boldsymbol{u}'(\boldsymbol{x},t)=\sum_{n=1}^N 2\hat{u}_n\cos(\boldsymbol{k}_n(\boldsymbol{x}-\bar{\boldsymbol{u}}t)+\omega_n t+\psi_n)\,\boldsymbol{a}_n, \end{equation}
where  $\psi _n$,
 $\boldsymbol {k}_n$,
 $\boldsymbol {a}_n$ are random variables with given probability density functions. Isotropy is obtained by choosing the random variables in the following way. For each mode, the wavenumber vector
 $\boldsymbol {k}$ is picked on a sphere of radius
 $k$. In the Cartesian coordinate system, the three unit vectors of the local frame are
 \begin{equation} \tilde{\boldsymbol{k}}_1=\begin{pmatrix} \cos\theta\cos\phi\\ \cos\theta\sin\phi\\ -\sin\theta\end{pmatrix},\quad \tilde{\boldsymbol{k}}_2=\begin{pmatrix} -\sin\phi\\ \cos\phi\\ 0 \end{pmatrix},\quad \tilde{\boldsymbol{k}}_3=\begin{pmatrix} \sin\theta\cos\phi\\ \sin\theta\sin\phi\\ \cos\theta \end{pmatrix}. \end{equation}
The wavenumber vector is simply  $\boldsymbol {k}=k\tilde {\boldsymbol {k}}_3$, and the isotropy requires that
 \begin{equation} \frac{{\rm d} S}{4{\rm \pi} k^2}=\frac{k\sin\theta \,{\rm d}\phi\,k \,{\rm d}\theta}{4{\rm \pi} k^2} =p(\theta)\,{\rm d}\theta\,p(\phi)\,{\rm d}\phi. \end{equation}
(a) Local frame  $(\tilde {\boldsymbol {k}}_1, \tilde {\boldsymbol {k}}_2, \tilde {\boldsymbol {k}}_3)$ in the
 $k$-space. (b) Representation of the Fourier component
 $\hat {\boldsymbol {u}}_a$.

The probability density functions are taken to be  $p(\theta )=\sin \theta /2$ and
 $p(\phi )=1/(2{\rm \pi} )$. The unit vector
 $\boldsymbol {a}_n$ is
 \begin{equation} \boldsymbol{a}_n=\cos\alpha\,\tilde{\boldsymbol{k}}_1+\sin\alpha\,\tilde{\boldsymbol{k}}_2= \begin{pmatrix} \cos\alpha\cos\theta\cos\phi-\sin\alpha\sin\phi\\ \cos\alpha\cos\theta\sin\phi+\sin\alpha\cos\phi\\ -\cos\alpha\sin\theta \end{pmatrix}, \end{equation}
with  $\alpha$ being distributed uniformly between 0 and
 $2{\rm \pi}$, thus
 $p(\alpha )=1/(2{\rm \pi} )$. The turbulent kinetic energy is given by
 \begin{equation} \bar{k}=\frac{\overline{u'_i u'_j}}{2}=\frac{1}{2}\sum_{n=1}^N \hat{u}_n^2. \end{equation}
We use here a von Kármán spectrum with Saffman viscous dissipation function and a bottleneck correction proposed by Kang et al. (Reference Kang, Chester and Meneveau2003) (see (2.2)). Thus the amplitude of the  $n$th Fourier mode is provided by
 $\hat {u}_n=\sqrt {2E(k_n)\,\Delta k_n}$, where
 $\Delta k_n$ is the discretization step in the Fourier space. A logarithmic distribution of the
 $N$ modes is used to correctly represent the turbulent energy spectrum for low wavenumbers as well as for larger ones. Assuming that
 $k_{min}$ and
 $k_{max}$ are given, with
 $n=1,\ldots,N$, we let
 \begin{equation} k_n=\exp[\ln k_1+(n-1)\,\Delta k]\quad \text{and}\quad \Delta k=(\ln k_{max}-\ln k_{min})/(N-1). \end{equation}
The temporal evolution in (A2) is set by means of a convection velocity  $\overline {\boldsymbol {u}}=U_\infty$ (Taylor's hypothesis) and a turbulence evolution pulsation
 $\omega _n$, deduced from Kolmogorov's theory,
 $\omega _n=\epsilon ^{1/3} k_n^{2/3}$ (
 $\epsilon$ being the dissipation rate).
Appendix B. Validation of the synthetic turbulence for the T3A benchmark case
The inlet synthetic turbulence strategy is validated against the T3A benchmark experiment (Roach & Brierley Reference Roach and Brierley1992). The flow is simulated in air at  $M=0.5$, and the free-stream thermodynamic quantities are
 $p_\infty =101\,300$ Pa and
 $T_\infty =298.15$ K. As the integral length scale
 $L_f$ is not characterized in the experiment, the FST characteristics are determined thanks to preliminary simulations of spatially decaying HIT, in order to match the evolution of the FST intensity in the T3A experiment, as recommended by Pinto & Lodato (Reference Pinto and Lodato2019), who also used synthetic turbulence for this benchmark case. The selected values are
 $Re_{L_{f,in}}=1728$ and
 $T_{u,in}=3.9\,\%$, consistent those found by Pinto & Lodato (Reference Pinto and Lodato2019) (
 $Re_{L_f}=1950$,
 $T_u=3.5\,\%$). The turbulence intensity evolution, plotted in figure 23(a), is in fair agreement with the experimental
 $T_u$ decay. The Reynolds number at the inlet is
 $Re_{x,in}=10^4$, and the simulation is initialized with the similarity solution of a laminar boundary layer. The computational domain used is
 $N_x\times N_y\times N_z= 1920\times 204\times 62$ and has resolution
 $\Delta x^+\times \Delta y_w^+\times \Delta z^+=13\times 1.1\times 13$, which is equivalent to the resolutions of the low-
 $L_f$ cases considered in this paper. One major flaw of the method, as discussed in Pinto & Lodato (Reference Pinto and Lodato2019), is the value of the injection height
 $h$ in (2.3), which is a tunable parameter that may influence the onset of transition. Three different injection heights, corresponding to
 $h/\delta _{99,in} = 1.35$, 1.69 and 2.22, have been tested, all chosen to inject synthetic turbulence above
 $\delta _{99,in}$ (see figure 23b). The
 $C_f$ distributions, in figure 23(c), show that when the injection height is increased, the onset of transition is delayed. However, the slope of the
 $C_f$ rise and the transition region length are very close. The injection height
 $h=1.69\delta _{99,in}$ is the one that better reproduces the location of the transition region of the T3A experiment. The streamwise fluctuating velocity profiles along the transition region are reported in figure 24. The profiles are scaled by a factor 0.1 and displayed with an offset corresponding to their streamwise position
 $Re_x$. To be able to compare the different cases, the streamwise coordinate
 $Re_x$ is scaled by the beginning (
 $Re_x(C_{f,min})$) and the end (
 $Re_x(C_{f,max})$) of the transitional region. The profiles are in good agreement with the experimental ones for the intermediate height. With the scaling of the streamwise coordinates by the transition region length, the streamwise fluctuating velocity profiles for the two other cases are also in good agreement. Therefore, the parameter
 $h$ can influence the location of the transition region, but the present strategy can be used to study the transitional region and in particular the effects of the FST characteristics over it (as long as the injection height is kept constant between cases and the synthetic turbulence is injected above the boundary layer).
(a) Turbulence intensity  $T_u$ evolution, (b) damping function
 $\sigma _{damp}$, and (c) friction coefficient
 $C_f$ evolution, for the three cases:
 $h/\delta _{99,in} = 1.35$ (dashed red line), 1.69 (solid green line) and 2.22 (dotted blue line). Comparison with the T3A experiment is shown by
 $\star$.

Streamwise fluctuating velocity  $0.1 \times {u_{rms}}/{u_{\tau }} + {(Re_x - Re_x(C_{f,min}))}/{(Re_x(C_{f,max}) - Re_x(C_{f,min}))}$. Legend as in figure 23.

Appendix C. Influence of the grid resolution
To assess the LES resolution and its influence on the FST-induced transition, the high- $L_f$, high-
 $T_u$ air
 $M=0.9$ configuration is simulated on a finer computational mesh, obtained by taking the LES domain with the same
 $L_y$ and
 $L_z$ dimensions, and reducing by two
 $\Delta x$ and
 $\Delta z$. The grid step at the wall,
 $\Delta y_w$, is kept equal, but the stretching in the
 $y$-direction is reduced to keep
 $\Delta y \le \Delta x$, resulting in a total of 840 points (see table 3) and a DNS-like resolution, with
 $\Delta x^+\times \Delta y_w^+\times \Delta z^+ = 10.5\times 0.8\times 4.4$ in the TBL. The RFM discretization and number of modes are kept the same as in the LES. Looking at the friction coefficient
 $C_f$ evolution (figure 25a), the transition is slightly shifted upstream in the DNS compared with the LES, but remains overall very close to the LES. The
 $u_{rms}$ profiles in the transitional region (figure 25b) are almost superimposed, with only slight deviations observed at the last two stations.
Computational grid and FST properties of the high- $L_f$, high-
 $T_u$ air
 $M=0.9$ case with LES and DNS resolutions.

(a) Friction coefficient evolution and (b) streamwise fluctuating velocity  $50 \times {u_{rms}}/{u_{\tau }} + Re_\theta$, for the high-
 $L_f$, high-
 $T_u$ air
 $M=0.9$ configuration with LES resolution with
 $N=100$ modes (dashed purple line), and DNS resolution with
 $N=100$ (dotted black line) and
 $N=116$ (solid grey line) RFMs.

Using the same grid, DNS are run with  $k_{max}$ increased to match the DNS resolution limit in the free-stream region, resulting in
 $N=116$ RFMs, in order to investigate the influence of the selected upper bound for RFMs. Both
 $C_f$ evolution and
 $u_{rms}$ profiles of the two DNS collapse perfectly, providing a first validation of the choice of the RFM wavenumber bounds. This is also an indication that the excitation at high frequencies does not influence the transition. The RFM discretization strategy is further assessed in Appendix D.
Appendix D. Influence of the discretization of RFM wavenumbers
To further assess the influence of the RFM discretization, the low- $L_f$, high-
 $T_u$ Novec case is performed on a computational domain with a spanwise extent reduced by a factor 5, with
 $N_z=80$ rather than
 $400$, which corresponds to
 $L_z\sim 10 L_f$ (see table 4). The grid resolution is kept identical. Using the same number of RFMs (
 $N=100$),
 $k_{min}$, and therefore the discretization of RFM wavenumbers, are modified to match the spanwise extent of the narrow domain, leading to the inlet energy spectrum target in figure 26. The increase of
 $k_{min}$ between the large and narrow domains results in a better discretization of the spectra in the narrow case. This leads to an estimated
 $Re_{L_f,c}$ that is slightly different and closer to the target, at
 $1900$ instead of
 $1950$.
Computational grid and FST properties of the low- $L_f$, high-
 $T_u$ Novec case with the large and narrow computational domains.

(a) Inlet energy spectra target, with a marker every 1 discrete mode out of 10. (b) Friction coefficient evolution for the low- $L_f$, high-
 $T_u$ Novec configuration with large (solid blue line) and narrow (dashed purple line) spanwise extent.

The  $C_f$ distributions shown in figure 26(b) are in almost perfect agreement, with slight differences at the end of the transition. Streamwise fluctuating velocity profiles in the transition region and in the TBL shortly after the end of transition are shown in figure 27. The profiles match perfectly, except for a slight discrepancy at
 $Re_\theta =300$. This comparison demonstrates that as long as the RFMs are relatively well discretized around the maximum peak of the spectrum, the discretization of the RFMs has negligible effect on the transition.
Streamwise fluctuating velocity  $50 \times {u_{rms}}/{u_{\tau }} + Re_\theta$. Legend as in figure 26.

Appendix E. Laminar–turbulent discrimination and laminar streak detection
The laminar–turbulent discrimination algorithm is adapted from Durovic (Reference Durovic2022). We first interpolate the field on a coarser mesh, reducing by a factor two the number of points in the spanwise and wall-normal directions. The number of points in the streamwise direction is divided by two only for the low- $L_f$ simulations, so that similar resolution is obtained on the interpolated grid for all cases. The interpolation acts as a low-pass filter, in addition to reducing the cost of the procedure. For each wall-parallel plane of a volume snapshot, the 2-D scalar field of the spanwise velocity fluctuations
 $w'$, denoted
 $s_{w'}(\boldsymbol {x})$, is first used to define
 $s_{extr,w'}$ containing the local extrema of
 $w'$. The same extraction is realized for the wall-normal velocity fluctuations
 $v'$ to obtain
 $s_{extr,v'}$. A 3-D scalar field
 $s_{extr,3\text {-}D}$ is reconstructed from the 2-D extractions
 $s_{extr}=s_{extr,v'}+s_{extr,w'}$, and a smoothing
 $S$ is applied on it. As the distance from the extrema increases,
 $S(\boldsymbol {x})$ decreases exponentially. Therefore, the smoothing is applied over a cubic domain
 $D^3$ restricted to the locations where
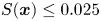 $S(\boldsymbol {x})\le 0.025$, limiting the computational cost. An extrema density scalar field
 $f_{extr,3\text {-}D}$ weighted by the extrema values is computed as
 \begin{equation} f_{extr,3\text{-}D} (\boldsymbol{x}) = \sum_{\boldsymbol{x}_s \in D^3} S \left(\frac{\boldsymbol{x}_s - \boldsymbol{x}}{r_s}\right) \times s_{extr,3\text{-}D}(\boldsymbol{x}_s), \end{equation}
where the parameter  $r_s$ adjusts the radius of the spherical smoothing. This parameter, which depends on the numerical set-up and the particular configuration, is determined by testing its influence on the detection of the turbulent regions and spots. Once fixed,
 $r_s$ is taken equal across the cases.This parameter is determined by trial and error, and is taken equal to
 $0.8\Delta x_{interp}$, where
 $\Delta x_{interp}$ is the streamwise spacing in the interpolated grid. The weighting has been shown to improve the distinction between the TBL and the FST, at least for the considered turbulence intensities. The density scalar field
 $f_{extr,3\text {-}D}$ is then interpolated back on the computational grid, and a binary segmentation is realized using the method of Otsu (Reference Otsu1979). A threshold is obtained at each wall-normal location independently, and levels are smoothed in the wall-normal direction to ensure continuity in the discrimination. The discrimination is applied for each case using 4220 sub-volumes saved during
 ${\sim }68\,000$ time iterations.
The output of the laminar–turbulent discrimination algorithm inside the boundary layer for one snapshot is shown in semi-transparent green in figure 28 for the high- $L_f$, high-
 $T_u$ Novec case. We observe that the discrimination can identify the turbulent state, populated with turbulent streaks, and several turbulent spots are captured (at
 $x/\delta ^*_{in}\sim 450$ or
 $600$). Discriminated statistics can be defined: the laminar-conditioned (resp. turbulent-conditioned) statistics correspond to the statistics obtained while averaging in time and in the spanwise direction the laminar (resp. turbulent) regions detected by the algorithm. An example for the low-
 $L_f$, high-
 $T_u$ case is given in figures 29 and 30. The time-averaged profiles in figure 29(a) evolve from a laminar state towards a fully turbulent profile. The laminar-conditioned profiles (figure 29b) exhibit the shape characteristic of laminar state, but the profiles are distorted by the presence of laminar streaks. On the contrary, the turbulent profiles reach rapidly a self-similar behaviour corresponding to the fully turbulent state, represented here by the time-averaged solution at the last station. The evolution of the unconditioned Reynolds shear stresses in figure 30(a) highlights the rapid amplification during transition. The laminar- and turbulent-conditioned data (figure 30a) show that the laminar part has limited growth, with maximal levels below the unconditioned data at
 $\gamma _{peak}=0.1$. The turbulent-conditioned profiles exhibit large fluctuations with respect to the time-averaged data, that gradually decrease along the transitional region, while remaining above the unconditioned profile
 $\gamma _{peak}=0.9$. Finally, the laminar-conditioned friction coefficient (figure 30b) increases due to the laminar streaks, while the turbulent contribution initially exhibits lower friction levels than a fully turbulent state due to the calming effect of the turbulent spot periphery (Schubauer & Klebanoff Reference Schubauer and Klebanoff1955).
Wall-normal snapshot of the streamwise fluctuations at  $y/\delta _{99,in}=1.11$ in the high-
 $L_f$, high-
 $T_u$ Novec case. The turbulent region is displayed in semi-transparent green, and the low-speed (high-speed) streaks detected are also represented in blue (red).

Discriminated statistics for the low- $L_f$, high-
 $T_u$ Novec case: (a) time-averaged, (b) laminar-conditioned and (c) turbulent-conditioned mean streamwise velocity profiles between
 $\gamma _{peak}=0.1$ and 0.9 every 0.1 for the low-
 $L_f$, high-
 $T_u$ case. The time-averaged profile at
 $\gamma _{peak}=0.9$ is kept in (b) and (c).

Discriminated statistics for the low- $L_f$, high-
 $T_u$ Novec case. (a) Time-averaged Reynolds shear stresses and conditioned Reynolds shear stresses for increasing
 $Re_\theta$ values, where the unconditioned time-averaged profiles at
 $\gamma _{peak}=0.1$ and 0.9 are displayed for comparison. (b) Skin friction distributions for unconditioned and conditioned statistics, with laminar (dotted grey line) and turbulent (solid grey line) correlations.

The streaks are identified in the laminar region by the local extrema of the streamwise velocity  $u$ in each
 $yz$-plane. First, the detection is limited to the boundary layer by rejecting extrema found above
 $\delta$ such that
 $u_\delta =0.95 U_\infty$. When two extrema in a
 $yz$-plane are separated by a distance smaller than a threshold value
 $\Delta x$, only the more intense one is kept. Then extrema are connected to form streaks by scanning the streamwise direction with the following criteria: extrema separated by a distance lower than
 $2\Delta x$ belong to the same streak, and streaks shorter than
 $8\Delta x$ are rejected. A population of streaks is then obtained for each of the volumes, each streak being a collection of points characterized by a position and a streamwise fluctuation velocity. An example of the streak detection output is given in figure 28. It is worth noting that the streak identification does not distinguish between streamwise streaks and
 $\Lambda$-shaped vortices. An example of a
 $\Lambda$ structure detected by the algorithm is circled in orange in the figure.



