

Countries around the world are struggling to respond to the increasing cost of their public retirement income programs due to the pressures of population aging. One of the responses pursued in many countries has been an increase in the age of eligibility for retirement benefits. For example, the United States has been slowly increasing the full retirement age from 65 towards a target of 67 for cohorts born in 1960 and later. As well, Germany has legislated a move in its retirement age from 65 to 67 between 2012 and 2029. Similar proposals were made in France in 2010 and sparked vigorous demonstrations. Lastly, in Canada, the March 2012 federal budget announced plans to make a transition in the age of eligibility – from ages 65 to 67 – for Old Age Security, starting in 2023.
Inadequate incomes resulting from a person’s retirement before attaining the age of public pension entitlement raise many concerns. One concern is what might happen with later entitlement ages. Will many persons suffer by having to wait more years before receiving public pensions? For example, Munnell, Meme, Jivan, and Cahill (Reference Munnell, Meme, Jivan and Cahill2004) have noted concerns about the impact of a longer wait on early retirees and also a spillover impact on other public programs. Beyond any concern about future changes to retirement ages as they relate to public pensions, today’s early retirees in Canada are of interest as well. Milligan (Reference Milligan2008) documented a large increase in those living below an income poverty line experienced by those who retire before age 65, the age of full public pension eligibility. This increase further motivates an interest in those retiring early. Finally, recent concern about the adequacy of the entire pension system in Canada has resulted in several proposals for reform, ranging from an expanded Canada Pension Plan (CPP) to supplemental pension plans with private accounts. A major focus of these concerns has been the adequacy of retirement income for those without a workplace pension plan.
The study described in this article examined the well-being of those making early exits from the workforce in Canada. In particular, two main questions were addressed. First, what are the income patterns among early retirees? Second, how do early retirees avoid economic hardship? The study approached these questions through the use of the Survey of Labour and Income Dynamics (SLID) which contains a rich description of the labour market activity and the incomes of a large sample of Canadians. The unique contribution of the research is its focus on the pre-retirement years and the incomes specifically of those not working. The research also contributes a novel accounting approach to understanding how Canadians avoid falling into low income in the years before full public pension entitlement.
The literature review draws on a number of distinct strands of research in the retirement literature. Several researchers have investigated the evolution of well-being in the years leading up to retirement. For example, Baker, Gruber, and Milligan (Reference Baker, Gruber and Milligan2009) and Milligan (Reference Milligan2008) developed and reported on different measures of income poverty and consumption poverty through time in Canada. The question of income composition in retirement in Canada was addressed in detail in a study by Baker and Milligan (Reference Baker and Milligan2009) and which built on an extensive literature cited therein. The adequacy of retirement income in Canada was analysed by LaRochelle-Côté, Myles, and Picot (Reference LaRochelle-Côté, Myles and Picot2008), who studied what percentage of worklife income is replaced by retirement income into retirement. Transitions to retirement were analysed by Johnson and Mermin (Reference Johnson and Mermin2009), who looked at the suffering of hardship by those retiring early in the United States. Butrica and Karamcheva (Reference Butrica and Karamcheva2012) and Milligan (Reference Milligan2012) both studied well-being and incomes in the years before reaching Social Security eligibility in the United States using the Health and Retirement Study. Engelhardt and Gruber (Reference Engelhardt and Gruber2004) examined the income levels and poverty rates experienced by those who retired before the age of public pension eligibility. Hébert and Luong’s study (2008) involved bridge employment in Canada, which takes someone from a “career” job to retirement.
There are several important findings in this research. First, incomes display increasing compression as age 65 approaches, but there is wide dispersion of income among those not working. Second, for those exiting the workforce early, low incomes are more prevalent for those without employment-related pension income and those suffering from poor health. Finally, around three-quarters of those not working at pre-eligibility ages avoid falling into low income, with the largest source of help being income from other family members.
Institutional Background
Given the focus of the research on earlier retirement, I note the key parts of the retirement income system in Canada that relate to those aged 55–64. However, a more detailed description of each element in the system can be found in Baker and Milligan (Reference Baker and Milligan2009). The Canadian retirement income system conforms closely to the ideal set out in the World Bank’s “three pillar” model (1994). The first pillar comprises a suite of income transfers that do not directly relate to employment. The Old Age Security (OAS) pension is a monthly demogrant paid to Canadians aged 65 and older, with a reduced amount for some immigrants. The Guaranteed Income Supplement (GIS) is also paid to those aged 65 and older, but is income-tested using a couple’s combined income from sources other than the OAS pension. Finally, an Allowance is paid to those aged 60–64 who are married to an OAS recipient and an Allowance for the Survivor is similarly paid to those aged 60–64 who are predeceased by a spouse. Footnote 1
The next pillar is provided by the earnings-related CPP program, and the separate but similar Quebec Pension Plan (QPP). These plans provide retirement, survivor, and disability benefits as a function of employment earnings. The formula for retirement benefits is a fixed percentage of adjusted lifetime earnings up to a pensionable cap set around median earnings ($51,100 in 2013). Survivor benefits and disability benefits contain both a flat amount and an earnings-related amount. Disability benefits are available before retirement ages, but are transformed to a retirement pension at age 65. There is an early retirement option with reduced benefits starting at age 60 under both the Q/CPP.
Finally, the third pillar comprises private savings and employer-provided pensions. Private savings can accumulate in a tax-preferred form through Registered Retirement Savings Plans (RRSPs) or Tax Free Savings Accounts (TFSAs). Employer-sponsored pensions (known as Registered Pension Plans [RPPs]) are widespread among larger employers and also receive special tax treatment. About 40 per cent of Canadian employees are covered by RPPs, with a gender gap that now favours females, although for previous cohorts the gap favoured males. Footnote 2
There are other sources of income that might be received among those aged 55–64. For those aged 55–59, there is no direct entitlement to public retirement benefits. However, some individuals may receive survivor benefits in this age range from the Q/CPP if predeceased by a spouse or receive disability benefits if disabled. In this age range, access to normal income supports from sources like employment insurance or social assistance is possible. Also, depending on the provisions of a workplace pension, individuals aged 55–59 may receive retirement benefits from the workplace pension. Among those aged 60–64, access to benefits is quite different. First, early retirement through the Q/CPP is available to those with a sufficient earnings history. Second, those married to an older spouse or predeceased by a spouse can access Annual Allowance and Allowance for the Survivor benefits. Finally, workplace pensions may also pay benefits over this age range.
In summary, the Canadian retirement system may be characterized as having partial access to public benefits at age 60 and full benefits at age 65. This situation is what motivated the study of early retirees aged 55 to 64.
Empirical Approach
The empirical approach described in this article utilized data from the Survey of Labour and Income Dynamics (SLID). These are presented in the form of graphs and descriptive regressions. The following equation was the basis used for the regression analysis:
 $$Y_{it}^* = {\beta _0} + {\beta _1}{X_{it}} + {\beta _2}{X_{i0}} + {e_{it}}$$
where
i indexes individuals
t indexes time
 $Y_{it}^*$
is the latent outcome
X it is a vector of characteristics at time t
X i0 is a vector of characteristics at time 0, when the individual is first observed, and
e it is a normally distributed disturbance term.
The latent variable
 $Y_{it}^*$
is the unobserved propensity to have low income. The observed variable Y
it
is a binary variable indicating whether the individual lives in a family that is under a low-income threshold (discussed in more detail below). These models were estimated using probit estimation. The standard errors were adjusted for heteroskedasticity using robust standard errors. Also, to account for multiple observations for a particular individual, standard errors were clustered by individual.
Most of the analysis took place at the level of the individual. While incomes may be shared across family members, the act of working (or not) is an individual concept. Since the study’s primary focus was the well-being of those who were not in the labour market in the 55–64 age range, the individual took the centre of the analysis. Information on the broad economic family was incorporated into the measures of income hardship in the last part of the analysis.
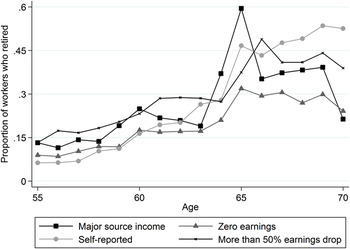
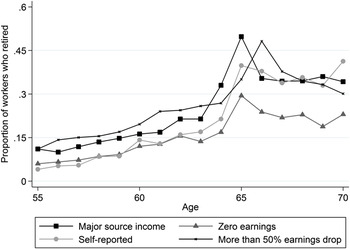
Two definitions are important for the analysis: retirement and low income. The definition of retirement can be contentious. Denton and Spencer (Reference Denton and Spencer2009) provided a thoughtful review of the main issues, and Borland (Reference Borland2004) developed a conceptual framework. Figures 1 and 2 plot the proportion of women and men who exit the labour force by age using four different definitions of exit. The lines graphed are hazard rates, showing the proportion who no longer work given that they were working in the previous year. The four definitions presented are (a) self-reported labour force status being retired, (b) earnings no longer being the major source of income, (c) earnings dropping below half of the previous year, and (d) zero earnings. The broader definitions (less than half earnings; earnings not major source) capture more temporary out-of-work episodes such as a spell of unemployment, so at ages in the 50s these measures are higher than the more narrow self-assessed and zero-earnings definitions. The zero-earnings definition is tightest at ages after 60 for both sexes. All measures show increasing rates of exit by age, with a particular spike at age 65.
Proportion of working women who exited the workforce at each age
Notes: Data are from the Survey of Labour Income Dynamics. Graphed is the proportion of women who exited the workforce at each age, given that they were still working in the previous year. These are hazard rates. The four lines indicate four different definitions of labour market exit.

Proportion of working men who exited the workforce at each age
Notes: Data are from the Survey of Labour Income Dynamics. Graphed is the proportion of men who exited the workforce at each age, given that they were still working in the previous year. These are hazard rates. The four lines indicate four different definitions of labour market exit.

Zero Earnings
The main approach I took in this study was to look particularly at those retirees with zero earnings. Having zero earnings required a total withdrawal from the paid labour market. This definition is useful given that the major concern of this research was the well-being of those who were not working before the age of public pension eligibility, whether they self-assessed as “retired” or not. People could be not working because they never worked, or perhaps they were temporarily out of the job market and expecting to return to work in the future. Either way, the policy concern of interest here was the welfare of those who were not working at ages before public pension eligibility. For this reason, the zero earnings definition was the best fit for the question posed by the study described in this article. The sensitivity of retirement behaviour to the definition of retirement was analysed in Milligan (Reference Milligan2013).
Income Deprivation
The second measurement issue in the study was accounting for economic hardship. In order to measure economic hardship, I used a measure of income deprivation. Giles (Reference Giles2004) provided an overview of low income measurement in Canada. The analysis focused, for the most part, on the low income cut off (LICO). The LICO counts the proportion of people living in a family with income below a specific cut-off line. Footnote 3 After-tax measures of low income are preferable, since it is after-tax income that is transformed into an individual’s well-being. However, for some of the analysis, only pre-tax income was feasible to construct, so before-tax measures were used for that purpose. Milligan (Reference Milligan2008) explored different income deprivation measures for their suitability in the case of elderly adults’ low-income measurement. Milligan (Reference Milligan2013) showed the analysis appearing here with several different measures of income deprivation.
Data Collection and Analysis
Data for these analyses were drawn from the SLID, a survey described in detail by Statistics Canada (2010). The SLID provides in-depth income and labour market information on a sample of Canadians, which can be made representative by means of the provided survey weights. Unfortunately, there is no information in the SLID on assets held by the individuals in the dataset. Respondents stay in the sample for six years, and every three years a new panel is started, resulting in two overlapping panels in existence at any one time. The SLID data for 1993 to 2008 were used in the current study, pooling the panels together. This dataset ended before the main onset of the consequences resulting from the 2009 financial crisis – future work could look into how older workers fared during this turbulent period. Because of the six-year limit to the panel, at most only six years of data can be analyzed for a given set of individuals. This motivated the splitting of the sample into ages 55 to 59 and 60 to 64 for some of my analysis.
The regression analyses examined which characteristics were predictive of being in low income. Some of these characteristics were demographic (education, age, marital status, family size, immigration status) while others were health-related (health in the survey is self-reported as fair or poor, work-limiting disability). Workplace characteristics (workplace pension, public sector, union or collective agreement, industry) were only available for those who were currently working. For all of these characteristics (demographic, health, and workplace), the values at age 54 for the age 55–59 analysis and at age 59 for the age 60–64 analysis were assessed. This assessment addresses the concern of endogeneity about how people’s characteristics may affect their response to not working.
For the income distribution and low-income analyses, total income was decomposed into three mutually exclusive and exhaustive categories. The three categories are (1) labour market earnings, (2) government transfers, and (3) non-labour private income. The labour market earnings category comprises earnings from paid employment or self-employment. The government transfers category includes retirement-related programs such as the Q/CPP, OAS (and the related Guaranteed Income Supplement and Allowance), social assistance income, and Employment Insurance income, along with other government transfers. Finally, the third category of non-labour private income includes income from employer-sponsored pensions, investment income, and any other income. While total income is available on an after-tax basis, the individual components of income are only available pre-tax.
Results
The empirical results from the SLID dataset are presented here in three steps. First, on the income distribution of those approaching age 65, I look at all observations and then only at those who had no earnings. Next, I report greater detail at the patterns of income hardship by age, and the determinants of low income, looking at the characteristics of those early retirees who were experiencing low income. Finally, I explore how those not working before age 65 were able to avoid hardship using an accounting analysis that examined what sources of income were most important for an individual’s avoiding low-income status.
Income Distribution and Composition Approaching Pension Ages
Four figures in this article illustrate the distribution and sources of income at ages before public pension eligibility. I used individual rather than family income since the policy concern motivating the current study was the worry that those exiting the labour market before statutory retirement ages may have suffered hardship until they could access public pensions. Since labour market participation is an individual concept, the analysis focused on the individual. However, in the accounting analysis which follows, I considered a full account of family sources of income.
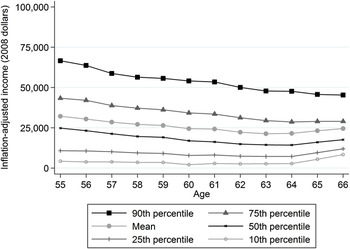
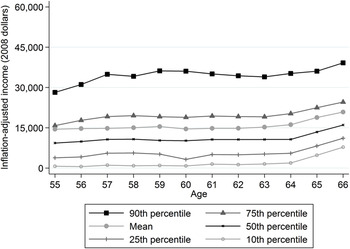
Figure 3 shows several key percentiles and the mean of total income for women. Percentiles for individuals aged 55 to 66 are displayed to provide context as individuals in the study data became eligible for the full suite of public pensions by age 65. All incomes were adjusted to 2008 values using the Consumer Price Index. Incomes at all levels declined from ages 55 to 64, before rebounding at ages 65 and 66 for those at the median and below. The level of income was not high for these women, with a median below $25,000 at all these ages. At the 10th and 25th percentiles, incomes dropped by about a third between ages 55 and 64 before rebounding strongly as public pension entitlement increases at age 65. In contrast, incomes at the 90th percentile dropped a bit less by age 64 but continued down after reaching age 65.
Income distribution, women
Notes: Data are from the Survey of Labour Income Dynamics. Graphed are some percentiles and the mean of income taken at each age for women.

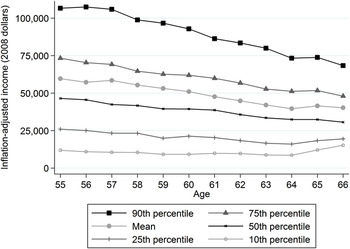
For men, the patterns are the same, but with much more dispersion (see Figure 4). The 90th percentile of income was over $100,000 at ages 55 to 57, while the 10th percentile was at levels quite similar to the women. The same large percentage increase at the 10th and 25th percentiles after age 65 is evident for men as it was for women.
Income distribution, men
Notes: Data are from the Survey of Labour Income Dynamics. Graphed are some percentiles and the mean of income taken at each age for men.

The decreases in income percentiles in the top half of the distribution could reflect higher earners who decided to stop working because they could afford an early retirement. Across ages, if the share of non-earners taken up by those who had high lifetime earnings increases, then one might expect to see increasing retirement income across ages at higher percentiles. This is examined next where the income distribution among non-earners is shown.
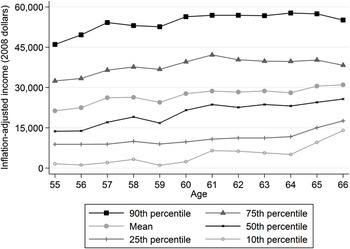
The aforementioned analysis included all individuals, working or not. The next analysis focuses on those who were not working, using the zero-earnings definition. This allows attention to be paid to those who were potentially suffering from having retired before reaching the age of public pension eligibility. In Figures 5 and 6, the income distribution for women and men who had zero earnings evolved quite differently across ages than was seen for the whole sample earlier in Figures 3 and 4. First, the figures show incomes at higher percentiles growing across ages, except for a slight post-age-65 dip. Second, the levels of income in the bottom half of the distribution for both men and women were quite weak. Median income for women did not attain $15,000 until age 65, for example, and the 75th percentile did not attain $20,000 until age 64. Some attention to the top half of the distribution is worthwhile, as well. Perhaps it is surprising that more than 25 per cent of men without any earnings had income above $30,000 at all ages, but the other sources of income are sufficient to provide income at that level for these men.
Income distribution, women with zero earnings
Notes: Data are from the Survey of Labour Income Dynamics. Sample includes only those with zero earnings. Graphed are some percentiles and the mean of income taken at each age for women.

Income distribution, men with zero earnings
Notes: Data are from the Survey of Labour Income Dynamics. Sample includes only those with zero earnings. Graphed are some percentiles and the mean of income taken at each age for men.

To summarize, the examination of incomes at ages of individuals approaching pension eligibility revealed several interesting findings. First, the dispersion of individual incomes of men and women tends to shrink across these ages, with a particular change at age 65. Second, while the majority of those who not working at these ages have substantial individual incomes, a significant minority are at risk of experiencing low income.
Determinants of Low Income before Age 65
The income distribution among those aged 55–66 analysed in the previous section was for individuals, and did not take into account income resources that may be provided by other family members. For example, if one spouse was not working or had no pension, hardship might be avoided if the other spouse remained employed or had a large source of employer-sponsored pension income. This section focuses on patterns of income deprivation and the determinants of living in a family with low income. An individual was scored as being in low income if they lived in an economic family with income below the given cut-off level.
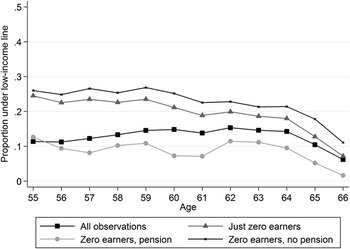
The figures display the population in groups of those with zero earnings, and those with and without employer-sponsored pension income. These graphs display only the LICO after-tax measure. For women in Figure 7, zero earners had about twice the rate of low income as the whole population, going from 24.5 per cent at age 55 to 18.0 per cent at age 64. Although these rates were elevated compared to the whole population, it is surprising that these low-income rates were so low given the very low incomes recorded by non-earners in Figure 5. The reason for this finding is likely the availability of income from other family members – a hypothesis I will address in the next section. The rates for having income under LICO for those with and without pensions were quite far apart, but still those without employer-sponsored pension income or earnings only had low-income rates a bit over 25 per cent.
Proportion in families with income under the low income cut off (LICO), women
Notes: Data are from the Survey of Labour Income Dynamics. Graphed is the proportion of women living in families with income less than LICO at each age. The four lines show the proportion under LICO for four different samples.

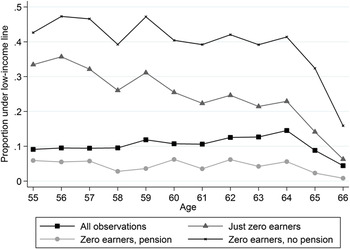
Figure 8 shows that men had a much wider variation in low-income rates depending on their sources of income. More men have non-working spouses than do women, so not as many men can rely on spousal income to raise them out of low income should their own income sources fall short. With employer-sponsored pension income, low-income rates were around five per cent across ages 55 to 64. For those without a pension, however, the low income rate was at or over 40 per cent for most ages between 55 and 64. This is quite different than was seen for women in Figure 7.
Proportion in families with income under the low income cut off (LICO), men
Notes: Data are from the Survey of Labour Income Dynamics. Graphed is the proportion of men living in families with income less than LICO at each age. The four lines show the proportion under LICO for four different samples.

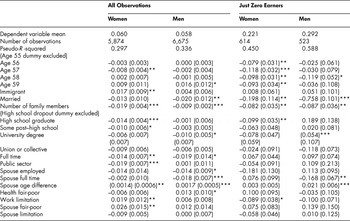
In order to deepen the analysis of who falls into low income, regressions were run using a dummy dependent variable indicating whether the individual was in a family with after-tax income below the LICO line. Additionally, a set of age dummies, demographic variables, workplace characteristics, and health characteristics were included in the analysis. The demographic, workplace, and health variables were all recorded in the year before the first year of the sample. This means age 54 for the 55–59 age sample and age 59 for the 60–64 age sample. This avoids endogeneity between low income and the characteristics that were observed contemporaneously. Also included, but not reported, were a constant term, sets of province and industry dummies, dummies for the size of the employer, and dummies for the size of the urban area of residence. The regressions were run using probit models, with heteroskedasticity-robust standard errors, clustered on each individual. There were separate regressions by sex, and for a sample of all individuals and just those who had zero earnings. There were also separate samples for ages 55–59 and 60–64. Note that the sample here includes only those who were employed at age 54 (for the 55–59 sample) and 59 (for the 60–64 sample), as workplace characteristics could not be observed for those who were not working.
Results for the 55–59 age sample are reported in Table 1. The age dummies do not seem to be important in explaining low income for either men or women in the whole sample. This suggests that the increasing prevalence of zero earnings with age does not result in commensurate increases in low-income incidence. Being married and having more family members are characteristics with strong and statistically significant negative impacts on the incidence of low income. The education variables can be thought of as capturing some part of the capacity for lifetime higher earnings. In this study, higher education levels were associated with lesser incidence of low income, compared to the left-out category of high school dropouts. For the workplace characteristics, having a pension had a statistically significant 2.1 percentage point effect on low income, and working full-time or in the public sector had slight negative effects. Having a work-limiting disability increased the likelihood of low income by 1.9 percentage points, as did having a spouse in fair or poor self-assessed health. The coefficients for men in the second column of Table 1 are broadly similar to women, with the exception of spousal health. For men, having a spouse with fair or poor health had no significant effect on low income.
Determinants of low income, ages 55–59

Data are from the Survey of Labour and Income Dynamics. The dependent variable is a dummy for living in a family with income less than after-tax low income cut off (LICO). Reported are marginal effects from probit regressions. Standard errors are robust corrected for heteroskedasticity and clustered by individual. Three asterisks indicate statistical significance at the 1 percent level; two asterisks for 5 percent; one asterisk for 10 percent. Also included but not reported here are a constant term, year dummies (1994–2008), province dummies (10), occupation group dummies (10), industry dummies (16), number of employees dummies (5), and urban area size dumies (5). All demographic and job characteristics observed at age 54. The Pseudo-R-squared reported is the McFadden R-squared.
The right-hand panel of Table 1 repeats the analysis but includes in the sample only those who had zero earnings but were working at age 54. The pseudo-R-squared for this regression is quite high for women at 45 per cent. Some of the age dummies show large negative statistically significant coefficients, suggesting that the older women with zero incomes may have had more resources from other sources than those at age 55, which allowed them to escape low income. The most important variables for predicting low income in this sample are being married and having an employed spouse. This emphasizes the importance of other family members in staving off low-income status for those who were not earning at these ages. The education variables are more important here, perhaps suggesting the importance of lifetime earnings. The point estimate for a workplace pension is still large at –0.114, but is significant only at the 10 per cent level. The other workplace characteristics are not significant.
Men in the zero-earnings sample on the right-hand side of Table 1 had a low-income rate of 0.292, and a very high 58.8 per cent of the variation in this rate can be explained by the variables included here (the foremost of these was being married). Men who were married at age 54 reduced their probability of low income by 0.758, and this was further enhanced if the spouse was working full-time at age 54. Finally, having a university degree lowered the probability of low income by 25.4 percentage points.
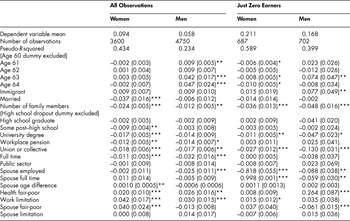
The analysis of the determinants of low income was repeated for the 60–64 age sample in Table 2. Most of the same patterns emerged, with being married or having more family members, having a working spouse, and being covered by workplace pensions and unions/collective agreements being important. Footnote 4 In addition, the health determinants were much more important at these ages. For both women and men, having a work limitation or being in fair/poor health at age 59 increased the likelihood of low income in both the full sample and the zero-earning sample. In the zero-earning sample, having a spouse in fair/poor health decreased the likelihood of low income for men.
Determinants of low income, ages 60–64

Data are from the Survey of Labour Income Dynamics. The dependent variable is a dummy for living in a family with income less than after-tax low income cut off (LICO). Reported are marginal effects from probit regressions. Standard errors are robust corrected for heteroskedasticity and clustered by individual. Three asterisks indicate statistical significance at the 1 percent level; two asterisks for 5 percent; one asterisk for 10 percent. Also included but not reported here is a constant term, year dummies (1994–2008), province dummies (10), occupation group dummies (10), industry dummies (16), number of employees dummies (5), and urban area size dumies (5). All demographic and job characteristics observed at age 59. The pseudo-R-squared reported is the McFadden R-squared.
The regression results bring forward the importance of workplace pensions and spousal income in avoiding a fall into low income in the 55–64 age range. Those who were not married were at much higher risk of falling into low income, while workplace pensions and unionized workplaces also had a protective effect. These factors form a key part of the hardship accounting analysis which follows. The importance of the health variables at ages 60–64 suggests that not working in this age range may have been unplanned, leaving individuals unable to cope with the effect of their poor health on income. Of course, the causal nature of these results is not certain, as factors outside the variables considered here may have influenced both low-income status and the variables included.
Accounting for Hardship before Age 65
The final set of study results in this article addresses the question of how individuals who were not working at ages 55–64 avoided falling into low income. The focus on those not working rather than the full sample was deliberate, since the policy concern was whether those not working were able to bridge themselves to the age of public pension eligibility. The purpose of the analysis was to build up the economic situation of each individual from its components and observe how these components affected the proportion in low income. The analysis was done first for women, then for men. Again, since the work decision was measured at the individual level, the analyses in the tables begin with individual-level income measures but then proceed to add the relevant family income measures.
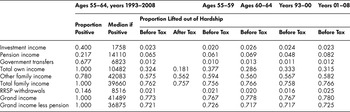
Table 3 shows the accounting analysis for women. The sample for this analysis included all women with zero earnings, ages 55–64. The first column reports the proportion of each income source that is positive, the second column reports the median value conditional on its being positive, and the third column shows the proportion of individuals who were lifted above the before-tax LICO threshold, given each source of income. The focus here is on before-tax income because it is conceptually difficult to deal with components of income on an after-tax basis. Footnote 5 For the components of income where it was possible to use after-tax LICO, the proportion lifted out of low income is reported in the fourth column. The right-hand side’s four columns repeat the before-tax LICO analysis using different samples: ages 55–59, ages 60–64, and year ranges 1993–2000 and 2001–2008.
Accounting for the avoidance of low income for those without earnings, women

Based on author's calculations from the Survey of Labour and Income Dynamics. Sample includes only those without earned income.
The first row shows the importance of investment income for women. Forty per cent of women in the study had a positive amount of investment income, but the median was only $1,758. Consequently, only 2.3 per cent of women were lifted out of LICO low-income when considering just their investment income. Employer-sponsored pension income was received by 21.7 per cent of women in this sample. The median amount here is much higher at $14,110, but only 6.5 per cent of women were lifted above the before-tax LICO threshold when just their employer-sponsored pension income was considered. Government transfers were prevalent among women, with 67.7 per cent having attained some form. However, the amounts were quite low, with a median of only $6,823. Only 1.2 per cent of women were lifted above LICO by their government transfer income. Adding these income sources together gave total own income. The median own-income among women with no earnings was $10,482, and only 32.4 per cent of women would avoid being below before-tax LICO using just their own income. In other words, two-thirds of women would be under before-tax LICO if they did not have access to income sources beyond their own. On an after-tax-basis, the proportion pulled above LICO using only total own after-tax income was just 18.1 per cent. This is noticeably smaller than the 32.4 per cent on a pre-tax basis.
The bottom half of Table 3 shows what happens to the zero-earning women when other income sources were considered. Seventy-eight per cent of the women had some other source of income in their economic family, with a median value of $42,083. With that source alone, 57.5 per cent of women would be out of before-tax LICO. When added to their own income to make total family income, 76.2 per cent of women were lifted above the before-tax LICO threshold. This can be compared to the after-tax LICO number since total income is available after-tax in the SLID. The result is nearly the same, at 75.7 per cent. Thus, three out of four women who were not working were able to avoid falling into low-income status considering these sources of income.
The next row considers RRSP withdrawals, which are not included in the SLID definition of total income. These withdrawals were observed in 14.6 per cent of the women’s families, and these withdrawals alone lifted 2.1 per cent of the families above the before-tax LICO. When the RRSP withdrawals were added to the total family income, the resulting sum is what I refer to as the “grand income”. With this broad measure of income, 77.3 per cent of women lived in families that were lifted above the before-tax LICO.
The final row of the analysis for women subtracts any observed employer-sponsored pension income from the grand income. This calculation allowed assessment of the importance of employer-sponsored pension income in removing these zero-earning women from a state of before-tax LICO low income. The proportion changed from 77.3 per cent to 72.1 percent. This suggests that about 5.2 percentage points – or 6.7 per cent of the total 77.3 point share – could be accounted for by employer-sponsored pension income. For women, income from other family members was much more important than employer-sponsored pension income for avoiding low income.
The right-hand columns of Table 3 show the sensitivity of these calculations to the different age ranges and years. There is not much variation in the answers across these different samples, although total own income does matter slightly more for the ages 55–59 sample than the ages 60–64 sample.
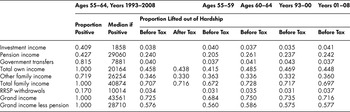
Table 4 repeats the accounting exercise for men. Investment income for men was present in 40.9 per cent of cases; similar to that for women, the median amount was small and lifted very few men above the before-tax LICO threshold. Employer-sponsored pension income, on the other hand, was very important for men: 42.7 per cent of men had some employer-sponsored pension income and the median amount was $29,060. Pension income alone lifted 24 per cent of men above the before-tax LICO threshold. Government transfers were prevalent, but small. They had a negligible effect on the low-income rate.
Accounting for the avoidance of low income for those without earnings, men

Based on author's calculations from the Survey of Labour and Income Dynamics. Sample includes only those with no earned income. (RRSP = Registered Retirement Savings Plans).
Using just individual income, with a median of $20,164, 45.8 per cent of zero-earning men were lifted above the before-tax LICO threshold. In other words, nearly half of men with no earnings at these ages had non-earnings own-income sources that allowed them to exceed deprivation levels.
Other family income was only slightly less prevalent for men, at 71.9 per cent versus 78.0 per cent for women. The amounts, however, were much smaller, with a median of $26,254. When combined with own-income, 70.7 per cent of men were lifted above the before-tax LICO threshold. This is nearly the same as with the after-tax LICO measure, which gave 71.6 per cent.
RRSP withdrawals were observed in approximately one in six families, with a median of $10,014. When combined with total family income to arrive at a grand income, the median value was $43,561. Of zero-earning men, 72.5 per cent were lifted above the before-tax LICO threshold. This compared with 77.3 per cent of women.
The final row removes the amount of employer-sponsored pension income from the grand income total. This draws attention to the importance of employer-sponsored pension income for zero-earning men to avoid hardship. Without employer-sponsored pension income, only 57.6 per cent of men would rise above the before-tax LICO threshold. This is a 14.9 percentage point drop from the grand-income level, or 20.6 per cent of the total 72.5 per cent who were lifted above before-tax LICO. While much larger an effect than was seen for employer-sponsored pension income for women, this was still less of an impact than other family income. That is, the income of other family members was more important for lifting zero-earning men out of before-tax LICO hardship than employer-sponsored pension income, at these age ranges.
The other columns in Table 4 show how the calculations changed in different age subsamples and year subsamples. Pension income was more important in the older 60–64 age sample than in the 55–59 age sample. There was little difference across the two year ranges.
To summarize these calculations, in this section I attempted to quantify the importance of different income sources for men and women who were not working in the 55–64 age range. For both men and women, income from other family members is of critical importance in lifting them out of economic difficulty, as measured by low income. The absence of employer-sponsored pension income would cut the proportion of men surpassing the low income threshold by about 20 per cent, but for women the drop would be only six percent. In this way, one’s own employer-sponsored pension income is more important to the well-being of men.
Conclusion
This study assessed patterns of income and economic hardship among those approaching the ages of public pension eligibility in Canada. Several important findings emerged: (1) the incomes of Canadians show an increasing compression as age 65 approaches; (2) among those not working, spouses and pensions are the best predictors of having low income or not (approximately 77% of women and 73% of men who are not working are able to avoid low income status, and that the most important factor for this avoidance is the presence of income from other family members); (3) good health matters as well for avoiding low income; and (4) for men, employment-related pension income is also a large factor in avoiding low incomes.
These results can be compared to similar studies from the United States, such as those by Johnson and Merriman (Reference Johnson and Mermin2009), Butrica and Karamcheva (Reference Butrica and Karamcheva2012), and Milligan (Reference Milligan2012). Health, education, and marital status were strong predictors for Americans of hitting difficulties before reaching the age of Social Security entitlement. The proportion of respondents with low income increased with age until age 62, when the availability of Social Security ameliorated the income shortfall for many. For Canadians, the proportion in low income did not display an upward trend with age before eligibility ages were reached, but hitting full eligibility at age 65 did have a large impact on the pattern of incomes. As for the factors influencing hardship, health and family status were also important for Canadians, although education was less so. Overall, however, there are strong similarities in that a portion of the population appears to have difficulty making it to public pension eligibility age without experiencing income hardship.
Future work in this area may address more carefully the transitions between near-retirement ages and the ages of full public pension eligibility. Important questions remain, such as how exactly those in low income smooth their consumption on the way to public pension eligibility ages, and whether those who are in low income at these earlier retirement ages stay in low income after age 65. Also, the impact of employment-based pensions on women is likely to grow in the future, as the proportion of younger women with pension coverage now exceeds that for men.