Implications
Currently there is some disagreement about the phosphorus (P) requirements of pigs of different genotypes and how digestible P contents of pig diets are calculated, especially for diets that include different amounts of phytate and non-phytate P. Achieving a balance between meeting digestible P requirements for optimum growth and health, and avoiding excess P intake would lead to a reduction in diffuse P levels in manure and effluents, and environmental impact from pig systems. A simulation model that predicts P intake, digestion, retention and excretion is the first, necessary step towards achieving this aim.
Introduction
Phosphorus (P) is an important mineral for both the metabolism and skeletal development of the growing pig (NRC, 2012). In pig diets, P is the third most expensive nutrient required, after carbohydrates (energy) and protein. The high cost of P is due to the low digestibility of plant dietary P, which results in the need to supplement with expensive, non-renewable inorganic P to meet the digestible P requirements (dPreq) of the animals (Selle et al., Reference Selle, Ravindran, Cowieson and Bedford2011). The low digestibility of P also contributes to high P excretion, causing water pollution, in the form of eutrophication (Selle et al., Reference Selle, Ravindran, Cowieson and Bedford2011).
The low digestibility of dietary P is because the majority of plant P is in the form of phytate P (oP), which needs to be dephosphorylated by phytase enzymes into the digestible non-phytate P (NPP). Phytate dephosphorylation is mainly affected by: (1) exogenous phytase enzymes, which are composed of plant and microbial phytases; (2) endogenous phytase enzymes, found in the small, as well as in the large intestine; (3) pH of the gastrointestinal system; (4) digesta flow rate; and (5) dietary Ca concentration (Létourneau-Montminy et al., Reference Létourneau-Montminy, Narcy, Lescoat, Magnin, Bernier, Sauvant, Jondreville and Pomar2011).
In silico experimentation through mathematical modelling offers a feasible alternative to experimentation to investigate the consequences of management treatments that aim to maximize P digestion and retention, while minimizing P excretion. Using our current understanding of P digestibility and the principles of retention, a mechanistic model may be developed that could incorporate all factors affecting retention and excretion, in order to decrease P excretion and the use of expensive inorganic P, leading to both environmental and economic benefits. The main aims of this paper were to: (1) develop a dynamic, deterministic model that would translate total dietary P (tP) into digestible P (dP); (2) simulate dP retention; (3) estimate P excretion in terms of both insoluble P and the more environmentally hazardous soluble P by growing and finishing pigs. In addition, the developed model was tested for the responses of different pig genotypes offered foods of different compositions, in terms of tP content.
Material and methods
A general overview of the model
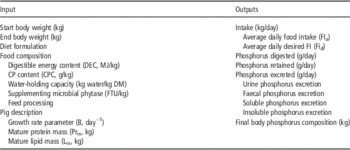
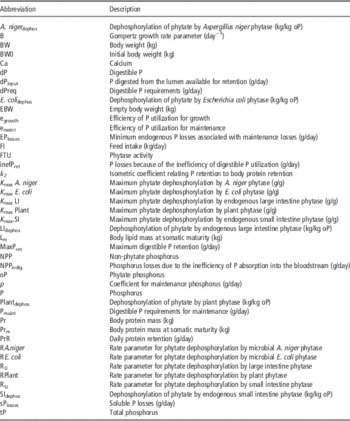
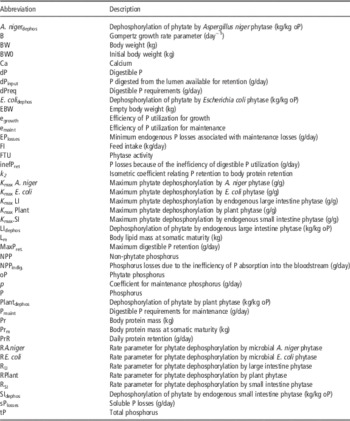
A deterministic, dynamic model was developed; it consists of four modules; referred to as: (1) Digestion; (2) Food intake; (3) Retention and (4) Excretion. The overall inputs to, and outputs from the model are listed in Table 1 and the list of abbreviations used in the model description is shown in Table 2.
Model inputs and main model outputs

Abbreviations of names for entities used in the model
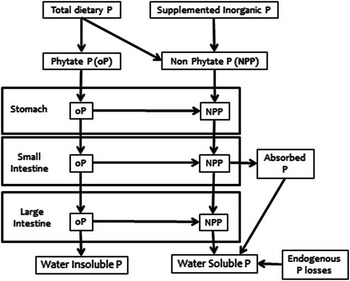
A schematic description of the digestion module of the model is shown in Figure 1. Its first step was the consideration of tP (g/kg diet) as oP (g/kg diet) and NPP (g/kg diet). The P digested in the ‘digestion’ part of the model was expressed in g/kg diet. There was the need to estimate food intake (FI) in g/day in order to estimate the actual P digested, retained and excreted in g/day (see below). The P requirements, dPreq were calculated as a function of maintenance and maximum P retention, taking into account the inefficiency of P utilization for growth. Any dP (g/day) supplied in excess of the requirements was excreted through the urine as soluble P.
Schematic description of the model of phosphorus (P) intake, digestion, retention and excretion. Food resources contain phytate (oP) and non-phytate P (NPP). oP is dephosphorylated in the stomach by exogenous microbial and plant phytase. In the small and large intestine the oP dephosphorylation takes place by endogenous phytase. The remaining oP is excreted as insoluble P, while the endogenous P excreted and NPP that is neither digested nor utilised are excreted as soluble P.

Representation of P digestion
The P in plant feedstuffs consists of oP and NPP in different concentrations. Inorganic P and animal-based feedstuffs do not contain oP, but may have different P digestibilities (Sauvant et al., Reference Sauvant, Perez and Tran2004). Data for establishing the oP and NPP content of feedstuffs included in any diet were primarily taken from the INRA feed tables produced by Sauvant et al. (Reference Sauvant, Perez and Tran2004).
In the model, the process of P digestion begins in the stomach, provided that no fermentation of the feed ingredients took place before feeding (Blaabjerg et al., Reference Blaabjerg, Strathe and Poulsen2012). In the stomach, supplemented microbial and/or plant phytase dephosphorylates oP into NPP. The plant phytase activity of each feed ingredient can be found in the comprehensive feed tables of Sauvant et al. (Reference Sauvant, Perez and Tran2004), which were used to derive diet plant phytase activity (FTU/kg). The model takes into account that if the feed ingredients were exposed to temperatures of more than 80°C (Nair et al., Reference Nair, Laflamme and Duvnjak1991), mainly by steam-pelleting, a 50% reduction in plant and microbial phytase activity would take place (Jongbloed and Kemme, Reference Jongbloed and Kemme1990). The decrease in phytase activity occurs because phytase is prone to denaturation after exposure to high temperatures.
Diurnal variation in pH, such as before and after feeding (Kidder and Manners, Reference Kidder and Manner1978), has the potential to influence the activity of phytase enzymes, the solubility of oP (Selle and Ravindran, Reference Selle and Ravindran2008) and the formation of insoluble and indigestible Ca–oP complexes (Selle and Ravindran, Reference Selle and Ravindran2008). However, in the model, it was assumed that possible fluctuation in pH does not affect P digestibility and consequently no oP–Ca complexes were assumed to be formed in the stomach. A first-order kinetics equation to represent the oP dephosphorylation by plant phytase was used:
 $${\rm oP}_{{{\rm dephos}}} =K_{{\rm max}} \cdot (1{\minus}e^{{{\minus}{\rm R{\times}FTU}}} )$$
where, oPdephos is the amount of oP dephosphorylated per unit of oP (kg/kg oP), K max is the maximum ratio of oP dephosphorylation (i.e. the total amount of ‘reactive’ phytate), FTU is the phytase activity, and R is the rate parameter. The equation was fitted to the data provided by Sauvant et al. (Reference Sauvant, Perez and Tran2004), and details are presented in Supplementary material and Supplementary Figure S1.
Microbial phytases are currently used widely in grower and finisher pig diets. There are different types of microbial phytase, but this paper quantified the effects of two main categories of phytase enzymes: 3- and 6- phytases, derived from Aspergillus niger and Escherichia coli (Adeola et al., Reference Adeola, Olukosi, Jendza, Dilger and Bedford2006). Once oP dephosphorylation was calculated, a first-order kinetics equation, similar as equation (1), was fitted to the observed results for A. niger and E. coli and details are presented in Supplementary material and Supplementary Figure S2.
The model does not take into account any plant and microbial phytase activity in the small intestine, due to the combination of the low solubility of phytate and the ability of protease enzymes to denature phytase (Zhao et al., Reference Zhao, Liu, Zhang and Zhang2010). Phytate that is not dephosphorylated into NPP in the stomach and duodenum rapidly scavenges Ca in the small intestine, due to the alkaline environment (Selle and Ravindran Reference Selle and Ravindran2008). These Ca-oP complexes are insoluble and not available for dephosphorylation by the endogenous small intestine phytase, therefore they move into the large intestine and are excreted as insoluble P (see Figure 1). Consequently, these complexes limit the availability of both Ca and oP. It is assumed that the small intestine phytase activity is fixed and does not change with age, in accordance with Létourneau-Montminy and Narcy (Reference Létourneau-Montminy and Narcy2010). In the absence of suitable pig data, the study of Plumstead et al. (Reference Plumstead, Leytem, Maguire, Spears, Kwanyuen and Brake2008) with broilers was used to quantify the dephosphorylation of oP by endogenous small intestine phytase enzymes using graded dietary Ca levels. Details on the fitting of this empirical relationship are presented in Supplementary material and Supplementary Figure S3.
Létourneau-Montminy et al. (Reference Létourneau-Montminy, Narcy, Lescoat, Magnin, Bernier, Sauvant, Jondreville and Pomar2011) suggested that there is the theoretical creation of calcium–phosphate complexes in the small intestine. However, Luttrell (Reference Luttrell1993) have shown that oP has 11 times greater affinity to Ca than NPP. For this reason, it was decided not to model the formation of Ca phosphate because in any realistic pig diet there will always be enough oP reaching the small intestine to form oP-Ca complexes over calcium phosphate complexes. Thus the majority of NPP which reached the small intestine would be digested into the bloodstream, and could thus overestimate NPP absorption from a diet high in dietary Ca. The insoluble Ca–oP complexes cannot be dephosphorylated by the large intestine microfloral phytase and are excreted as insoluble P (Selle and Ravindran, Reference Selle and Ravindran2008). The main problem with quantifying the dephosphorylation of oP in the large intestine is that one cannot be certain of the actual amount of oP available for dephosphorylation. This is because there are no data in the literature that quantify the amount of Ca–oP complexes that take place in the small intestine.
Studies, such as Sandberg et al. (Reference Sandberg, Larsen and Sandström1993) using ileum cannulated pigs, have measured the oP complexes that exit the small and enter the large intestine, but do not distinguish between the inert Ca–oP complex and oP that enters the large intestine. They then measure the amount of oP going out of the large intestine into the faeces. This empirical relationship was applied in this study and details are presented in the Supplementary material.
Prediction of food intake
There was the need to predict FI (kg/day) in order to estimate the actual P digested as g/day. The model does not assume that the pig increases feed intake when P is a limiting nutrient (Emmans and Kyriazakis, Reference Emmans and Kyriazakis2001), as there is no evidence in the literature that a pig will attempt to eat for a mineral, such as P, when this is the first limiting nutrient in the diet (Pomar et al., Reference Pomar, Jondreville, Dourmad and Bernier2006; Lopes et al., Reference Lopes, Moreira, Kebreab, Vitti, Abdalla, Crompton and France2009), but the FI of the pig may be greatly depressed on diets severely deficient in P (Mahan, Reference Mahan1982; Lopes et al., Reference Lopes, Moreira, Kebreab, Vitti, Abdalla, Crompton and France2009). Following these assumptions, ‘desired’ FI was calculated by dividing the requirement for a digestible feed resource (MJ or g/day) by the digestible protein or net energy content of the diet (MJ or g/kg diet) (Wellock et al., Reference Wellock, Emmans and Kyriazakis2003). The only constrained assumed to operate and stopping the pig from meeting its requirements through FI, was the bulkiness of the feed (Kyriazakis and Emmans, Reference Kyriazakis and Emmans1995), although it appreciated that other constrains may operate in pig systems (Wellock et al., Reference Wellock, Emmans and Kyriazakis2003 and Reference Wellock, Emmans and Kyriazakis2004; Sandberg et al., Reference Sandberg, Emmans and Kyriazakis2007).
Representation of P retention
For a diet first limiting in P and when digested P intake is below P requirements, all dP is assumed to be retained in the body, after maintenance P requirements have been met. Although it is appreciated that endogenous P losses, which constitute a large proportion of the P maintenance requirements, may be a function of FI (Pettey et al., Reference Pettey, Cromwell and Lindemann2006), maintenance P requirements were assumed to be independent of FI.
Emmans and Kyriazakis (Reference Emmans and Kyriazakis2001) suggested that there would be advantages if maintenance requirements for any diet resource were to be expressed as a function of body protein. Following the scaling rules used by Emmans (Reference Emmans1986) the maintenance P requirements were proposed to be:
 $${\rm P}_{{\rm maint}} \,=\,p \cdot \Pr \cdot {\rm Pr}_{{\rm m}}^{{\ \ {\rm {-}0}{\rm .27}}} $$
where Pmaint is maintenance P requirements (g/day), p is a coefficient (g/day) expected to be constant across pig genotypes (Emmans and Kyriazakis, Reference Emmans and Kyriazakis2001), Pr is the pig actual body protein weight (kg) and Prm is its protein content at somatic maturity (kg).The value of p was estimated to be 0.1293 (g/day) from the data of Jongbloed (Reference Jongbloed1987), by making the following assumptions: (i) the relationship between Pr and body weight (BW) is allometric (Whittemore et al., Reference Whittemore, Tullis and Emmans1988) and (ii) the Prm of the crossbred Dutch Landrace×Dutch Yorkshire gilts used was 30 kg (Knap Reference Knap2000). The advantages of equation (2) over existing estimates of Pmaint are that it can be applied across pig sizes and genotypes, and account for genetic change. The dP efficiency of utilization for replenishment of maintenance P requirements (emaint) was equal to unity in accordance to Rodehutscord et al. (Reference Rodehutscord, Haverkamp and Pfeffer1998) and consistent with the estimate of the efficiency of utilisation of other nutrients for maintenance (Sandberg et al., Reference Sandberg, Emmans and Kyriazakis2005).
The efficiency of dP utilization can be calculated from the slope of the regression of net P retention (g/day) against dP intake (g/day) (Pettey et al., Reference Pettey, Cromwell and Lindemann2006). The net efficiency of utilisation of dP for growth (egrowth) may depend on pig size, varying from 0.89 to 0.97 for growing and finishing pigs respectively (Pettey et al., Reference Pettey, Cromwell and Lindemann2006). Because of lack of information, the value of egrowth was assumed to be constant across sexes (NRC, 2012) and constant across pig genotypes at 0.94 in accordance with Rodehutscord et al. (Reference Rodehutscord, Faust and Pfeffer1999); Petersen and Stein (Reference Petersen and Stein2006); Pettey et al. (Reference Pettey, Cromwell and Lindemann2006); NRC (2012).
The rate of whole-body P retention was assumed to relate to whole-body protein mass. From the experiments of Rymarz et al. (Reference Rymarz, Fandrejewski and Kielanowski1982); Jongbloed (Reference Jongbloed1987); Hendriks and Moughan (Reference Hendriks and Moughan1993); and Mahan and Shields (Reference Mahan and Shields1998) which estimated the empty body (EBW) composition of pigs under non limiting conditions, it was found that the relationship between body P and Pr /kg in the EBW was isometric (Supplementary Figure S4):
 $${\rm MaxP}_{{{\rm ret}}} \,=\,k_{2} \cdot \Pr \!{\rm R}$$
where MaxPret is the maximum body P retention (g/day) and k 2 is the isometric coefficient gainer, with a value of 0.0337 and PrR is the protein retention in g/day. The R 2 of the fitted relationship was 0.99 and the RMSE was 0.003. NRC (2012) have also put forward a clear and close relationship between whole-body P mass and whole-body N mass, but suggested that this was allometric (quadratic). All other body components (i.e. water, lipid and ash) were also assumed to relate to whole-body protein (Pr) mass through allometric, for the first two, or isometric relationships for ash (Wellock et al., Reference Wellock, Emmans and Kyriazakis2003).
When the offered diet is first limiting in a nutrient other than P, such as protein, and the pig is fed ad libitum then the isometric relationship between the two body components may be assumed to be preserved. However, under certain circumstances, such as when the pig is offered limiting amounts of an imbalanced diet low in protein but high in P, the P : Pr ratio in the body can increase, indicating that there may be more bone (ash) than protein mass development, and the isometric relationship between P and Pr is disturbed (Kyriazakis and Emmans, Reference Kyriazakis and Emmans1991). The converse can be the case when the pig is offered limited amounts of a diet low in P but high in protein (see equation (4)). In these cases, the P : Pr ratio in the body may decrease as has been shown by Martínez-Ramírez et al. (Reference Martínez-Ramírez, Jeaurond and de Lange2008) and Columbus et al. (Reference Columbus, Niven, Zhu and de Lange2010). These relationships can be expressed as follows:
 $${\rm P}_{{{\rm ret}}} \,=\,\min [({\rm dP}_{{{\rm input}}} {\minus}{\rm P}_{{{\rm maint}}} {\minus}[({\rm dP}_{{{\rm input}}} {\minus}{\rm P}_{{{\rm input}}} ) \cdot (1{\minus}{\rm e}_{{{\rm growth}}} )],\max {\rm P}_{{{\rm ret}}} ]$$
where dPinput is P digested from the lumen to the bloodstream, Pmaint. is dP requirements for maintenance (g/day), maxPret. is the maximum dP retention (g/day), egrowth is the efficiency of dP utilization for growth.
When a pig is given ad libitum access to a balanced food and kept under non-limiting conditions, it is expected to meet its requirements and attain maximum growth. The maximum growth of the pig was defined in accordance with Wellock et al. (Reference Wellock, Emmans and Kyriazakis2003). The individual pig was described by three genetic characteristics: protein weight at maturity (Prm, kg), the ratio of lipid to protein at maturity (Lm/Prm, kg/kg), and a growth rate parameter (B). The initial state of the pig is described by initial BW (BW0, kg) from which the chemical composition of the pig is calculated assuming the pig has its ideal composition set by its genotype. The potential rate of protein retention (PrR, kg/day) is determined by pig genotype and current protein weight only.
Given the arguments above, equation (3) is used to determine the potential P retention. Therefore the requirements of a pig attaining its maximum growth for P were expressed as:
 $${\rm dP}_{{{\rm req}}} ={{{\rm P}_{{{\rm maint}}} } \over {{\rm e}_{{{\rm maint}}} }}\,{\plus}\,{{{\rm MaxP}_{{{\rm ret}}} } \over {{\rm e}_{{{\rm growth}}} }}$$
where dPreq is digestible P requirement (g/day), Pmaint. is dP requirements for maintenance (g/day), emaint is the efficiency of dP utilization for maintenance, MaxPret. is the maximum dP retention (g/day), egrowth is the efficiency of dP utilization for growth.
Estimation of soluble and insoluble P excretion
Indigestible P excreted in the faeces is in soluble and insoluble forms. P digested but not utilized, for example when P is supplied above P requirements, is excreted in the urine and is assumed to be in soluble form (Kirchmann and Pettersson, Reference Kirchmann and Pettersson1995). The latter represents the highest potential risk for losses by runoff in agricultural fields (Maguire et al., Reference Maguire, Dou, Sims, Brake and Joern2005). The model was able to distinguish between these two different forms of P excreted.
The insoluble P is only found in the faeces and is composed of oP (mainly in IP6, but also IP3–IP5 forms) and any divalent cation complexes (Selle et al., Reference Selle, Ravindran, Cowieson and Bedford2011; Mukhametzyanova et al., Reference Mukhametzyanova, Akhmetova and Sharipova2012). Soluble P excretion originates from urinary P excretion, and contains a fraction of soluble P excreted in the faeces, see equation (6). The faecal soluble P excretion results from the inefficiency of absorption of NPP into the blood-stream and originates from dietary and dephosphorylated NPP as well as endogenous P excretion.
P excreted in the urine comprises of the inefficiency of dP utilization and any dP which exceeds the dP requirements. The pig does not have any biological process to store excess dP (Ekpe et al., Reference Ekpe, Zijlstra and Patience2002), thus dP intakes which exceed requirements are excreted through the urine as soluble P:
 $$\eqalignno{{\rm sP}_{{{\rm losses}}} \,{\rm =}\,{\rm P}_{{{\rm maint}}} \,{\rm {\plus}}\,{\rm NPP}_{{{\rm indig}}} \,{\rm {\plus}}\,{\rm inefP}_{{{\rm ret}}} \, \cr {\rm {\plus}}\,{\rm max[(dP}_{{{\rm intake}}} \,{\rm {\plus}}\,{\rm dP}_{{{\rm req}}} ),0]$$
where sPlosses are the soluble P losses (g/day), Pmaint are the maintenance P losses (g/day), NPPindig are the P losses of the inefficiency of NPP absorption from the gastrointestinal lumen into the bloodstream being set at 0.2 of the NPP in the digesta (g/day), inefPret are the P losses because of the inefficiency of digestible P utilization being set at 0.1 of all the P that has been absorbed by the lumen of the small intestine into the blood-stream (g/day), dPintake is the digestible P available for retention, and dPreq is the digestible P requirements.
Running the model
The model is capable of predictions over both the grower and finisher periods. The model was run over a daily time step using the list of inputs (Table 1) from a start BW, until a target BW was reached. At the end of each day the gains of each of the four chemical components (Pr, L, ash, including P and water) achieved were added to the current mass of the four body components to give the new current composition of EBW and hence BW (Wellock et al., Reference Wellock, Emmans and Kyriazakis2003).
Investigating model behaviour
The model was used to investigate its predictions over a range of diet and pig genotypes; this is equivalent to assessing model behaviour. The default values used for the model were a certain kind of pig given ad libitum access to a standard diet, and the pig was assumed to grow over the period of 30 to 60 kg BW. The default pig genotype used was characterized by BSAS (2003) as being of ‘intermediate growth’ with 40 kg protein at maturity (Prm), 48 kg lipid at maturity (Lm) and 0.01175 per day growth parameter (B), which roughly represents the current pig genotypes (LW×L) used in commercial units in the United Kingdom. The ‘standard’ diet used by the UK pig Industry, had the following analysed chemical composition: 9.6 MJ net energy/kg, 172.5 g CP/kg, 11.07 g lysine/kg, 5.19 g total Ca/kg and 4.29 g tP/kg of feed as fed. The dietary tP consisted of 2.47 g oP/kg and 1.82 g NPP/kg diet. The default diet consisted of wheat − 600 g/kg, barley − 110 g/kg, rapeseed meal − 80 g/kg, soya bean meal − 77 g/kg and sunflower meal – 50 g/kg fresh diet. The incorporation of wheat made the diet high in plant phytase at 480 FTU/kg, but the feed was assumed to be pelleted. In addition, the diet was supplemented with an extra 750 FTU E. coli microbial phytase according to industry recommendations. The diet was assumed to be abundant in vitamin D. The level of total Ca in the diet was slightly lower than BSAS (2003) recommendations and reflected the concerns of the Industry over the recommended level.
Model outputs were produced for the following variations in the default diet to investigate model behaviour: (1) different levels of microbial E. coli phytase supplemented to the diet; (2) different total Ca levels in the diet; and (3) different NPP : oP ratios in the diet. In addition the model was used to investigate the effect of different pig genotypes on the dP requirements for both growing and finishing pigs. The outputs of the model predicted were: FI, tP input, digested and retained P, and hence soluble and insoluble P excretion.
Given the curvilinear relationship of oP dephosphorylation with phytase a greater number of lower levels of phytase inclusions were considered, rather than high ones. The NRC (2012) and BSAS (2003) suggest the optimum total Ca:dP ratio in the pig diet to be 2.6 and 2.8, respectively. In reality however, the optimal total Ca : dP depends on the actual digestible P in the diet. A wide range of total dietary Ca was investigated: from 2 g/kg diet, which is the dietary Ca contributed from the feed ingredients, to 11 g/kg diet when there is the supplementation of Ca carbonate to the diet.
In the past, diets have been formulated on tP basis. However a diet which contains the same tP concentration can result in completely different P digestibility. Phytate and NPP contents of the diet are the single most important factors to take into account when formulating a diet. A wide range of NPP : oP ratios were tested in order to find the highest P retention and lowest P excretion for a diet with a 4.29 g/kg tP; the lowest ratio tested was 0.4 as conventional diets do not go below this level.
The effect of genotype on model outputs was investigated by using genotypes characterized by BSAS (2003) as: ‘Commercial growth’ with 30 kg Prm, 39 kg Lm, 0.011 B; and ‘Fast growth’ with 50 kg Prm, 55 kg Lm, 0.0125 B, in addition to the default genotype of ‘Intermediate growth’. Over the BW range considered the three genotypes have an average growth rate of 0.67, 0.97 and 1.25 kg/day, respectively.
Results
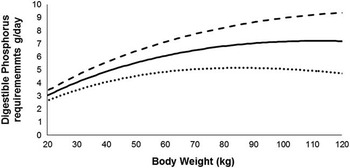
Outputs for the P requirements of pigs of different genotypes are given in Figure 2. As expected pigs with higher growth characteristics had higher requirements for dP at any stage of their growth. The maximum dP requirement was: 5.16 g/day at 79 kg, 7.22 g/day at 103 kg and 9.47 g/day dP at 120 kg BW, for the commercial, intermediate and fast growth potential genotypes, respectively.
The digestible P requirements of three pig genotypes as defined by BSAS (2003). The ‘lean’ (––), ‘intermediate’ (—) and ‘commercial’ (---) pig genotypes have: 0.0125, 0.01175 and 0.011 growth rate parameter (B, day−1) 50, 40 and 30 mature protein mass (Prm, kg) and 55, 48 and 39 mature lipid mass (Lm, kg), respectively.

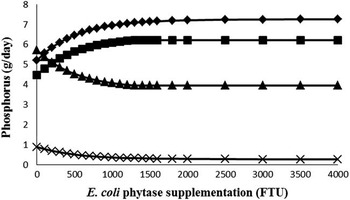
Increasing the phytase content of the diet increased the P digestibility and retention. For example adding 500 FTU phytase increased the P digestion form about 5 g/day to about 6 g/day (Figure 3). The response was curvilinear, and P retained reached a constant maximum rate at ~1000 FTU, earlier than the maximum P digested rate achieved, at ~2500 FTU. Phytate dephosphorylation did not take place beyond supplementation with 2500 FTU phytase. Any additional supplementation of phytase beyond 1000 FTU, resulted in an increase in soluble P excretion, because the dP requirements had been met and the excess dP was excreted through the urinary tract. This implies that the diet used was first limiting in dP, up to the level of inclusion of 1000 FTU E. coli. Therefore the optimal level of E. coli inclusion for this diet and specific genotype was 1000 FTU.
The effect of microbial Escherichia coli phytase supplementation on digestible (♦) and retained (■) phosphorus and hence total (▲) and insoluble P (x) excretion (g/day) for a typical UK commercial diet, containing 5.19 g/kg total Ca and 4.29 g/kg total P, separated into 2.48 g/kg phytate and 1.81 g/kg non-phytate P. The diet also contained a 480 FTU plant phytase. Pigs of an ‘Intermediate’ BSAS (2003) genotype were simulated to grow from 30 to 60 kg BW.

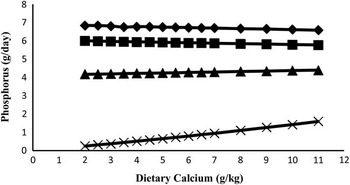
Increasing the level of dietary Ca supplementation while keeping the rest of the diet composition constant, resulted in a decrease in P digestibility and retention (Figure 4). There was also an increase in insoluble P excretion, which resulted in a decrease by the same amount in soluble P excretion. This was the result of the formation of insoluble Ca–oP complexes in the small and large intestine. It is important to note, that even at the very low dietary Ca levels, when the digestibility of P was at its highest level, the dP intake was not enough to meet pig requirements. The maximum dP intake achieved was 6.84 g/day, while dP requirements were 7.08 g/day for this pig genotype. The simulations should be used with caution, as the P digestibility would be even lower than currently predicted at high dietary Ca, as the supplemented Ca will increase the pH of the stomach and create more Ca–oP complexes. The model does not currently account for such a pH effect. Another feature not included in the current version of the model is the possible reduction of P retention under low levels of dietary Ca. This will be discussed in detail below.
The effect of total dietary calcium on digestible (♦) and retained (■) phosphorus (P) and hence total (▲) and insoluble (x) P excretion (g/day) for a typical UK commercial diet, supplemented with 750 FTU/kg diet Escherichia coli phytase, containing 4.29 g/kg total P, separated into 2.48 g/kg phytate and 1.81 g/kg non-phytate P. The diet also contained 480 FTU plant phytase. Pigs of an ‘Intermediate’ BSAS (2003) genotype, were simulated to grow from 30 to 60 kg BW.

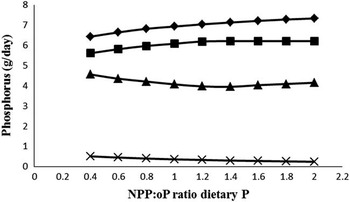
A diet containing a constant total P level at 4.29 g/kg, but containing a lower NPP : oP ratio (i.e. is high in oP), resulted in a lower dP and hence retained P, while there was a higher P excretion and most notably oP excretion (see Figure 5). The lower digestible P level was due to the limited dephosphorylation by phytase enzymes. Pig requirements were met at a ratio of 1.2 : 1 NPP : oP. This implies that for the default diet used that contained 4.29 total P g/kg, 2.47 g oP/kg and 1.82 g NNP/kg, an additional 0.52 g NPP/kg diet would be needed to meet the requirements of the default genotype. This could be achieved by the supplementation of either phosphate salts or exogenous phytase enzymes. Increasing the NPP : oP ratio beyond 1.2 did not have an effect on P retention, while the dP increased caused more soluble P excreted through the urinary tract.
The effect of the dietary non-phytate phosphorus: phytate ratio (NPP : oP) on digestible (♦) and retained (■) phosphorus (P) and hence total (▲) and insoluble (x) P excretion (g/day) for a typical UK commercial diet, supplemented with 750 FTU/kg diet Escherichia coli phytase, containing 5.19 g/kg total Ca and 4.29 g/kg total P. The diet also contained a 480 FTU plant phytase. Pigs of an ‘Intermediate’ BSAS (2003) pig genotype, were simulated to grow from 30 to 60 kg BW.

Discussion
Here we address some of the assumptions underlying the model equations, the value of their parameters and their consequences on its predictions. The model is fully tested and evaluated in the companion paper (Symeou et al., Reference Symeou, Leinonen and Kyriazakis2014). Currently there are three simulation models that deal with different aspects of P digestion and/or metabolism in the pig. The models of Fernández (Reference Fernández1995) and Dias et al. (Reference Dias, Lopez, Moreira, Schulin-Zeuthen, Vitti, Kebreab and France2010) deal with P kinetics in the body of pigs and are based on radioactive Ca and P flows, whereas the model of Létourneau-Montminy et al. (Reference Létourneau-Montminy, Narcy, Lescoat, Magnin, Bernier, Sauvant, Jondreville and Pomar2011) deals with the fate of P intake in the digestive tract of growing pigs. Our model differs from these in several aspects including: (1) the ability to predict P intake, rather than dealing with P intake as an input (Fernández, Reference Fernández1995; Dias et al., Reference Dias, Lopez, Moreira, Schulin-Zeuthen, Vitti, Kebreab and France2010) or dealing with it in an empirical manner of (Létourneau-Montminy et al., Reference Létourneau-Montminy, Narcy, Lescoat, Magnin, Bernier, Sauvant, Jondreville and Pomar2011). This was achieved by the model being able to predict the food intake of pigs of different genotypes. (2) The ability to predict the fate of P in the digestive tract of pigs of different genotypes, given access to foods of different compositions. In principle, the model of Dias et al. (Reference Dias, Lopez, Moreira, Schulin-Zeuthen, Vitti, Kebreab and France2010) may be adapted to account for the consequences of P intake for different pig genotypes, although this is not made explicit by its authors. (3) A link made between P retention and the retention of other components of the body, such as protein, through isometric or allometric relationships. This is consistent with the suggestion made by NRC (2012). (4) The separate prediction of soluble and insoluble forms of P excreted in the faeces and urine of the pig, although Fernández (Reference Fernández1995) and Dias et al. (Reference Dias, Lopez, Moreira, Schulin-Zeuthen, Vitti, Kebreab and France2010) deal with the P excreted in the faeces and urine but not the form of P excreted.
In terms of model parameterisation, there is a significant difference between the parameter values assumed by the current model and those by the model of Létourneau-Montminy et al. (Reference Létourneau-Montminy, Narcy, Lescoat, Magnin, Bernier, Sauvant, Jondreville and Pomar2011). The latter assume that P is absorbed to the blood plasma according to both active and passive mechanisms of the gastrointestinal system. The model developed in this paper adopted a constant digestibility coefficient of 0.8, consistent with the suggestions of Jongbloed (Reference Jongbloed1987), thus ignoring any active P digestion that may occur at very low dietary P diets (Breves and Schröder, Reference Breves and Schröder1991; Fernández Reference Fernández1995). The insignificance of active P digestion is supported by the study of Schulin-Zeuthen et al. (Reference Schulin-Zeuthen, Kebreab, Gerrits, Lopez, Fan, Dias and France2007) and the meta-analysis of Létourneau-Montminy et al. (Reference Létourneau-Montminy, Jondreville, Sauvant and Narcy2012) who found that the flow of P from gut to blood was linear for a wide range of dietary P intakes. The latter estimated the P digestibility to be a constant coefficient of 0.8 for inorganic P. The passive flow of NPP from the lumen to the blood-stream is also backed up by the review of France et al. (Reference France, Dias, Kebreab, Vitti, Crompton and Lopez2010) who concluded that in pigs, there is little regulation of P digested from the lumen into the bloodstream, therefore emphasising the importance of the renal activity in regulating the P in the blood. It can be concluded that while there may be a higher digestibility due to active transport mechanisms in very low P diets, such P levels are outside the bounds of commercial pig diets.
We used first-order kinetics equations to describe the relationship of oP dephosphorylation with microbial and plant phytase enzymes (equation (1)). These equations are consistent with the Michaelis-Menten kinetics, in terms of the response to different enzyme levels, when the substrate level is not very high. One benefit of the applied functions is also that they allow the determinations of the maximum proportion of the phytate that can be dephosphorylated by a given enzyme, that is the total amount of the ‘reactive’ phytate. However, it should be noted that there are limitations in the applicability of equations, which have been derived empirically. In the companion paper (Symeou et al., Reference Symeou, Leinonen and Kyriazakis2014) it is demonstrated that the ability of the model to predict the response to phytase depends on the composition of the diet and thus on the amount of the ‘reactive’ phytate in diet as opposite to the total phytate content. Developing more general functions for enzyme kinetics will be a subject for future work when more relevant data becomes available.
Although there is experimental evidence that the pH of the gastrointestinal tract causes changes in the oP solubility, as well as phytase activity (Selle and Ravindran, Reference Selle and Ravindran2008), trying to simulate diurnal changes in pH of the gastrointestinal system and especially the stomach, is a complex process. For example, in order to simulate diurnal changes in stomach pH, which in turn will affect P digestion, one would need to simulate diurnal patterns of FI and even simulate the effects of anticipatory feeding behaviour in pigs. Currently there are no available models that predict successfully the food intake of pigs at time scales shorter than a day (Black, Reference Black2009). Létourneau-Montminy et al. (Reference Létourneau-Montminy, Narcy, Lescoat, Magnin, Bernier, Sauvant, Jondreville and Pomar2011) attempted to simulate the change of the stomach pH making assumptions about the diurnal patterns of FI. We decided to ignore the effect of stomach pH in the current model and to assume that no Ca–phytate complexes were formed there. The consequence of this could be an over-estimation of P retention and under-estimation of P excreted at elevated dietary Ca levels. The dietary Ca acts as an acid buffer, causing the stomach pH to increase thus decreasing the oP solubility available for dephosphorylation by phytase enzymes, while phytase activity also decreases (Selle and Ravindran, Reference Selle and Ravindran2008).
The model assumes that there is a linear relationship between dietary Ca and proportion of phytate dephosphorylation in the small intestine. This has the consequence that on diets non-limiting in dP an increase in dietary Ca will not change the rate of P retained, although it will change the ratio of soluble: insoluble P excreted. However, we appreciate that the same principle may not apply when a diet low in Ca is supplemented with Ca (Larsen et al., Reference Larsen, Fernández and Engberg2000). There is some empirical evidence that when Ca is limiting, increasing its amount in diet would improve the P retention. For example Poulsen et al. (Reference Poulsen, Carlson, Nørgaard and Blaabjerg2010) found increased P utilization with increasing dietary Ca in diets with phytase addition. They concluded that diets with inadequate amount of Ca result in reduction of P utilization, as such diets are not able to support the co-deposition of P and Ca. This would also affect the amount of P excretion. Similar effect was found in an earlier study by Vipperman et al. (Reference Vipperman, Peo and Cunningham1974), where a significant interaction between calcium and P was observed for P digestibility and retention.
In the current version of the model, the missing interaction between Ca and P retention limits the use of the model when applied with diets that are limiting in Ca. This limitation is also demonstrated by some of the comparisons with experimental data presented in the companion paper (Symeou et al., Reference Symeou, Leinonen and Kyriazakis2014). This is clearly one of the topics where further model development is needed and for this purpose more systematic, empirical data on Ca metabolism should be generated. However, it should be noted that currently the industry is concerned with the oversupply as opposed the undersupply of Ca in pig diets.
An important assumption in the model was that the efficiency of dP utilization for growth was independent of pig size, which is in agreement with NRC (2012). This is inconsistent with the study of Pettey et al. (Reference Pettey, Cromwell and Lindemann2006), who suggested that the efficiency varies between 0.97 and 0.89 for smaller and larger pigs, respectively. The suggested decline of egrowth with pig size is in contrast with the findings of Kemme et al. (Reference Kemme, Jongbloed, Mroz and Beynen1997), who have shown exactly the opposite. There are other estimates of egrowth in the literature (Schulin-Zeuthen et al., Reference Schulin-Zeuthen, Kebreab, Gerrits, Lopez, Fan, Dias and France2007), suggesting that its value is much lower closer to 0.7. As the latter value was estimated from data meta-analysis, it is likely that it includes estimates of both gross and net efficiency. The above inconsistencies in the literature do not allow for systematic conclusions to be drawn on the effect of pig size on the efficiency of P utilisation above maintenance. These inconsistencies cause a source of uncertainty in the models outputs, with 9% and 3% change in the P retained when the efficiency of dP utilization for growth changed to 0.98 and 0.87, respectively (Symeou et al., Reference Symeou, Leinonen and Kyriazakis2014). Due to the mechanistic nature P utilization by the model, the model has the potential to be converted to account for a different efficiency of dP utilization for growth. We have further assumed that the value of egrowth would be constant across genotypes and sexes in analogy to what has been suggested by Sandberg et al. (Reference Sandberg, Emmans and Kyriazakis2005) for the net efficiency of protein utilization in pigs. Again this assumption has yet to be addressed directly in the literature (Kyriazakis, Reference Kyriazakis2011).
The model links P retention to the retention of body protein and hence to current protein mass, at any stage of growth, through simple allometric or isometric relationships. In addition, digestible P requirements both for maintenance and maximum retention are also functions of protein mass. Our approach has several advantages, including the description of the genotype in simple terms described by Emmans and Kyriazakis, (Reference Emmans and Kyriazakis2001) and applied to pigs by Wellock et al. (Reference Wellock, Emmans and Kyriazakis2003). We appreciate that there would be certain dietary conditions, when the allometric or isometric relationships between body P and another body components will be disturbed, as discussed above.
The current model and that of Létourneau-Montminy et al. (Reference Létourneau-Montminy, Narcy, Lescoat, Magnin, Bernier, Sauvant, Jondreville and Pomar2011) are the only ones able to predict the different forms of P excreted from the ileum to the large intestine. Our model also predicts the fate of the oP and NPP in the large intestine, thus it is able to predict the different forms of P excretion in the faeces. Létourneau-Montminy et al. (Reference Létourneau-Montminy, Narcy, Lescoat, Magnin, Bernier, Sauvant, Jondreville and Pomar2011) used data on phytate ingestion to add three sub-flows from the gastro-intestinal system to blood, representing inorganic P, dietary phytate P and dietary NPP. P excreted in faeces was apportioned similarly. The approach followed in our model is similar, but we have taken it a step further and expanded it by considering the fate of the undigested P in the large intestine. By doing so the total soluble and insoluble P excreted could be predicted, as the quantification of the fate of undigested P in the large intestine made the predictions of P excretion more accurate. Literature (Sandberg et al., Reference Sandberg, Larsen and Sandström1993) clearly suggests that the microflora of the large intestine plays a significant role in the degradation of oP and the solubilization of P excreted and that this is affected by dietary Ca that reaches the large intestine. High dietary Ca from supplemental calcium carbonate increased colonic pH, which in turn reduces the degradation of phytate in the colon (Sandberg et al., Reference Sandberg, Larsen and Sandström1993). The ability of the model to predict P excreted into soluble and insoluble P makes it a valuable tool in formulating diets that minimize the excretion of soluble P, rather than just total P. Soluble P is of higher contributor to eutrophication, rather than the relatively inert insoluble P in the form of oP and its complexes.
Conclusion
A dynamic, deterministic model has been developed to account for the different forms of P in a pig diet and their fate through the gastrointestinal tract. The model is able to predict the intake, digestion, retention and ultimately P excretion in pigs offered access to diets of different compositions and account for the different form of P excreted. The model also takes into account the effect of pig genotype on maximum P retention and is the first of its kind in being able to predict P intake of pigs of different genotypes offered access to feeds of different composition. Some of the uncertainties associated with the assumptions made and the values of the model parameters have been discussed above. A companion paper Symeou et al. (Reference Symeou, Leinonen and Kyriazakis2014) deals with model evaluation, by comparing how well the model is able to predict the outcomes of experiments that deal with the issue of P retention and excretion.
Acknowledgements
The authors are grateful to the British Pig Executive (BPEX), a division of the Agriculture and Horticulture Development Board, for funding this project.