I. INTRODUCTION
Titanium dioxide (TiO2) as anode material for Li-ion batteries has been found to be very alluring because of its open crystal structure and flexible electronic structure of titanium ion. Recently, nanostructured titania has obtained tremendous attention owing to its unique physicochemical properties.Reference Wagemaker, Kentgens and Mulder1–Reference Kasuga, Hiramatsu, Hoson, Sekino and Niihara5 However, the electrochemical performance of TiO2 at high rates is still poor due to its intrinsic poor electron transport.Reference Liu, Fu, Zhang, Gao, Li, Wu and Wu6 To obtain a large reversible capacity and a good rate capability, various methods have been adopted by coupling TiO2 with other materials,Reference Sainsbury and Fitzmaurice7, Reference Gomathi, Vivekchand, Govindaraj and Rao8 such as coating carbon or graphene on TiO2 particles,Reference Yoon, Ka, Lee, Park and Oh9, Reference Lambert, Chavez, Hernandez-Sanchez, Lu, Bell, Ambrosini, Friedman, Boyle, Wheeler and Huber10 loading Ag on ordered TiO2 nanotube,Reference Fang, Huang, Liu and Li11 or by synthesizing TiO2 with various nanostructures.Reference Kim, Han, Kim, Gwon, Moon, Kang, Kim and Kang12, Reference Yoshida, Suzuki and Yoshikawa13
The carbon-based materials are considered as best choice as the matrices to form TiO2-based composites, among which carbon nanotubes (CNTs) have received special interest due to its facile fabrication and high electronic conductivity.Reference Kavan, Bacsa, Tunckol, Serp, Zakeeruddin, Formal, Zukalova and Graetzel14–Reference Cao, Guo, Zheng, Wu, Jiang, Bi, Wan and Maier16 In addition, CNTs can also contribute to the overall capacity of the composites. The improvement in electrochemical performance has been realized in some composites such as MnO2/CNTs,Reference Reddy, Shaijumon, Gowda and Ajayan17, Reference Reddy, Shaijumon, Gowda and Ajayan18 SnO2/CNTs,Reference Chen, Zhu and Wang19 NiO/CNTs,Reference Lin, She, Hong, Liu, Shi, Shi, Zheng and Dong20 and V2O5/CNTs.Reference Chen, Augustyn, Wen, Zhang, Shen, Dunn and Lu21, Reference Jayalakshmi, Rao, Venugopal and Kim22 CNTs were also used as matrices to form composites with TiO2, leading to the improved electrochemical performance of TiO2.Reference Huang, Zhang, Gan, Wang and Zhang23, Reference Shen, You, Park, Jiang, Guo, Chen and Wang24 However, in the above work, the CNTs were introduced into TiO2 by an ex situ route, namely, the CNTs were presynthesized before adding to the TiO2.
Iron or iron compounds are commonly used as catalysts in the growth of CNTs. In this work, we proposed a facile in situ chemical vapor deposition (CVD) route in N2/C2H2 to synthesize TiO2/CNTs nanocomposite using hydrothermally treated TiO2 and Fe(NO3)3 as the starting materials. This method is adopted for the first time for the in situ growth of TiO2/CNTs composite. The content of Fe(NO3)3 in the starting materials is well controlled so as to grow CNTs with a reasonable amount and to minimize the effect of residual Fe on the electrochemical performance of the final product TiO2/CNTs. In the above experiment method, the hydrothermal treatment was used to increase the specific surface area of TiO2.Reference Kasuga, Hiramatsu, Hoson, Sekino and Niihara25–Reference Yoshida, Suzuki and Yoshikawa28 The in situ prepared TiO2/CNT product shows better electrochemical performance than the pristine spherical TiO2 (S-TiO2), the hydrothermal product, TiO2 nanotubes (NT-TiO2), and the TiO2/C prepared by the ex situ route.
II. EXPERIMENTAL
A. Synthesis of NT-TiO2 by hydrothermal method
In a typical preparation of NT-TiO2, 0.5 g of S-TiO2 (Alfa Aesar, Hertfordshire, U.K.) was added into 50 mL of NaOH aqueous solution (10 mol·L−1) with stirring to form a suspension. After sonication for 30 min, the suspension was transferred into a Teflon-lined stainless steel autoclave (100 mL) and maintained at 170 °C for 72 h. After cooling to room temperature naturally, the resulting precipitate was collected and rinsed with distilled water until pH <8. Then, the precipitate was put into HCl aqueous solution (pH = 2) and magnetically stirred for 24 h. After the HCl treatment for three times, the precipitate was filtered and thoroughly washed with distilled water and dried in a freeze drier. NT-TiO2 was obtained by heating the above product at 400 °C for 2 h in air.
B. Synthesis of TiO2/CNTs nanocomposite
NT-TiO2 and Fe(NO3)3·9H2O in a molar ratio of 97:3 were mixed and ground in an agate mortar. 0.1 g of the mixture was put into distilled water and stirred for 1 h. Ammonia was then added slowly to the above solution under magnetic stirring for 2 h to accelerate the hydrolysis of ferric nitrate. A powder sample was obtained after the evaporation of the solvent by heating the solution at 60 °C. The powder was transferred to an alumina boat placed in the center of a horizontal tube furnace. The procedure for the solid phase reaction is as follows: first, the powder is heated from room temperature to 500 °C at a heating rate of 20 °C·min−1 in flowing N2/C2H2 (10:3 in volume) with a flow rate of 50 cm3·min−1; second, the temperature is maintained for 1 h in flowing N2/C2H2; third, the furnace was cooled down to room temperature under flowing N2; finally, to remove the residual iron or ferric compound, the powder was centrifuged sequentially with HCl aqueous solution (pH = 2) and distilled water, then dried in a freeze drier. The final product is named as TiO2/CNTs. For comparison, CVD reactions were also performed on S-TiO2/Fe(NO3)3·9H2O (molar ratio 97:3) under the same conditions to produce the S-TiO2/CNTs composite.
C. Characterization of structure and physical parameters of the products
The crystal structure of as-prepared products was characterized by powder x-ray diffraction (XRD) on a Rigaku D/Max-2550PC powder diffractometer (Rigaku Industrial Corporation, Osaka, Japan) equipped with Cu Kα radiation (λ = 0.1541 nm). The morphologies of the products were observed by field emission scanning electron microscopy on a FEI-Sirion microscope (Hitachi High Technologies America, Inc., Pleasanton, CA), transmission electron microscopy (TEM), and high-resolution transmission electron microscopy (HRTEM) on a JEM 2100F microscope (JEOL, Ltd., Tokyo, Japan). The Raman spectrum was recorded on a Labor Raman HR-800 (514.5 nm; HORIBA Jobin Yvon Ltd., Paris, France). The Brunauer–Emmett–Teller (BET) specific surface areas of the samples were determined through nitrogen adsorption/desorption isotherms on an AUTOSORB-1-C apparatus. The carbon content was measured on a Flash EA 1112 tester.
D. Electrochemical measurements
The electrochemical performance of the active materials (S-TiO2, NT-TiO2, and TiO2/CNTs) was evaluated with coin-type cells (CR 2025). The working electrode was made by compressing a mixture of 80 wt% active material, 10 wt% acetylene black, and 10 wt% polyvinylidene fluoride binder. The loading of the active mass of the working electrode is about 5 mg. The cells were assembled in an argon-filled glove box using metallic Li foil as the counter electrode, 1 M LiPF6 in ethylene carbonate–dimethyl carbonate (1:1 in volume) as the electrolyte, and a polypropylene microporous film (Celgard 2300, Celgard LLC Corporate, Charlotte, NC) as the separator. The galvanostatic charge–discharge tests were conducted on a Neware BTS-5V10mA series (Shenzhen, Guangdong, China) over a potential range of 1.0–3.0 V (versus Li/Li+) at various current densities. The cyclic voltammetry (CV) measurements were performed between 1.0 and 3.0 V at a scan rate of 0.1 mV·s−1 on Arbin-001 MITS 2.9-BT2000 (Arbin Corporation, College Station, TX). Electrochemical impedance spectroscopy (EIS) measurements were conducted on a CHI660C electrochemical workstation by adopting an alternating current voltage of 5-mV amplitude over the frequency range from 0.01 to 105 Hz. The EIS was measured at the stable voltage of 1.7 V.
III. RESULTS AND DISCUSSION
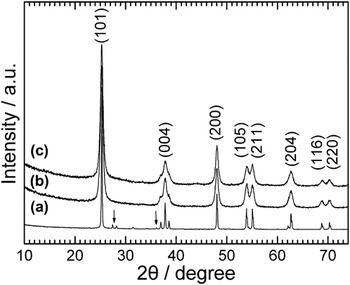
Figure 1 shows the XRD patterns of the three samples. All the samples can be indexed to anatase TiO2 (JCPDS file No. 21-1272). For the starting material (S-TiO2), a small amount of rutile TiO2 was also detected as indicated by the arrows [see Fig. 1(a)]. After heat treatment, the rutile TiO2 was converted to anatase TiO2 [Figs. 1(b) and 1(c)]. Note that compared with those of the S-TiO2 sample, the diffraction peaks of both the NT-TiO2 and TiO2/CNTs samples become broader, caused possibly by the reduced crystallization of TiO2 during the hydrothermal process.
X-ray diffraction patterns of (a) spherical TiO2 (S-TiO2), (b) TiO2 nanotubes (NT-TiO2), and (c) TiO2/carbon nanotubes (TiO2/CNTs).

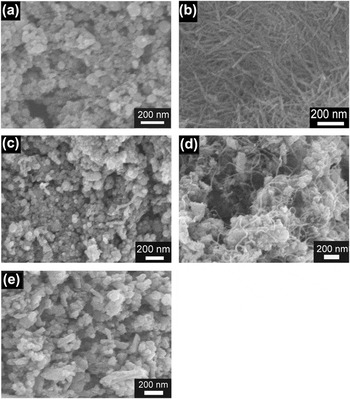
Figure 2 shows the scanning electron microscopic images of the five samples. The raw material S-TiO2 is composed of spherical nanoparticles with a diameter of 30–80 nm [Fig. 2(a)]. After hydrothermal and heat treatment at 400 °C in air, the nanoparticles were transformed into one-dimensional (1D) structured TiO2 with an average diameter of about 25 nm and a length ranging from 300 to 500 nm [Fig. 2(b)]. For S-TiO2/Fe(NO3)3, after CVD reactions at 500 °C for 1 h under N2/C2H2, 1D structured material appears as seen in Fig. 2(c). However, the amount of the 1D material is rather low. For NT-TiO2/Fe(NO3)3, after the same CVD reactions, the 1D structure of TiO2 was destroyed with the formation of another kind of 1D material which homogenously entangle the TiO2 particles as shown in Fig. 2(d). The breaking of NT-TiO2 during the CVD process is confirmed by a separate experiment where Fe(NO3)3 was not introduced [Fig. 2(e)], which shows the pure NT-TiO2 had destroyed after heat treatment in N2/C2H2 atmosphere, proving that the new 1D material in Fig. 2(d) was not NT-TiO2 itself. It is suggested that Fe2O3 [from Fe(NO3)3] loaded on the NT-TiO2 with a large specific area facilitates the catalytic growth of CNTs.
Scanning electron microscopic images of (a) S-TiO2, (b) NT-TiO2, (c) chemical vapor deposition (CVD)-treated S-TiO2/Fe(NO3)3, (d) CVD-treated NT-TiO2/Fe(NO3)3, and (e) CVD-treated NT-TiO2.

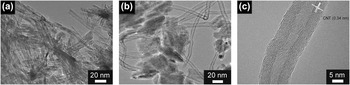
Figure 3 shows the TEM images of NT-TiO2 and TiO2/CNTs. The tube-like structure of TiO2 can be clearly seen with a wall thickness of around 3 nm [Fig. 3(a)]. After heat treatment, the tubular structure disappears with the formation of aggregations shown in Fig. 3(b). The aggregated TiO2 particles are bridged uniformly by CNTs with a diameter of around 12 nm and a wall thickness of 3 nm. It seems that the TiO2 particles can be connected by CNTs firmly because of this in situ preparation route. A HRTEM image of CNTs in the TiO2/CNTs composite is shown in Fig. 3(c). It is clear that the CNTs are multiwalled with an interlayer spacing of 0.34 nm, corresponding to the (002) plane of graphitic carbon lattice.
Transmission electron microscopic images of (a) NT-TiO2 and (b) TiO2/CNTs; (c) high-resolution transmission electron microscopic image of an individual CNT in the TiO2/CNTs composite.

The BET specific surface areas of the three samples were determined by a nitrogen adsorption method. The BET specific surface areas of S-TiO2, NT-TiO2, and TiO2/CNTs are 37.8, 186.1, and 98.6 m2·g−1, respectively. Note that the TiO2/CNTs sample shows an obviously lower specific surface area compared with the NT-TiO2 sample due to the aggregation of the particles. Nevertheless, after the hydrothermal and calcination treatments, the NT-TiO2 composite exhibits an obvious increase in the specific surface area compared with S-TiO2.
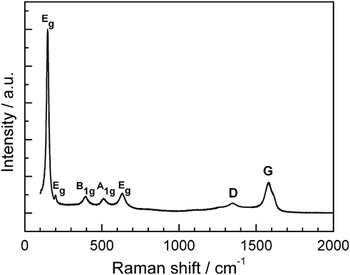
Figure 4 gives the Raman spectrum of the TiO2/CNTs composite. Five vibration peaks are observed at 100–700 cm−1, corresponding to the Eg, Eg, B1g, A1g, and Eg active modes, respectively, of the tetragonal anatase.Reference Eder and Windle15 The band at 1346 cm−1 (D band) is related to the disorder features due to the finite particle size effect or lattice distortion of the graphite crystals, whereas the band at 1580 cm−1 (G band) is related to the vibration of sp2-bonded carbon atoms in a two-dimensional hexagonal lattice.Reference Zhang, Du, Qian and Xiong29 Obviously, the intensity of G band is much higher than that of D band, which indicates a relatively good crystallinity.Reference Carrion, Espejo, Sanes and Bermudez30 Carbon content analysis shows that the TiO2/CNTs composite has a carbon content of 25.5 wt%.
Raman spectrum of TiO2/CNTs.

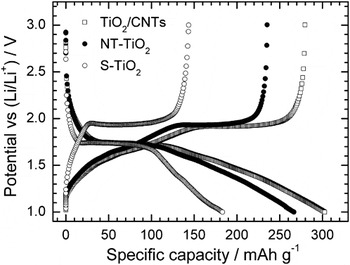
Figure 5 shows the first charge–discharge curves of the three samples S-TiO2, NT-TiO2, and TiO2/CNTs at a current density of 50 mA·g−1. It can be seen that all the samples exhibit similar charge–discharge plateaus, indicating that the morphology and/or carbon incorporation exert minor effect on the electrochemical lithiation mechanism of TiO2. The plateaus are associated with the phase transition between the tetragonal (anatase TiO2) and orthorhombic (LixTiO2) phase.Reference Qiu, Yan, Yang, Jin, Deng and Li31, Reference Wang, Choi, Li, Yang, Nie, Kou, Hu, Wang, Saraf, Zhang, Aksay and Liu32 Clearly, TiO2/CNTs and NT-TiO2 give a higher capacity than S-TiO2, likely due to the increased specific surface area. For the TiO2/CNTs sample, the first charge (delithiation) and discharge (lithiation) capacities reach 280 and 304 mAh·g−1, respectively, which are greatly higher than those of S-TiO2. Because the capacity of CNTs is higher than that of TiO2, the capacity of the TiO2/CNTs composite is not comparable with that of bare TiO2. Therefore, the specific capacities of TiO2/CNTs we calculated here were based on the mass of TiO2 in the composite.
First charge and discharge curves of S-TiO2, NT-TiO2, and TiO2/CNTs at 50 mA·g−1.

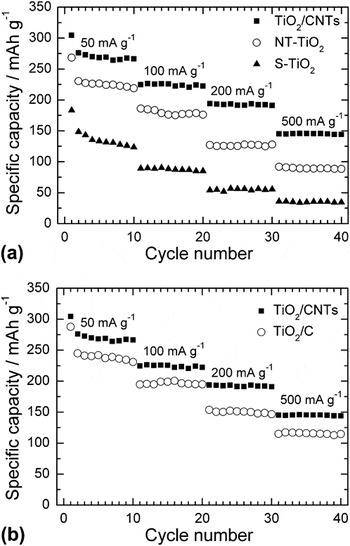
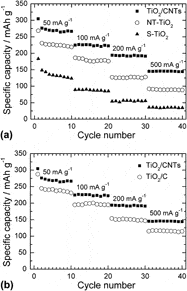
Figure 6(a) compares the rate capability among the three samples S-TiO2, NT-TiO2, and TiO2/CNTs. It is clear that the TiO2/CNTs sample shows the best rate capability among these samples. Apart from the initial capacity fade, the sample exhibits a stable cycling at each current rate. At a current density of 500 mA·g−1, a capacity of 143 mAh·g−1 can be still maintained for TiO2/CNTs, whereas for S-TiO2, this value drops to 32 mAh·g−1. The improvement in rate capability of TiO2/CNTs compared with S-TiO2 can be attributed to two factors: first, the introduction of CNTs by an in situ method leads to an increased electronic conductivity; second, the larger specific surface area is beneficial for the better wetting of the active material by the electrolyte, guaranteeing the rapider Li-ion diffusion across the electrode/electrolyte interface. It should be noted that the TiO2/CNTs sample also demonstrates an improved rate capability than NT-TiO2, even though the former has a lower specific surface area than the latter. This enhancement in rate capability can be ascribed mainly to the three-dimensional (3D) conductive network formed by the interentangled CNTs that connect the TiO2 particles firmly like bridges.Reference Li, Qu, Huai and Yu33 Besides, the in situ route guarantees a uniform dispersion of CNTs in the composite and an intimate contact of TiO2 with CNTs. As a result, the in situ prepared sample shows a higher capacity (276 mAh·g−1) than the mechanically blended (175 mAh·g−1) sampleReference Huang, Zhang, Gan, Wang and Zhang23 and the controlled-hydrolysis synthesized (212 mAh·g−1) sampleReference Cao, Guo, Zheng, Wu, Jiang, Bi, Wan and Maier16 at the same current density of 50 mA·g−1. Figure 6(b) compares the rate capability between TiO2/CNTs and a simple mixture of NT-TiO2 and natural graphite (25.5 wt%) (All the specific capacities are calculated based on the mass of TiO2 in the composites.). Note that the TiO2/CNTs sample yields a higher capacity than the simple mixture (TiO2/C). It suggests that 3D conductive network supplies a conductive channel for the composite by connecting the TiO2 effectively, leading to a reduced polarization and increased utilization of the active material.
Comparison of rate capability (a) among S-TiO2, NT-TiO2, and TiO2/CNTs and (b) between TiO2/CNTs and TiO2/C.

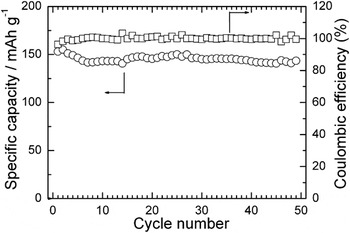
Figure 7 shows the cycling stability of the TiO2/CNTs sample at 500 mA·g−1. A capacity of around 145 mAh·g−1 is almost kept unchanged in the 50 cycles, indicative of good cycling stability at relatively high current density. It is suggested that the microstructure can be stabilized by the CNTs embedded in the aggregated TiO2 particles. Besides a good cycling stability, the TiO2/CNTs sample also displays a rather high Columbic efficiency of near 100%, indicating a good electrochemical reversibility during cycling.
Cycling stability and Columbic efficiency of TiO2/CNTs at 500 mA·g−1.

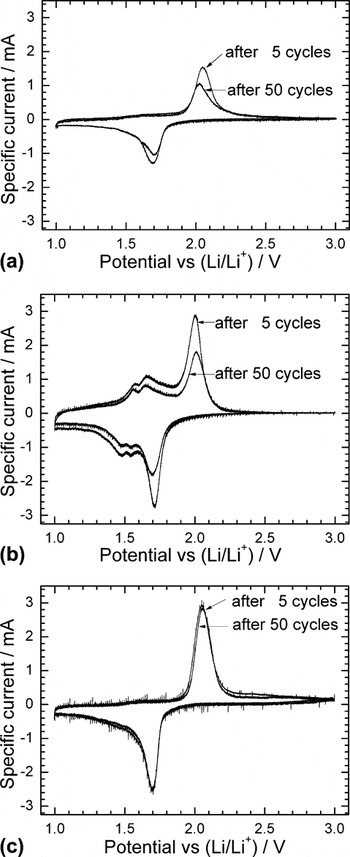
To understand the different electrochemical behaviors of the samples, CV measurements were conducted at 0.1 mV·s−1 after 5 and 50 cycles. For the S-TiO2 electrode, the current peaks are broadened with a decrease in peak intensity after 50 cycles compared those after 5 cycles [Fig. 8(a)]. This suggests that the degradation of the electrode material has occurred upon repeated cycling. For the NT-TiO2 electrode, a reduction of peak intensity is also observed during cycling. However, there are two couples of reversible peaks in the voltage ranged from 1.5 to 1.7 V [Fig. 8(b)], corresponding to the characteristic redox peaks of TiO2(B) which cannot be detected in the XRD patterns because of the low content. After heat treatment in N2/C2H2, the electrode kinetics was considerably enhanced evidenced by almost unchanged peak intensity during cycling for the TiO2/CNTs electrode [Fig. 8(c)], and the redox peaks related to TiO2(B) disappear totally, revealing the phase transition from TiO2(B) to anatase, agreeing with previous report.Reference Zhang, Li, An, Yan, Gao and Zhu3 The rapid electrode kinetics originates from the combined merits of an increased electronic conductivity and accelerated Li-ion transport across electrode/electrolyte interface. The rapid kinetics is favorable for the structural integrity of the electrode upon long-term cycling.
Cyclic voltammetry plots of (a) S-TiO2, (b) NT-TiO2, and (c) TiO2/CNTs at a scan rate of 0.1 mV·s−1.

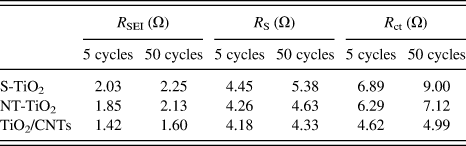
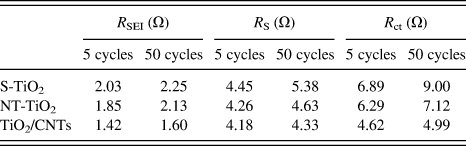
To further get the insight of the different electrochemical behaviors among these materials, EIS measurements were performed as seen in Fig. 9. In the Nyquist plots [Figs. 9(a)–9(c)], the symbols and solid lines represent the experimental points and fitting results using the equivalent circuit [Fig. 9(d)], respectively. The typical impedance spectra consist of two partially overlapped semicircles in the high-to-middle frequency range and a sloping line in the low frequency range. According to the literature,Reference Piao, Park, Doh and Moon34 the symbol R s in the equivalent circuit represents the electrolyte resistance, which corresponds to the intercept of high frequency semicircle at Z’ axis. The R SEI and CPE 1 elements, corresponding to the high frequency semicircle, represent the solid electrolyte interface (SEI) layer resistance and the capacitance related to the dielectric relaxation of the SEI layer, respectively. The R ct and CPE 2 elements, corresponding to the middle frequency semicircle, represent the charge transfer resistance at the electrolyte/electrode interface and the associated double layer capacitance, respectively, and R w is referred to the Warburg impedance, related to the Li-ions diffusion in the bulk electrode. The fitting results are given in Table I. Note that among the three samples, the TiO2/CNTs electrode shows the smallest change in R s, R SEI, and R ct during cycling. The R ct for TiO2/CNTs material is significantly lower than for other studied electrodes. This is because the electronic conductivity is improved by introducing CNTs and the large specific surface area of the composite is beneficial for Li+ diffusion at the electrode/electrolyte interface; hence, the R ct for TiO2/CNTs material is significantly lower than that of the other electrodes. The little change in R ct means that the interface between the electrode and the electrolyte is stable. In contrast, the S-TiO2 electrode shows an obvious rise in R ct, in consistent with its poor electrochemical performance.
Nyquist plots and the fitting results of (a) S-TiO2, (b) NT-TiO2, and (c) TiO2/CNTs electrodes and (d) the equivalent circuit.

Fitting results of Nyquist plots using the equivalent circuit.
S-TiO2, spherical TiO2; NT-TiO2, TiO2 nanotubes; CNTs, carbon nanotubes.
IV. CONCLUSIONS
The TiO2/CNTs nanocomposite was prepared by a facile hydrothermal and CVD route with in situ catalytic growth of CNTs in N2/C2H2. Compared with the pristine S-TiO2, the TiO2/CNTs material shows improved electrochemical properties. The enhancement in electrochemical properties is benefited from the efficient 3D conductive network formed by the in situ grown CNTs and the large specific surface area for rapid Li-ion diffusion at the electrode/electrolyte interface. In addition, the microstructure of the TiO2/CNTs can be stabilized by the embedding of CNTs into the TiO2 particles.
ACKNOWLEDGMENTS
This work was supported by Zijin Program of Zhejiang University, China, the Fundamental Research Funds for the Central Universities (No. 2010QNA4003), the PhD Programs Foundation of Ministry of Education of China (No. 20100101120024), the Foundation of Education Office of Zhejiang Province (No. Y201016484), the Qianjiang Talents Project of Science Technology Department of Zhejiang Province (2011R10021), and the National Natural Science Foundation of China (No. 51101139).