


Introduction
The widespread availability, low cost, unique textural and physicochemical properties, and susceptibility to modifications mean that clays and clay minerals have a diverse range applications in industry and in environment protection. Regardless of the choice of application, some treatment of the clay mineral properties is almost always required prior to use. One of the most frequent chemical treatments of clay minerals is acid activation, i.e. controlled reaction of raw materials with inorganic acids, usually HCl, less often H2SO4 or HNO3. The initial step in exposing clay mineral layered structures to acid involves the replacement of exchangeable cations (if present) with protons. Afterward, protons penetrate into the layers of the clay mineral structure, inducing the successive release of central atoms from the octahedra and aluminum from the tetrahedral sheets into the leachate. This process is linked with dehydroxylation of octahedra. Further progress of reaction with acid brings a gradual transformation of the tetrahedral sheets of the clay mineral into a three-dimensional framework structure (Fig. 1). Depending on the extent of acid treatment, the resulting solid product contains a mixture of a partly dissolved protonated clay mineral and an amorphous hydrous silica phase, while the ambient acid solution contains ions corresponding to the chemical composition of the clay mineral. The final reaction product is an amorphous, partly protonated silica phase (Bahranowski et al., Reference Bahranowski, Klimek, Gaweł, Olejniczak and Serwicka2022; Komadel and Madejová, Reference Komadel, Madejová, Bergaya, Theng and Lagaly2006, Reference Komadel, Madejová, Bergaya and Lagaly2013; Krupskaya et al., Reference Krupskaya, Novikova, Tyupina, Belousov, Dorzhieva, Zakusin, Kim, Roessner, Badetti, Brunelli and Belchinskaya2019; Novák and Číčel, Reference Novák and Číčel1978; Osthaus, Reference Osthaus1956; Pardo-Canales et al., Reference Pardo-Canales, Essih, Cecilia, Domínguez-Maqueda, Olmo-Sánchez, Pozo-Rodríguez and Franco2020; Zhou et al., Reference Zhou, Cheng, Wei and Zhang2021). The primary objective of reacting with acids is to activate the surface of clay minerals, thereby improving certain properties such as specific surface area (SSA), porosity, and surface acidity.
Schematic presentation of the acid-dissolution process.

Acid activation, refers mainly to partly dissolved bentonites (also known in the past as ‘bleaching earths’), is commonly required when clays are used as catalysts, catalyst supports, adsorbents, or materials for environmental applications (España et al., Reference España, Sarkar, Biswas, Rusmin and Naidu2019; Komadel, Reference Komadel2016; Thiebault, Reference Thiebault2020 and references therein). The extent of acid dissolution of clays and clay minerals can be monitored by several methods. Between them, the spectroscopic methods such as atomic absorption and emission spectroscopy, solid-state nuclear magnetic resonance spectroscopy, X-ray photoelectron spectroscopy, X-ray fluorescence spectroscopy, and infrared spectroscopy proved to be powerful methods to study the solid/liquid reaction products (e.g. Biswas et al., Reference Biswas, Rashidul Islam, Kanti Deb, Greenaway, Warr and Naidu2023; Breen et al., Reference Breen, Madejová and Komadel1995; Fonseca et al., Reference Fonseca, Vaiss, Wypych, Diniz and Leitão2018; Gates et al., Reference Gates, Anderson, Raven and Churchman2002; Johnston et al., Reference Johnston, Pepper, Martens and Couperthwaite2022; Kwon et al., Reference Kwon, Kim and Roh2021; Liu et al., Reference Liu, Lo, Cao, Xue, Lu, Yao and Li2023; Pentrák et al., Reference Pentrák, Hronský, Pálková, Uhlík, Komadel and Madejová2018; Sidorenko et al., Reference Sidorenko, Kravtsova, Aho, Heinmaa, Kuznetsova, Murzin and Agabekov2018). IR spectroscopy either in the middle-IR (MIR, 4000-400 cm–1) region (e.g. Cai et al., Reference Cai, Xue and Polya2007; Madejová et al., Reference Madejová, Bujdák, Janek and Komadel1998; Ritz et al., Reference Ritz, Zdrálková and Valášková2014; Tyagi et al., Reference Tyagi, Chudasama and Jasra2006; Vicente et al., Reference Vicente, Suárez Barrios, López-González and Bañares-Muñoz1996) or near-IR (NIR, 8000–4000 cm–1) region (e.g. Madejová et al., Reference Madejová, Pentrák, Pálková and Komadel2009; Pálková et al., Reference Pálková, Madejová and Righi2003; Pálková et al., Reference Pálková, Zimowska, Jankovič, Sulikowski, Serwicka-Bahranowska and Madejová2017; Tomić et al., Reference Tomić, Ašanin, Antić-Mladenović, Poharc-Logar and Makreski2012) is one of the most sensitive methods to the modifications of the clay mineral structure upon acid treatment.
The purpose of the present work was to review the potential of infrared spectroscopy in both the MIR and NIR regions for studies of acid-treated clay minerals. The first part is focused on summarizing the trends derived from the changes in IR spectra and is based on the extensive and systematic experiments carried out in our laboratory over many previous years. The effect of selected variables, i.e. clay mineral composition, non-swelling interlayers, kaolinite ordering, or the presence of the organic cations in the smectite interlayers on the dissolution rate was demonstrated. The added value of this part could be in highlighting the differences between spectra obtained by various techniques of the IR spectroscopy available to study the solid product of the acid treatment. Such a comparison has not been performed previously and would elucidate the advantages or limitation of using particular method.
In the second part, the current research status related to the industrial and environmental applications of the acid-activated clay minerals, utilizing different techniques including IR spectroscopy, was explored. The papers published in the period 2017–2024 are reviewed here only, as studies related to acid-activated clays appearing prior to 2016 were reviewed extensively by Komadel (Reference Komadel2016). Since then, however, various papers on acid-treated clay rocks, clay minerals, and related materials have been published. Some studies from the past five years have targeted new ways to prepare advanced materials (Aydin, Reference Aydin2024; Funes et al., Reference Funes, Peralta, Pettinari, Carlos and Parolo2020; Johari et al., Reference Johari, Adnan and Ahmad2020; Lebovka et al., Reference Lebovka, Goncharuk, Klepko, Mykhailyk, Samchenko, Kernosenko, Pasmurtseva, Poltoratska, Siryk, Solovieva and Tatochenko2022; Matejdes et al., Reference Matejdes, Hausner, Grüner, Kaupp and Breu2020; Roy et al., Reference Roy, Butola and Joshi2017; Sangare et al., Reference Sangare, Belaidi, Saoudi, Bouaziz, Seraghni and Sehili2024; Xiao et al., Reference Xiao, Lang, Xiang, Lin and Li2021); others have focused on applications of acid-treated materials in the adsorption of heavy metals (Acar & Yuksekdag, Reference Acar and Yuksekdag2023; Mustapha et al., Reference Mustapha, Yusuff and Dim2023) or organic pollutants (Dehmani et al., Reference Dehmani, Sellaoui, Alghamdi, Lainé, Badawi, Amhoud, Bonilla-Petriciolet, Lamhasni and Abouarnadasse2020; He et al., Reference He, Zhu, Chen, Tang, Ji, Wei, Du, Yang and Zhu2024; Rouhani et al., Reference Rouhani, Farhadi, Akbari Kenari, Eskandari and Ramakrishna2021), in wastewater treatment (Erasto et al., Reference Erasto, Hellar-Kihampa, Alphonce Mgani and Lugwisha2023; Gharbi-Khelifi et al., Reference Gharbi-Khelifi, Jmii, Mosbahi, Hamdi, Hamdi, Brahmi, Loukil, Chamkha, Sayadi, Aouni, Barreiro, Fernández-Sanjurjo, Núnez-Delgado and Alvarez Rodríguez2023; Hadoudi et al., Reference Hadoudi, Charki, Ouarghi, Salhi, Amhamdi and Ahari2023; Younes et al., Reference Younes, Kh. El-Etriby and Mahanna2022), CO2 capture (Ansari et al., Reference Ansari, Shahhosseini and Maleki2023; Franco et al., Reference Franco, Cecilia, Pozo, Pardo, Bellido and García-Sancho2020), catalytic reactions (Balbay et al., Reference Balbay, Selvitepe and Saka2021; Liu et al., Reference Liu, Lo, Cao, Xue, Lu, Yao and Li2023; Nouri et al., Reference Nouri, Tasviri and Ghasamzadeh2021; Perez et al., Reference Perez, Santori, Pompeo and Nichio2022; Thampikannu et al., Reference Thampikannu, Jiménez, Rives, Vicente, Razak and Vellayan2022; Zahid et al., Reference Zahid, Ayoub, Bin Abdullah, Hamza Nazir, Zulqarnain, Kaimkhani and Sher2021; Zeynizadeh et al., Reference Zeynizadeh, Rahmani and Ilkhanizadeh2019), as drug carriers (Martin et al., Reference Martin, Perez and Rivera2021; Pereira et al., Reference Pereira, Paz, Gomes, Leite, Fechine and Filho2021; Stodolak-Zych et al., Reference Stodolak-Zych, Rapacz-Kmita, Gajek, Rózycka, Dudek, Kluska, Rapacz-Kmita, Gajek, Rózycka, Dudek and Kluska2023; Swain et al., Reference Swain, Nandi, Mohapatra and Mallick2024), in the desalination of water (Ali et al., Reference Ali, Askalany, Harby, Refaat Diab, Hussein and Alsaman2021), or in possible alumina production from clays (Erdemoglu et al., Reference Erdemoğlu, Birinci and Uysal2020), to name just some as proof of the significance of such treatment, not just for application purposes, but also in geological or fundamental research studies.
The information related to the structural changes and properties of acid-activated clay minerals presented in the first part of the present study could be useful not only for research aimed at the design of novel types of catalysts and adsorbents but also at geologists or soil scientists studying the effect of acid mine drainage on the clay minerals, influencing terrestrial ecosystems. As some studies focusing on the utilization of acid-activated clays for catalysis and adsorption have shown inconsistencies in the interpretation of the IR spectra, the present authors believe that the data presented in the first part of this review may also contribute to a more accurate characterization of these materials.
FTIR techniques applied in studies of acid-treated clays
Various sampling techniques have been employed for measuring the IR spectra of raw clays (Chryssikos, Reference Chryssikos, Gates, Klopproge, Madejová and Bergaya2017; Madejová et al., Reference Madejová, Balan, Petit and Christidis2011) however some methods were not used as frequently for acid-treated samples. Traditionally, the MIR spectra of acid-treated clay minerals have been acquired by transmission techniques using KBr pellets. The pellet is prepared by dispersing ~1 wt. % of a sample in an alkali halide powder. In addition to the transmission, reflection techniques can also be used for the characterization of acid-treated clays. Attenuated Total Reflectance (ATR) is currently the most widely used sampling tool for measuring MIR spectra of clay minerals. Another reflectance technique used in the analysis of solids and powders is the Diffuse Reflectance Infrared Fourier Transform (DRIFT) method as it generally requires little sample preparation.
The MIR spectra of montmorillonite SAz-1 (Cheto, Arizona, obtained from the Source Clay Repository of The Clays Minerals Society) untreated and acid-treated in HCl measured by the above-mentioned sampling techniques are compared in Fig. 2. The IR spectra of the samples measured via KBr pellets (Fig. 2A) are described as first considering widespread use of this technique. Montmorillonite (Mnt) is the most abundant dioctahedral mineral from the smectites groups. SAz-1 contains mainly Al and Mg in the central positions of the octahedral sheets, the Si is the main central atom in the tetrahedral positions. The MIR spectrum of the raw (untreated) sample contains the characteristic vibrations of the OH and Si–O groups present in the octahedral and tetrahedral sheets (Fig. 2A,a). The OH bending bands at 915 cm–1 (δAlAlOH) and 842 cm–1 (δAlMgOH) confirmed that Al(III) was partly substituted with Mg(II) in the octahedral positions of SAz-1. The intensive band at 1029 cm–1 was assigned to the Si–O stretching vibrations (νSi–O), and to the Si–O–Al and Si–O–Si bending bands which appeared at 520 and 465 cm–1 (Farmer, Reference Farmer and Farmer1974; Madejová et al., Reference Madejová, Gates, Petit, Gates, Klopproge, Madejová and Bergaya2017). The MIR spectrum of SAz-1 dissolved in 6 M HCl for 8 h at 80oC showed the disappearance of the AlAlOH, AlMgOH, and Si–O–Al bending bands due to the release of the central atoms from the octahedral sheets upon acid treatment (Fig. 2A,b). Leaching of the octahedral atoms confirmed also the almost complete disappearance of the OH-stretching vibration present at 3624 cm–1 for raw montmorillonite. The Si–O stretching band was shifted from 1029 cm–1, i.e. the position characteristic of tetrahedra arranged into the sheets, to 1097 cm–1, the position characteristic of amorphous silica created during HCl treatment. Another characteristic Si–O band of amorphous silica was observed at 800 cm–1. The absorption band near 960 cm–1 related to the Si–O stretching vibrations in Si–OH groups confirmed the presence of protonated amorphous silica in the solid reaction product (Madejová et al., Reference Madejová, Bujdák, Janek and Komadel1998). The KBr spectra of acid-treated clay minerals have been described many times confirming that this technique is very suitable for following processes occurring during treatment as leaching of the central atoms from octahedral sheets and transformation of the layered structure to the three-dimensional structure of amorphous SiO2.
MIR spectra of montmorillonite SAz-1: (a) prior to and (b) after acid treatment for 8 h at 80°C in HCl, measured using various methods: A – KBr pellets, B – ATR, C – DRIFT (dotted-lines = sample undiluted with KBr, solid-lines = sample diluted with KBr).
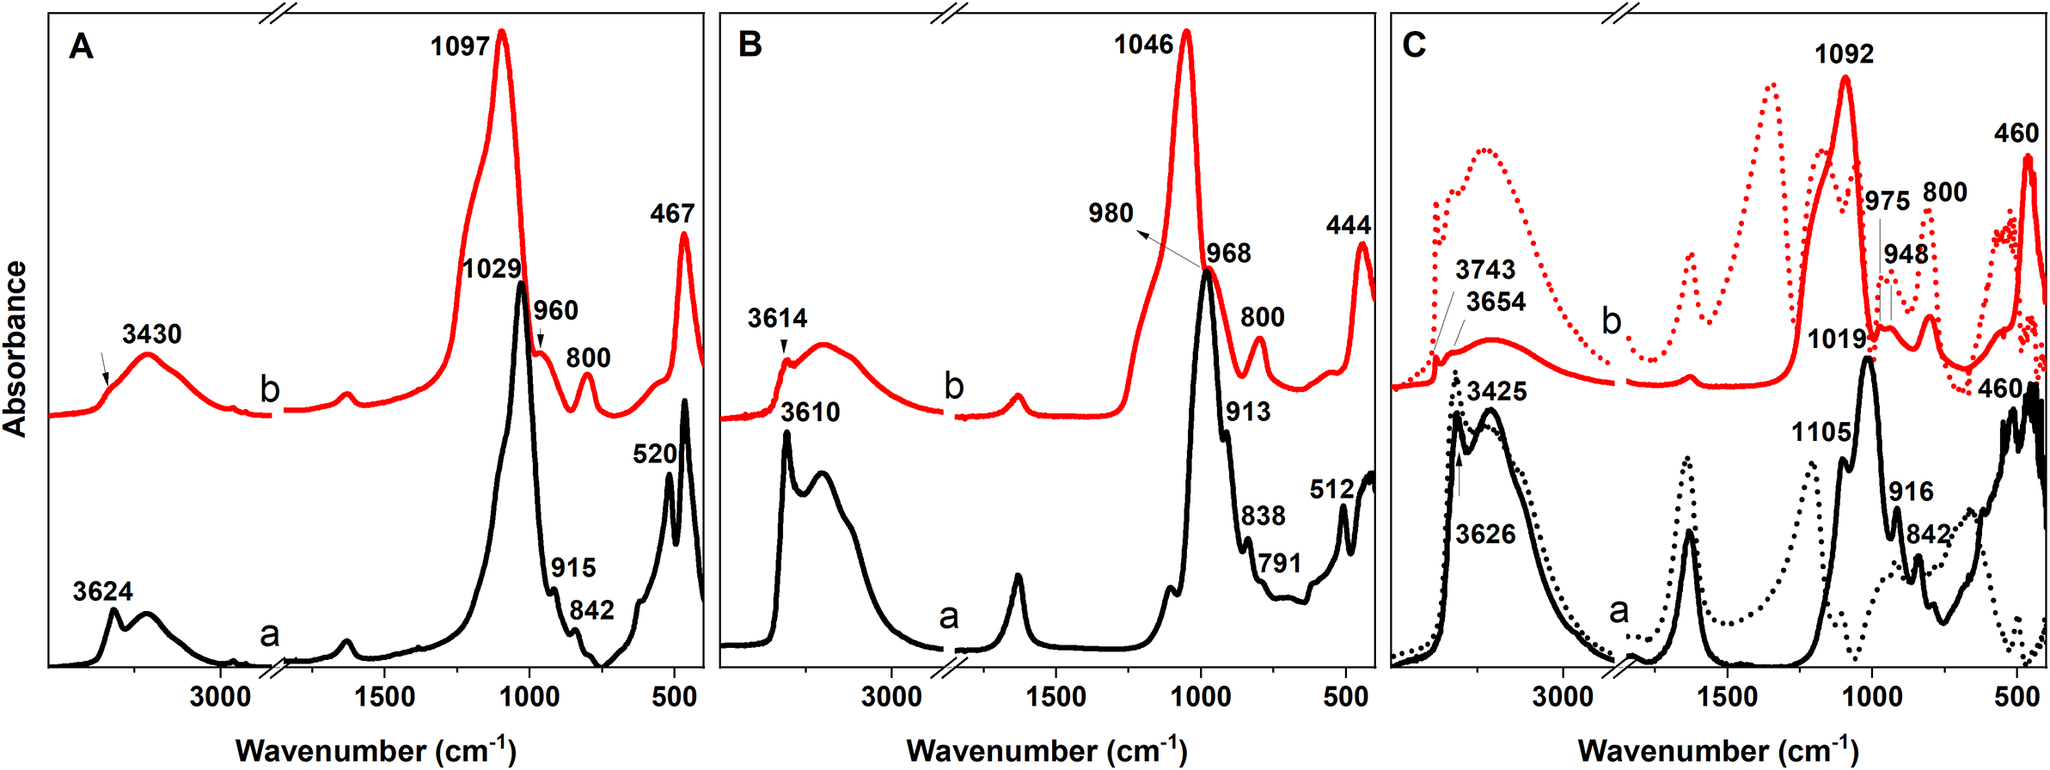
The ATR method provides spectra which are slightly distinct from those obtained by conventional transmission KBr technique (Fig. 2B). The most prominent difference lies in the position of the band of the Si–O stretching vibrations, which is present at lower wavenumbers. Slightly lower wavenumbers were also detected for the OH vibrations. Comparison of the two methods showed that, despite differences between the positions of the bands, the same information can be obtained from both techniques. ATR allows analysis of the samples with little or no sample preparation which greatly speeds analysis. Utilization of this technique for acid-treated clay minerals is rather rare, however (Boudriche et al., Reference Boudriche, Bergaya and Boudjemaa2023, Erasto et al., Reference Erasto, Hellar-Kihampa, Alphonce Mgani and Lugwisha2023; Marosz et al., Reference Marosz, Kowalczyk and Chmielarz2020a; Marosz et al., Reference Marosz, Kowalczyk, Gil and Chmielarz2020b; Plata et al., Reference Plata, Rojas and Gauthier-Maradei2020; Sousa et al., Reference Sousa, Rodrigues, Araujo, Menezes, Neves and Lira2022).
Utilization of DRIFT in the MIR region to reveal decomposition of the layered structure upon acid treatment is limited by the interference effects created by the particle size and incident IR radiation, normally appearing below 1200 cm–1 for clay minerals. DRIFT spectra of SAz-1 (Fig. 2C) showed several reflectance peaks that are difficult to assign or recognize and the shape of the spectra deviates completely from those observed for KBr and ATR (Fig. 2A,B). Detection of Si–O bands is particularly challenging, in contrast to the stretching and bending vibration of the OH groups which are readily detectable. On the other side, MIR-DRIFT spectra clearly display the stretching band of the Si–OH groups near 3743 cm–1 for acid-treated samples. The formation of the silanol groups is an important indication of the presence of hydrous amorphous products with Si–OH groups on the surface. These sites can further interact with other molecules and therefore indicate the adsorption ability of the activated products. To suppress the spurious reflectance bands in MIR-DRIFT spectra of undiluted samples, the mixture of montmorillonite with KBr powder was essential. Notable changes in the shape of the SAz-1 spectrum, rendering them more akin to the ATR and KBr spectra were observed after mixing with KBr in a 1:3 ratio (Fig. 2C, dashed line). The main drawback of using the DRIFT method more frequently is the necessity of employing KBr to mitigate undesired distortion in the spectra, which slows the measurement process. This limitation prompts the exclusive use of the DRIFT method for measurement of spectra in the NIR region, above 4000 cm–1 (Madejová et al., Reference Madejová, Pentrák, Pálková and Komadel2009, Pálková et al., Reference Pálková, Zimowska, Jankovič, Sulikowski, Serwicka-Bahranowska and Madejová2017), where dilution of the clay samples is unnecessary. In addition, the sample remains intact and can be reused for further analysis.
An exception to the previous statement can be the use of the DRIFT method for analysis of acid sites. MIR-DRIFT spectra of undiluted clay minerals can be used successfully to determine the Brönsted acid-sites (BA) or Lewis acid-sites (LA) in acid-treated samples after pyridine adsorption (as will be shown later). Pyridine can be adsorbed physically and/or chemically on the montmorillonite surface. Chemisorbed pyridine can either form hydrogen bonds between the pyridine nitrogen atom and OH groups of clay minerals, can accept protons, can create pyridinium cations at strong Brönsted acid sites (i.e. from polarized water molecules), or can be bound coordinately through pairs of electrons on nitrogen atoms to Lewis acid centers (e.g. Al(III)), Pálková et al., Reference Pálková, Hronský, Jankovič and Madejová2013; Reddy et al., Reference Reddy, Bhat, Nagendrappa and Prakash2009; Rouhani et al., Reference Rouhani, Farhadi, Akbari Kenari, Eskandari and Ramakrishna2021; Yu et al., Reference Yu, Zhu, Tong, Deng, Fu, Huang and Zhou2022).
In the sections below, some fundamental phenomena, visible in the IR spectra of clay minerals subjected to the reactions with inorganic acids, will be discussed taking into account various parameters. The aim is to highlight the advantages of IR spectroscopy from several perspectives and to provide comprehensive information about the structural changes during acid activation.
Part I: Structural changes in acid-treated clay minerals distinguished by MIR and NIR spectroscopy
Dissolution of clay minerals in inorganic acids causes significant degradation of their structures. In the following section, the MIR spectra were obtained by KBr techniques while for the NIR region, the DRIFT method was utilized. The MIR and NIR spectra of untreated and HCl-treated montmorillonite Kunipia F (denoted as Kun) supplied by Kunimine Industries Co., Ltd. (Japan) are presented in Fig. 3. Kun contains mainly Al and Mg in the central positions of the octahedral sheets; Si is the main central atom in the tetrahedral positions. As a result of the similar chemical composition of Kun and SAz-1, the MIR spectrum of a raw (untreated) Kun sample resembles that of SAz-1 (Fig. 2A). The MIR spectra of Kun dissolved in 6 M HCl at 95°C showed a gradual decrease in the intensities of the AlAlOH, AlMgOH, and Si–O–Al bending bands with prolonged time of treatment reflecting the diminishing amount of octahedral atoms due to the acid attack. A gradual shift of the νSi–O band from 1038 cm–1 to 1101 cm–1 and increased intensity of the band near 802 cm–1 with the time of HCl treatment confirmed the creation of the amorphous silica (Madejová et al., Reference Madejová, Bujdák, Janek and Komadel1998). The HCl treatment for 24 h was needed for almost complete destruction of the layered structure of Kun.
MIR and NIR spectra of Kunipia montmorillonite not treated in HCl (0 h) and of samples obtained after treatment in 6 M HCl at 95°C for 4 h, 8 h, 12 h and 24 h.
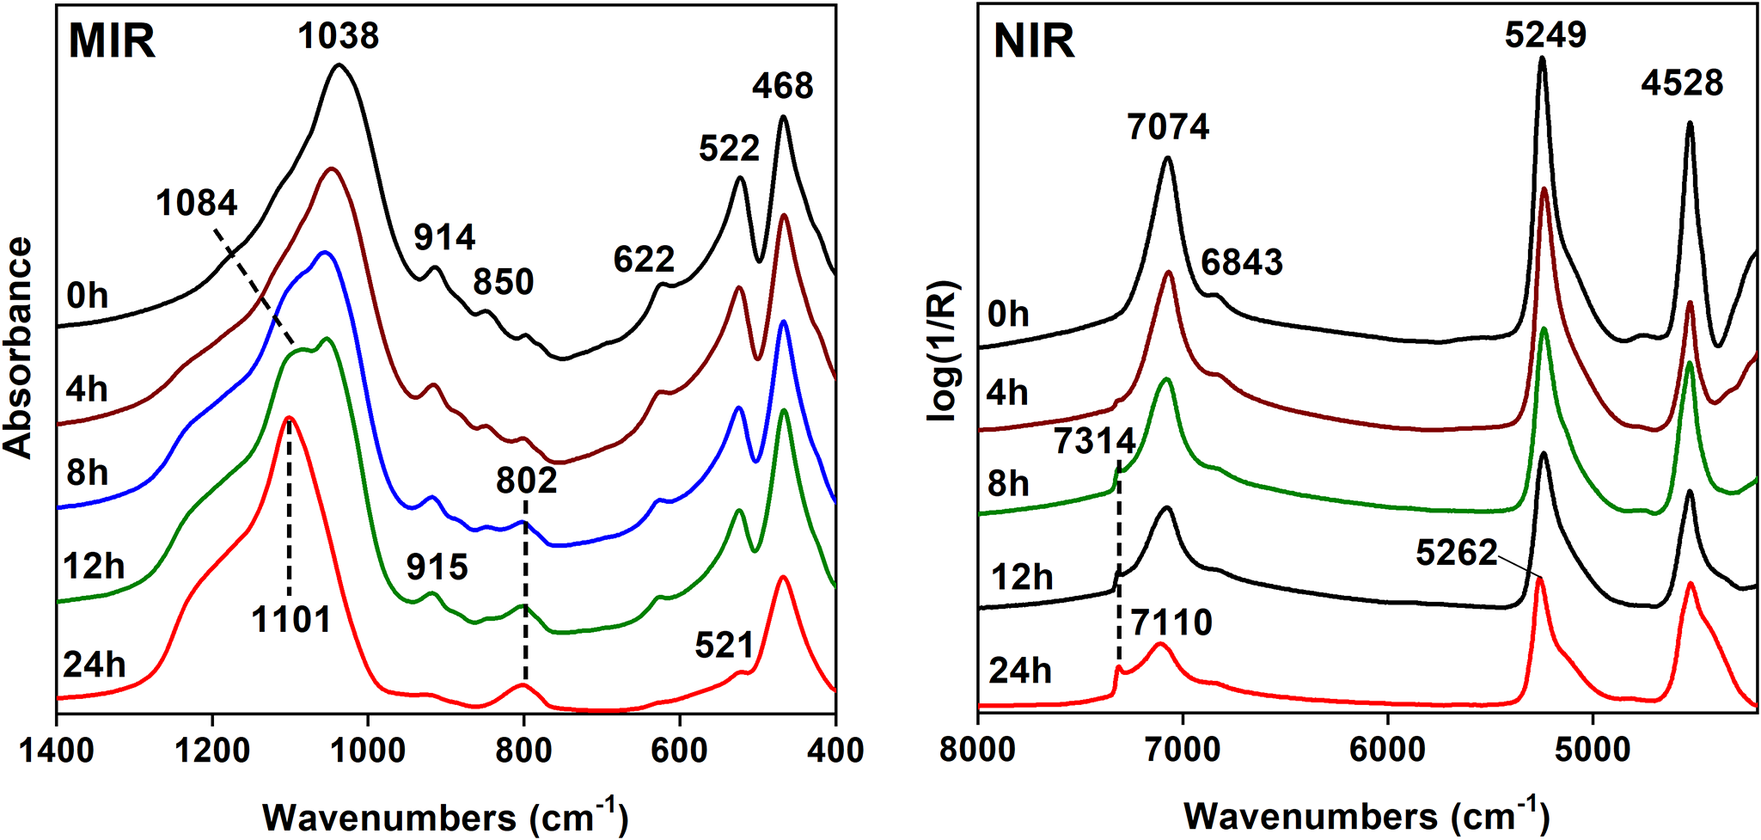
In the NIR region of clay minerals, the bands resulting from the first overtones (2νOH) and combination ((ν+δ)OH) modes of the OH-stretching and bending vibrations appear. The NIR spectrum of Kun montmorillonite (Fig. 3, NIR) showed a broad complex band at 7074 cm–1 containing overlapping contributions of the 2νOH of the structural OH groups and H2O molecules, a strong band at 5249 cm–1 due to the combination of the stretching and bending vibrations of water molecules (ν+δ)H2O, and a band at 4528 cm–1 corresponding to the combination (ν+δ)OH mode (Bishop et al., Reference Bishop, Pieters and Edwards1994). Upon acid treatment, the OH overtone region showed a gradual decrease in the intensity of the 2νOH band reflecting a release of the central atoms from the octahedral sheets and the appearance of a new component near 7314 cm–1 increasing in intensity with the time of treatment. The 7314 cm–1 band was attributed to the first overtone of the Si–OH groups formed as the smectite layers were transformed into a partly protonated silica phase (Madejová et al., Reference Madejová, Pentrák, Pálková and Komadel2009; Pálková et al., Reference Pálková, Madejová and Righi2003). The intensity of the (ν+δ)H2O band was reduced significantly due to decomposition of Mnt layers. Moreover, gradual upward shift of the (ν+δ)H2O band provides evidence that H2O molecules adsorbed on the surfaces of disintegrated montmorillonite layers and/or amorphous silica were less strongly hydrogen bonded than those in untreated samples, e.g. H2O H-bonded to the exchangeable cations (Madejová et al., Reference Madejová, Pentrák, Pálková and Komadel2009).
The general trends in the IR spectra, depending on various parameters which, in our opinion, have the greatest impact on structural changes occurring upon treatment, will be described next.
Effect of octahedral sheet configuration
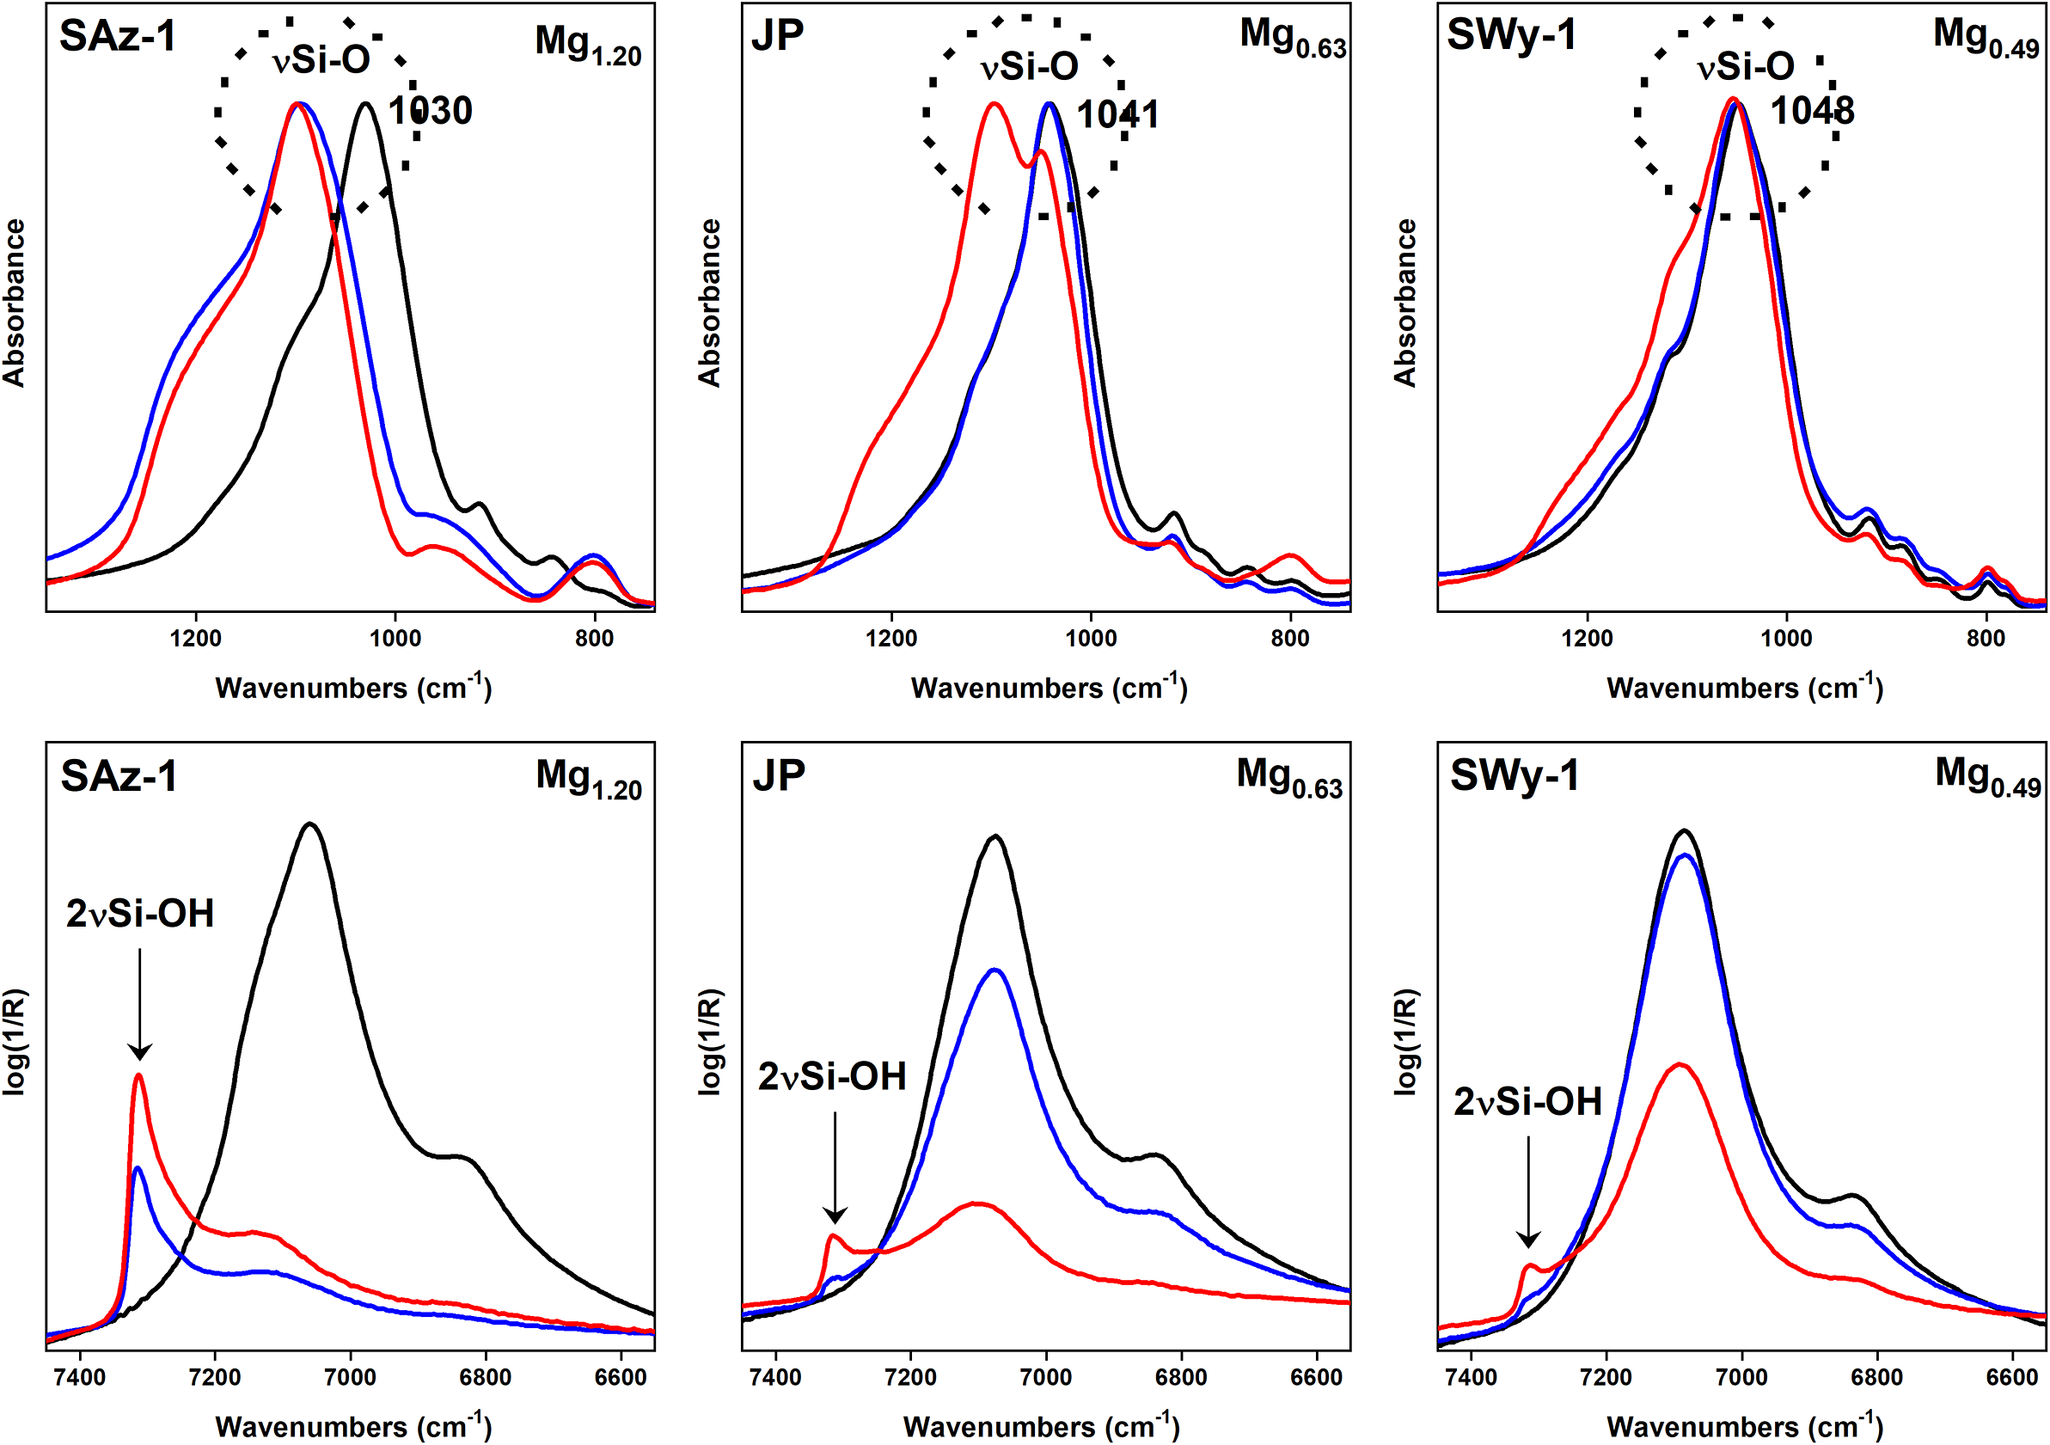
The mechanism of dissolution of all clay minerals in inorganic acids is the same regardless of the chemical composition or structural arrangement of a mineral. However, the treatment conditions, such as acid concentration, temperature, or time of the reaction can be different for different clay minerals and they are adjusted based on factors such as the mineral’s composition, structure, and intended analytical or practical application (Komadel & Madejová, Reference Komadel, Madejová, Bergaya, Theng and Lagaly2006). Dioctahedral smectites exhibit a broad variation in the chemical composition of the octahedral sheets and therefore are very suitable for investigating targeted structural alterations during treatment. Mg(II) and/or Fe(III) substitution for Al(III) in the octahedral sheets increases substantially the dissolution rate of smectites in both HCl and H2SO4 (Madejová et al., Reference Madejová, Bujdák, Janek and Komadel1998, Reference Madejová, Pentrák, Pálková and Komadel2009). The MIR and NIR spectra of smectites with different amounts of Mg(II) in their structures are shown in Fig. 4. SAz-1 and SWy-1 are montmorillonites obtained from the Source Clays Repository of The Clay Minerals Society, and JP is montmorillonite from Jelšový Potok deposit (Slovakia). The Mg(II) content decreases from SAz-1, through JP to SWy-1. Raw samples were treated in 6 M HCl at 95°C for 2 and 8 h. As indicators of the structure destruction after reaction with acid the position of the νSi–O band and the intensity of the 2νSi–OH were chosen for the MIR and NIR region, respectively. The position of the νSi–O band of SAz-1, the most Mg-rich sample, was shifted significantly from 1030 cm–1 to 1099 cm–1 even after 2 h of treatment, indicating the almost complete transformation of the layered structure to three-dimensional arrangement of the SiO2. Dissolution of SAz-1 in HCl for 8 h evoked no further shift of the Si–O band. The NIR spectrum of the SAz-1 revealed a rather intense 2νSi–OH band after 2 h of treatment, the intensity of which increased after 8 h of reaction with acid. The increase in the Si–OH band intensity also for the sample consisting mainly of amorphous silica, as indicated by the MIR spectrum, confirmed further the creation of the OH groups on the surface of the acid dissolution product. The changes observed for the Si–O band of JP correlate well with a lower Mg(II) content in the sample compared to SAz-1. A negligible shift of the Si–O band after a 2 h treatment indicates minor decomposition of the JP structure. Less dissolution of JP than of SAz-1 confirmed also the shape of the Si–O peak after 8 h of treatment. The position at 1097 cm–1 belongs to amorphous silica while that at 1050 cm–1 belongs to a partly preserved layered structure. The low intensity of the Si–OH band is in accord with the lower degree of the dissolution of JP in HCl. The MIR and NIR spectra of SWy-1, the sample with the smallest Mg(II) content, show only negligible changes in the Si–O band position (a shift from 1048 to 1054 cm–1) and a weak intensity of the Si–OH band, both suggesting very limited decomposition of the SWy-1 structure (Fig. 4).
MIR and NIR spectra of untreated SAz-1, JP, and SWy-1 montmorillonites (black lines) and of the same materials treated in 6 M HCl at 95°C for 2 h (blue lines) and 8 h (red lines). The octahedral Mg content is given in the upper area of the individual parts of the figure. The figure is based on the data provided by Madejová et al. (Reference Madejová, Bujdák, Janek and Komadel1998, Reference Madejová, Pentrák, Pálková and Komadel2009).
In addition to dioctahedral smectites, the dissolution of the trioctahedral smectite, hectorite SHCa-1 (San Bernardino County California, obtained from the Source Clays Repository of The Clay Minerals Society), in HCl was also studied. Hectorite contains Mg(II) and Li(I) as the main octahedral atoms; Si is the central atom in the tetrahedral sheets. The acid dissolution evoked similar changes in the spectra of SHCa-1 (Fig. 5) to those of Kun (Fig. 3). However, trioctahedral smectites decompose in inorganic acids much more quickly than their dioctahedral counterparts. Therefore, more moderate conditions should be used to follow gradual structural changes upon acid treatment. SHCa-1 was dissolved in 0.5 M HCl at 30°C compared to dioctahedral Kun treated with 6 M HCl at 95°C. In contrast to Kun showing well-resolved AlAlOH, AlMgOH, and Al–O–Si bands, the Mg3OH bending band of hectorite at 655 cm–1 was overlapped with the Si–O band at 703 cm–1 and Mg–O–Si bending bands with Si–O–Si at 469 cm–1 (both not shown). Thus, the changes in the Si–O stretching region were more appropriate for monitoring dissolution of SHCa-1 in the MIR region. The appearance of the Si–O band at 1072 cm–1 indicated a pronounced modification of the hectorite structure after 1 h of treatment in 0.5 M HCl compared to Kun showing only slight changes after 8 h of reaction in acid (Fig. 3). After 6 h, the spectrum of SHCa-1 corresponded to that of amorphous silica. The broad weak band near 960 cm–1 confirmed the creation of the Si–OH groups in the reaction product (Madejová et al., Reference Madejová, Gates, Petit, Gates, Klopproge, Madejová and Bergaya2017).
MIR and NIR spectra of: (a) untreated hectorite SHCa-1 and spectra of the samples obtained after dissolution in 0.5 M HCl at 30°C for (b) 1 h, (c) 4 h, and (d) 6 h. The figure is based on the data provided by Madejová et al. (Reference Madejová, Gates, Petit, Gates, Klopproge, Madejová and Bergaya2017).

The NIR spectrum of untreated hectorite (Fig. 5) showed two separated bands related to 2νOH (7188 cm–1) and 2νH2O (7080 cm–1) allowing better distinction of the changes in the 2νOH and 2νH2O modes upon dissolution compared to montmorillonite. The rate of the changes in the NIR spectra of SHCa-1 were similar to Kun (Fig. 3) even though the reaction conditions were less severe. For example, the 2νSi–OH band at 7316 cm–1, indicating the presence of partly protonated silica phase, was recognized in the SHCa-1 spectrum after 1 h of dissolution in 0.5 M HCl at 30°C but for Kun after 8 h dissolution in 6 M HCl at 95°C. Clearly, the type of the central atoms in the octahedral sheets affected significantly the stability of smectites in inorganic acid.
Effect of swelling interlayers
An important parameter affecting the decomposition rate of the clay minerals structure is the presence of swelling interlayers (Pentrák et al., Reference Pentrák, Madejová and Komadel2010). The MIR and NIR spectra of three clay minerals with different amounts of swelling interlayers are presented in Fig. 6. Montmorillonite (Mnt) from Jelšový Potok contained only swelling interlayers; a mixed-layer illite-smectite (Ilt-Sme) from the Dolná Ves deposit (Slovakia) had 30% swelling interlayers, while illite (Ilt) (#36, Morris, Illinois, USA) possessed only 9% swelling interlayers. The position of the Si–O stretching band was selected to monitor the gradual decomposition of the samples in 6 M HCl at 95°C for different time intervals. The MIR spectra clearly showed differences in the extent of dissolution of clay minerals. The Si–O band of Mnt was shifted significantly from 1039 to 1097 cm–1 after 4 h of treatment and the position at 1104 cm–1 indicated complete depletion of the Mnt structure after 8 h. In contrast, no visible changes in the spectrum of Ilt-Sme treated for 4 h, and only a shoulder near 1090 cm–1 after 8 h revealed the good stability of the mineral with 30% swelling interlayers. The MIR spectrum measured after 18 h of HCl treatment confirmed the presence of amorphous silica only. The Si–O stretching region of the Ilt with only 9% swelling interlayers showed, surprisingly, less stability in HCl than Ilt-Sme, mainly for shorter times of the reaction with acid. The shape of the Si–O band of Ilt with a shoulder at 1093 cm–1 indicated a partial decomposition of the layers after 4 h of reaction, while no change in the Si–O band position was observed for Ilt-Sme. The Si–O band of Ilt after 8 h of treatment was at 1103 cm–1 while that of Ilt-Sme was at 1033 cm–1. After 36 h the position (1103 cm–1) and the shape of the Si–O band was characteristic of amorphous silica (Fig. 6), the final reaction product of long acid treatment of clay minerals.
MIR and NIR spectra of untreated montmorillonite, illite-smectite, illite, and spectra of the samples obtained after dissolution in 6 M HCl at 95°C for different time intervals (indicated in figure). The figure is based on data provided by Pentrák et al. (Reference Pentrák, Madejová and Komadel2010).

The OH overtone region of the acid-treated samples confirmed the results obtained in the MIR region. The intensity of the complex 2νOH band decreased with the greater release of central octahedral atoms as well as diminishing the H2O content during clay-mineral decomposition. The 2νSi–OH band near 7315 cm–1 in the spectra of all acid-treated samples increased in intensity with the extent of mineral decomposition and creation of protonated SiO2 product. The greatest intensity of this band was observed for Mnt treated for 18 h, less for Ilt and least for Ilt-S after 36 h of dissolution. Both the MIR and NIR spectra of the samples treated in HCl showed clearly that Ilt-Sme was dissolved more slowly not just in comparison with montmorillonite but also with illite, the mineral containing the smallest proportion of non-swelling interlayers. The reason for the unexpected dissolution rate of Ilt-Sme vs Ilt is the isomorphous substitution of Al(III) for Mg(II) in the octahedral sheets of these minerals. Much faster dissolution of illite (9% of swelling interlayers) than Ilt-Sme (30% swelling interlayers) was caused by substantially larger octahedral Mg and Fe contents (0.46 and 0.57 per O20(OH)4, respectively), in Ilt than in Ilt-Sme (0.28 and 0.11 per O20(OH)4), respectively (Pentrák et al. Reference Pentrák, Madejová and Komadel2010). It is evident, that isomorphous substitution in the octahedral sheets of dioctahedral clay minerals has a much greater effect on their dissolution rate than swelling ability (Fig. 6).
The effect of non-swelling layers on the decomposition of the structure upon acid treatment can be demonstrated also on the so called reduced-charge smectites. Heating of octahedrally-charged smectites saturated with small exchangeable cations (e.g. Li+ or Ni2+) at 120–300°C for 24 h initiated the migration of the cations into the previously vacant octahedra and/or hexagonal holes of the tetrahedral sheets (Madejová et al., Reference Madejová, Bujdák, Petit and Komadel2000a; Pálková et al., Reference Pálková, Madejová and Righi2003). As a consequence of heating, the negative layer charge is reduced and a loss of expandable character was observed, i.e. increase in non-swelling interlayers with temperature (Komadel et al., Reference Komadel, Madejová and Bujdák2005 and references therein). These phenomena were reflected in the νSi–O band position which was shifted to higher wavenumbers for Li-SAz-1 montmorillonite heated at 150 and 300°C (Fig. 7 – upper part, black lines). In the NIR region a new band at 7170 cm–1 appeared after heating of Li-SAz-1 (Fig. 7 – lower part, black lines) as a response to the formation of LiMgAlOH domains upon Li(I) fixation in the layered structure (Madejová et al., Reference Madejová, Bujdák, Petit and Komadel2000b). The greater intensity of this band for Li-SAz_300°C indicated greater population of the AlMgLiOH groups, i.e. a larger amount of non-swelling interlayers.
MIR and NIR spectra of unheated montmorillonite Li-SAz, Li-SAz heated to 150°C and 300°C and samples after treatment in 6 M HCl for different time intervals (indicated in figure). The figure is based on data provided by Pálková et al. (Reference Pálková, Madejová and Righi2003).
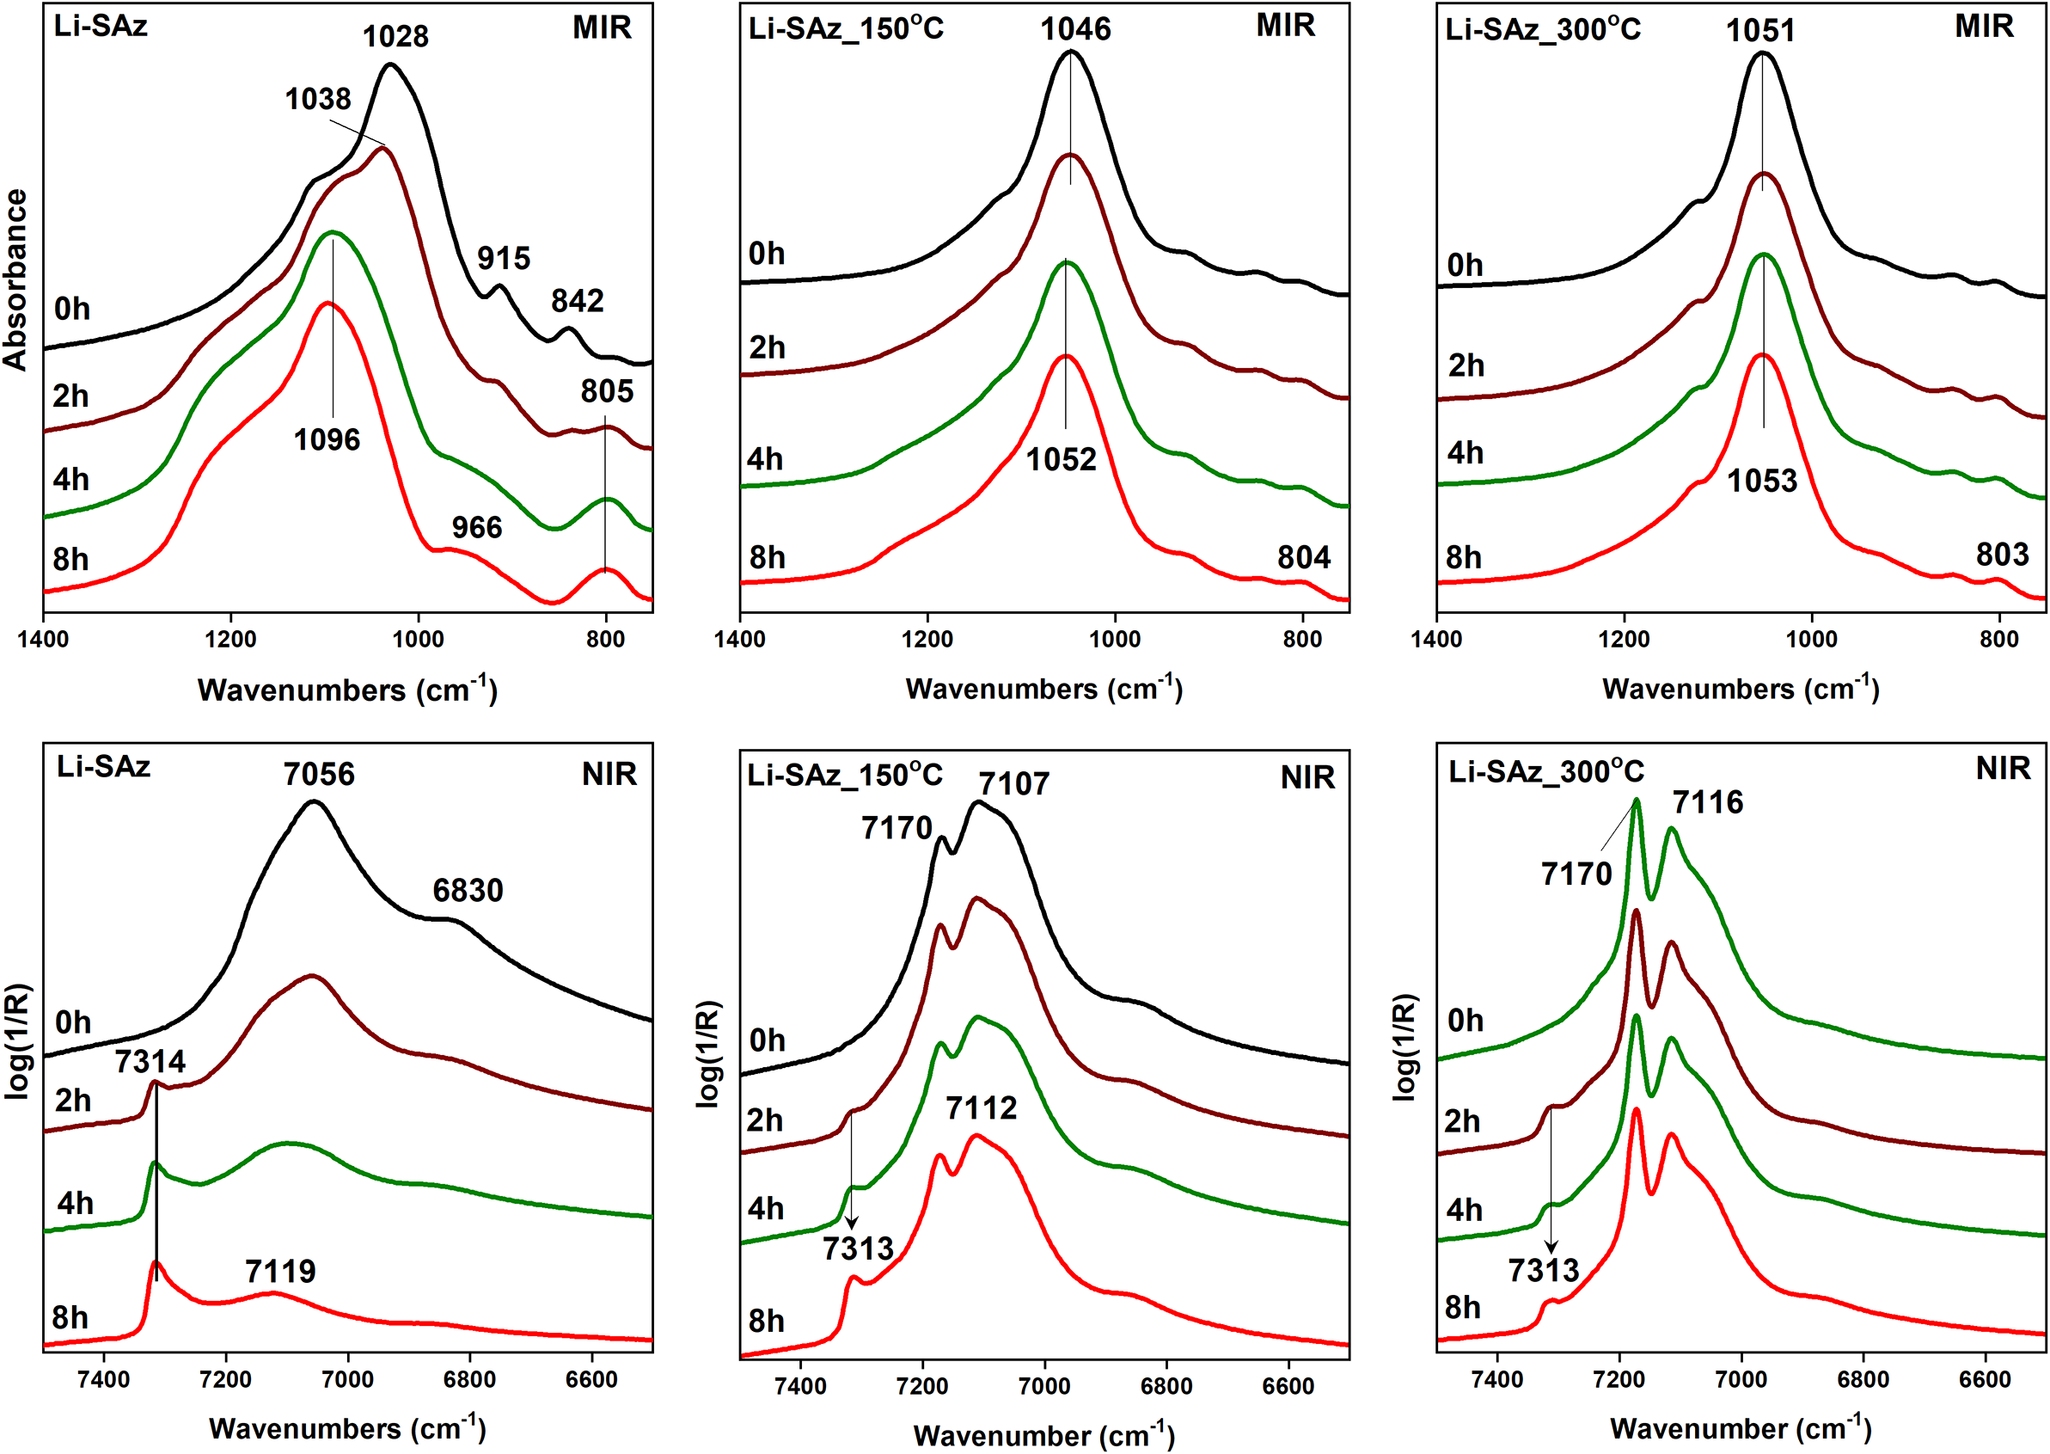
The creation of non-swelling layers in reduced-charge Li-SAz-1 slows their dissolution in 6 M HCl compared to unheated Li-SAz-1 (Fig. 7). While the MIR spectra of unheated acid-treated Li-SAz showed a shift of the νSi–O band up to 1096 cm–1 after 8 h of treatment, a smaller shift of the νSi–O band by 6 cm–1 for Li-SAz_150°C and a negligible shift by 2 cm–1 for Li-SAz_300°C was observed (Fig. 7). The NIR spectra of Li-SAz_150°C and Li-SAz_300°C revealed a significantly lower intensity of the Si–OH band at each time of HCl treatment than Li-SAz confirming that a loss of the expandable character of montmorillonite substantially reduced the dissolution rate of the samples (Pálková et al., Reference Pálková, Madejová and Righi2003).
Dissolution of kaolinites
Kaolinite is the main component of kaolins, raw materials used in a variety of industrial applications (Harvey and Lagaly, Reference Harvey, Lagaly, Bergaya, Theng and Lagaly2006; Murray, Reference Murray2000). The physical, chemical, structural, surface and porous properties of a kaolinite determine the applications for which it is suitable. These properties can be modified significantly by acid leaching (Abdalqadir et al., Reference Abdalqadir, Gomari, Pak, Hughes and Shwan2024; Komadel, Reference Komadel2016; Makó et al., Reference Makó, Senkár, Kristóf and Vágvölgyi2006; Mustapha et al., Reference Mustapha, Yusuff and Dim2023; Temuujin et al., Reference Temuujin, Burmaa, Amgalan, Okada and MacKenzie2001; Turki et al., Reference Turki, Frini-Srasra and Srasra2022). The susceptibility of kaolinites to decompose in inorganic acids is affected, in addition to the same parameters as for smectites (i.e. concentration of acid, temperature, time of treatment), also by degree of their structural order or “crystallinity”. The effect of the structural ordering of two kaolinites of different crystallinity on their dissolution rate in 6 M HCl at 95°C for various times up to 36 h were studied by Pentrák et al. (Reference Pentrák, Madejová and Komadel2009). The NIR and MIR spectra of untreated and HCl treated, well-ordered Gold Field (GF, Pugu Hills, Tanzania) and less-ordered KGa-2 (Warren County, Georgia, USA, obtained from the Source Clays Repository of The Clay Minerals Society) kaolinites are shown in Fig. 8. The NIR spectrum of well-ordered GF kaolinite shows three 2νOH bands at 7166, 7116, and 7064 cm–1 (Fig. 8A,a) and four νOH bands at 3695, 3669, 3652, and 3620 cm–1 in the MIR region (Fig. 8B,a). In contrast, only two well-resolved bands at 7171 and 7065 cm–1 (Fig. 6A, c) and three bands at 3695, 3652, and 3620 cm–1 (Fig. 6B,c) could be observed for less-ordered KGa-2 kaolinite. The spectra of both kaolinites showed great similarity over the 1400–400 cm–1 region, where the bands assigned to the Si–O stretching, OH bending, and Si–O bending bands appeared (Fig. 8C). The IR spectra of GF kaolinite treated in HCl for 36 h revealed no changes in the OH overtone (Fig. 8A,b) or OH stretching (Fig. 8B,b) regions compared to the untreated sample, reflecting minimal decomposition of the kaolinite structure. Similarly, the positions of the Si–O stretching and OH-bending bands of kaolinite GF did not change after 36 h of dissolution (Fig. 8C,b). However, the pronounced increase in the intensity of the band at 1105 cm–1 indicated the creation of amorphous silica upon acid treatment. The greater solubility of less-ordered KGa-2 in HCl than that of GF became evident mainly in the Si–O stretching region (Fig. 8C,d). The low intensity of the bands at 1035 and 1011 cm–1 (νSi–O of kaolinite) and the very intense band at 1105 cm–1 confirmed that amorphous silica dominated in the KGa-2 dissolved over 36 h. The results presented by Pentrák et al. (Reference Pentrák, Madejová and Komadel2009) confirmed that the degree of ordering of kaolinites affected their dissolution rate upon acid treatment.
NIR (A) and MIR (B, C) spectra of untreated, well-ordered Gold Field kaolinite (a) and less-ordered KGa-2 kaolinite (c) and samples treated in 6 M HCl at 95°C for 36 h (b, d). The figure is based on data provided by Pentrák et al. (Reference Pentrák, Madejová and Komadel2009).

The effect of the organic modification of smectites on the rate of decomposition in acids
The replacement of natural, inorganic, exchangeable cations by organic cations, most often alkylammonium, affected decomposition of smectites in inorganic acids. The combination of acid-activation with alkylammonium intercalation provides not only samples which are an effective source of protons but organic cations also allow the interactions in non-polar media (Breen et al., Reference Breen, Watson, Madejová, Komadel and Klapyta1997). The size of an organic cation has a considerable effect on the decomposition rate of smectites in HCl (Madejová et al., Reference Madejová, Pálková and Jankovič2012; Pálková et al. Reference Pálková, Hronský, Jankovič and Madejová2013). The changes in the MIR and NIR spectra of HCl-treated organo-clays prepared from tetramethylammonium (Me4N), tetrapropylammonium (Pr4N), and tetrapentylammonium (Pe4N) salts and montmorillonite SAz-1 are given in Fig. 9. The presence of organic cations confirmed the δCH bands appearing in the 1500–1350 cm–1 region and a complex 2νCH band between 6020 and 5800 cm–1. The MIR spectra showed that the bands disappeared after 2 h of reaction in 6 M HCl for Me4N-SAz and Pr4N-SAz in contrast to Pe4N-SAz where they are still visible even after 8 h of treatment. Gradual modification of the layered structure of organoclays into a three-dimensional framework proved a shift of the complex Si–O stretching band to higher wavenumbers with time of treatment (Fig. 9-upper part). The most pronounced shift was observed for Mnt with smaller Me4N and Pr4N cations. A shoulder near 1090 cm–1 observed for Me4N-SAz after 2 h indicated partial decomposition of the layers. Less intense modification of the spectral shape for Pr4N-SAz revealed a slower rate of dissolution. The final position of the Si–O band above 1095 cm–1 confirmed the almost complete decomposition of the Mnt structure after 8 h of reaction for both samples. A different trend was evident for Pe4N-SAz; after 8 h of treatment the Si–O stretching band was shifted to just 1043 cm–1. This position indicated the presence of both a layered structure and a three-dimensional amorphous silica framework (Fig. 9).
MIR and NIR spectra of HCl-treated organo-clays prepared from tetramethylammonium (Me4N), tetrapropylammonium (Pr4N), and tetrapentylammonium (Pe4N) salts and montmorillonite SAz. The figure is based partly on data provided by Madejová et al. (Reference Madejová, Pálková and Jankovič2012).

The overlapping bands in the 6020–5800 cm–1 region, related to the 2νCH overtones, were more sensitive to the presence of organic cations than δCH bands (Fig. 9). The 2νCH overtone was also detected in the Pr4N-SAz treated for 8 h, though its intensity decreased significantly compared to the untreated sample. Only a slight decrease in the 2νCH band intensity observed for Pe4N-SAz dissolved for 8 h confirmed that almost all Pe4N cations persisted throughout the HCl treatment. The intensity of the 2νSi–OH band near 7316 cm–1 increased with time of treatment while only the low intensity found for Pe4N-SAz treated for 8 h confirmed the minor modification of the Mnt structure. Both the MIR and NIR spectra confirmed that the size of the organic cation affected significantly the decomposition of SAz-1 in HCl. Large Pe4N cations covering the inner and outer surfaces of the montmorillonite prevented access by the protons to the layers and thus protect the Mnt from the acid attack (Madejová et al., Reference Madejová, Pálková and Jankovič2012). Greater resistivity of the Mnt layers was also reported by Pálková et al. (Reference Pálková, Zimowska, Jankovič, Sulikowski, Serwicka-Bahranowska and Madejová2017) for samples containing the tetrabutylammonium and -phosphonium cations. In the present study, temperature-dependent IR spectra were collected using a high-temperature cell and the changes in the spectra were evaluated.
Identification of acid sites using pyridine as a probe molecule
The interaction of clay minerals with inorganic acids changes significantly their properties including surface acidity. The activation of a clay mineral by inorganic acid results in the formation of active sites on the material that are essential for other reactions and applications of acid-treated clays. One of the main methods of characterization is using IR spectroscopy (e.g. Ndé et al., Reference Ndé, Tamfuh, Clet, Vieillard, Mbognou and Woumfo2019). The formation and the types of acid sites can be determined by MIR spectroscopy using pyridine as a probe. Pyridine, a base of moderate strength, can be adsorbed physically and/or chemically on a clay-mineral surface. These species are identified easily and distinguished by examination of the 1700–1400 cm–1 region, where the absorption bands related to ring stretching vibrations (skeletal modes) of pyridine are located. The MIR and NIR spectra showing the interaction of pyridine with SAz-1 montmorillonite dissolved in 6 M HCl for 4 h at 80°C (SAz-4h) are presented in Fig. 10 (Madejová et al., Reference Madejová, Pálková and Jankovič2015; Pálková et al., Reference Pálková, Hronský, Jankovič and Madejová2013). Before pyridine adsorption the Mnt was dried overnight at 50°C. Afterward a sample was placed in a desiccator and exposed to pyridine vapor for 48 h at 25°C (SAz-4h-py). Later the sample was heated to 170°C to follow the possible desorption of pyridine (SAz-4h-py-170). The IR spectrum of SAz-4h showed only a broad band at 1632 cm–1 due to the deformation vibrations of H2O (Fig. 10a). After adsorption of pyridine, five well-resolved bands appeared (Fig. 9b). The most intense bands at 1594 and 1442 cm–1 corresponded to the hydrogen-bonded pyridine, the band at 1580 cm–1 corresponded to physisorbed pyridine. The absorption at 1490 cm–1 indicated the presence of weak BA sites while the band at 1539 was assigned to N+–H deformation vibration of pyridinium cation. The pyridine molecules accepted protons from H3O+, present in the sample after HCl treatment, confirming thus the existence of strong BA sites on the SAz-4h surface. Upon heating at 170°C, weakly bonded pyridine molecules were released almost completely from the sample, as confirmed by a significantly decreased intensity of the bands at 1594 and 1442 cm–1. Only pyridine interacting with BA sites remained adsorbed on the SAz-4h surface (Pálková et al., Reference Pálková, Hronský, Jankovič and Madejová2013).
MIR and NIR spectra of: (a) SAz-1 montmorillonite dissolved in HCl for 4 h (SAz-4h), (b) of the same sample after sorption of pyridine at 25°C (SAz-4h-py), and (c) after desorption of pyridine at 170°C (SAz-4h-py-170). Spectra in both MIR and NIR regions were measured using the DRIFT technique. The figure is based on data provided by Pálková et al. (Reference Pálková, Hronský, Jankovič and Madejová2013) and Madejová et al. (Reference Madejová, Pálková and Jankovič2015).

The interaction of pyridine with acid-treated samples was also studied using NIR spectra. The spectrum of SAz-4h (Fig. 10) showed two well-developed bands in the 2νOH region characteristic of acid-treated montmorillonite. The presence of pyridine in the SAz-4h-py sample confirmed unambiguously the complex 2νCH band at 5998 cm–1 composed of the overlapping contributions of the overtones and combinations of the CH-stretching vibrations. After pyridine adsorption, only a very weak shoulder near 7305 cm–1 related to the 2νSi–OH was recognized in the spectrum of SAz-4h-py. Si–OH groups, as weak Brønsted acid sites, formed hydrogen bonds with the nitrogen of pyridine. The 2νSi–OH band of H-bonded SiOH groups was shifted to lower wavenumbers and contributed to the broad complex band near 7093 cm–1. Upon heating at 170°C, a clear restoration of the intensity of the 2νSi–OH band confirmed that pyridine H-bonded to silanol groups was released upon heating. In addition, the intensity of the 2νCH overtone decreased due to the desorption of H-bonded pyridine (Madejová et al., Reference Madejová, Pálková and Jankovič2015).
Part II: Acid-activated clays in industry and in environmental protection. Review of select recent papers
The interest in acid-activated clays as catalysts and adsorbents continues because they constitute widely available, inexpensive materials which have proven effective in a number of significant reactions and processes. The acid-activated clays and clay minerals as a solid source of protons have been a useful commodity for many decades as documented not only in the review by Komadel (Reference Komadel2016) but also in more recently published papers. Some, utilizing FTIR spectroscopy for the characterization of the acid-treated products, will be discussed below.
Acid-activated clay minerals as catalysts
The commercial acid-modified clays, e.g. montmorillonites K-10 and K-30 (Germany), have been used as catalysts for various organic reactions. The isomerization of α-pinene oxide in the presence of commercial montmorillonites K-10 and K-30, acid-treated illite (L-1) and synthetic aluminosilicate was studied by Sidorenko et al. (Reference Sidorenko, Kravtsova, Aho, Heinmaa, Kuznetsova, Murzin and Agabekov2018). The IR spectra revealed that illite also contained a kaolinite admixture. The structural changes to illite upon HCl treatment and the acid sites in catalysts were identified by FTIR spectroscopy. The concentration of Lewis (LA) and Brönsted (BA) acid sites on the surface of K10, K30 was greater than for acid-treated L-1 illite. On other hand, the LA/BA ratio for L-1 was greater than that of commercial clays, increasing with an increase in the HCl concentration. The main reaction products were campholenic and iso-campholenic aldehydes. The formation of a relatively large amount of iso-campholenic aldehyde was not typical of other types of catalysts, and thus some researchers considered that acid-treated illites were of interest as catalysts for selected purposes.
Zeynizadeh et al. (Reference Zeynizadeh, Rahmani and Ilkhanizadeh2019) reported the synthesis of micro/meso porous acid-activated montmorillonite K10 (H+-K10) and its application as solid acid catalyst for highly efficient and environmental benign synthesis of biscoumarin materials via tandem Knoevenagel–Michael reaction of aromatic aldehydes with 4-hydroxycoumarin in a mixture of EtOH-H2O (1:1) at room temperature. The IR spectrum of H+-K10 showed the same spectrum as K10 (not acid-modified commercial K10 montmorillonite); however, due to the acid-activation the position of the Si–O stretching band was shifted from 1054 cm–1 (for K10) to 1080 cm–1 (for H+-K10), i.e. the position characteristic of intense acid-treated montmorillonite. The catalytic activity of H+-K10 for synthesis of biscoumarin was significantly greater (95% yield) than of the initial K10 (45% yield) although montmorillonite K10 is already acidic. Moreover, the results showed that the H+-K10 nanocatalyst can be reused for six consecutive cycles without significant loss of catalytic activity, very important point for industrial and practical purposes.
An environmentally friendly mesoporous aluminosilicate (meso-AS) catalyst was prepared from Na-montmorillonite by controlled HCl acid activation for various time intervals by Phukan et al. (Reference Phukan, Bhorodwaj, Sharma and Dutta2018). Esterification of acetic acid with sec-butanol to produce sec-butyl acetate was carried out systematically. Catalytic activity with up to 89% conversion with nearly 100% selectivity toward sec-butyl acetate was observed. After pyridine adsorption the MIR spectra showed a characteristic band for Brönsted acid sites at 1549 cm–1. Researchers attributed esterification of sec-butanol with acetic acid primarily to Brönsted acidity instead of Lewis acidity. The catalysts were also found to remain active for several runs without significant loss of activity.
The dehydration of monoethanolamine (MEA) is an important industrial reaction for synthesizing valuable nitrogen-containing chemicals such as ethyleneimine (EI), piperazine (PIP), triethylenediamine (TEDA), ethylenediamine, pyrazine, and alkypyrazine. Huang et al. (Reference Huang, Song, Liu, Yang, Lu, Liu and Liu2019) investigated, for the first time, the acid-activated montmorillonite (Acid-Mnt) as a catalyst for the gas-phase dehydration of MEA. Acid-Mnt catalysts were synthesized via the activation of Na-Mnt in aqueous HNO3 solution for 4–24 h followed by calcining at 450–1150°C for 4 h. The FTIR spectra of Acid-Mnt catalysts revealed bands at 473 cm–1, 800 cm–1, and 1100 cm–1 due to the Si–O–Si vibrations of amorphous silica. The activation of HNO3 led to the formation of the acidic sites on the surface of Mt, which catalyzed the dehydration of MEA. However, with increase in the activation time or calcination temperature, the number of acidic sites over the Acid-Mnt decreased clearly, resulting in a decrease in the catalytic activity of the dehydration of MEA. Thus, Acid-Mnt is a promising catalyst for selectively synthesizing different N-containing fine chemicals via the MEA dehydration reaction.
A new idea for the design of solid acid catalysts with cooperative Brönsted and Lewis acidity for the dehydration of glycerol to acrolein was proposed by Yu et al. (Reference Yu, Zhu, Tong, Deng, Fu, Huang and Zhou2022). The conversion of glycerol to acrolein in the gas phase is an attractive reaction for valuable applications in biodiesel-derived glycerol. Montmorillonite (Mnt)-based solid acids were prepared by H3PO4 treatment and an impregnation method with a solution of ammonium metatungstate (AMT) as WO3 precursor followed by calcination at various temperatures. The catalysts were also characterized by FTIR spectra using KBr pellets and DRIFT FTIR spectra of adsorbed pyridine. The IR spectra of Mnt showed all the characteristic bands of montmorillonite. Upon activation of H3PO4, the intensities of the 845, and 3624, 918, 845, and 520 cm–1 bands, related to the νOH, δAlAlOH, AlMgOH and Al–O–Si vibrations, respectively, decreased as a result of the partial depletion of the octahedral sheets. For the acid-treated Mnt, DRIFT spectra of chemisorbed pyridine showed both Brönsted and Lewis acid sites. The absorption band at 1540 cm–1 was attributed to the pyridinium ions bonded to Brönsted acid sites, the 1490 cm–1 band indicated the presence of both pyridinium ions and pyridine bonded to Lewis acid sites, and the 1446 cm–1 band was considered to result from the overlapping bands of pyridines connected to Lewis acid sites and linked by hydrogen bonding. The phosphoric acid treatment of Mnt created Brönsted and Lewis acid sites and led to increases in specific surface areas, porosity, and acidity. WO3 species influenced total acidity, acid strength, the numbers of Brönsted and Lewis acid sites, and the catalytic performances.
Phenolic compounds, present in the effluents from numerous industries, are very toxic pollutants even at low concentrations. Advanced oxidation processes which convert phenolic compounds to less toxic end products (such as carbon dioxide, water and carboxylic acids) in the presence of other, harmless, small-molecular-weight intermediate products have attracted the attention for many years. The properties of raw bentonite, containing mostly montmorillonite, and bentonite activated with a hot solution of H2SO4 at various concentrations, were tested in catalytic wet peroxide oxidation of phenol by Balci (Reference Balci2019). The IR spectra showed that the characteristic bands of montmorillonite were not affected much at low acid concentrations, while the structure became very sensitive to acid attacks at higher concentrations. The intensity of the bands related to the AlAlOH, AlMgOH, and Al–O–Si vibrations decreased with treatment at high acid concentration. The intensity of the Si–O band at 800 cm–1, characteristic of amorphous silica, became dominant with the acid activation in parallel to acid strength. The DRIFT spectra of raw and acid-activated bentonite after pyridine adsorption were compared. The enhancement in both Lewis and Brönsted acidities, significant increases in H–bonding to the structure with acid concentration was observed. Acid treatment produced material with good structural properties and with high surface acidity. Bentonite activated with 2 M H2SO4 was tested in catalytic wet peroxide oxidation of phenol together with raw bentonite. Around 96% phenol removal was achieved after 135 min at a reaction temperature of 50°C while the raw bentonite was not an efficient catalyst.
Zhao et al. (Reference Zhao, Cai, Zhang, Wang and Liu2022) reported the preparation and characterization of a Fenton-like catalyst for the removal of methylene blue (MB). Some of dyes are toxic, causing severe harm to human health and the environment. It is important, therefore, to find a suitable method to handle dye wastewaters. Fenton, composed of Fe2+ and H2O2, is used widely to treat dye wastewater, as it could produce enough hydroxyl radicals to oxidize most organics in water. To improve its properties, Fenton can be loaded on porous materials such as clay minerals. In this work Ca-montmorillonite (Ca-Mnt) was activated by HNO3 under various temperatures to obtain acid-activated Mnt (Acid-Mnt). Then iron was introduced on Acid-Mnt (Fe/Acid-Mnt) via the impregnation method using Fe(NO3)3·9H2O as a precursor. The structural and compositional changes of the Acid-Mnt were determined based on the variation of the IR spectra. The intensities of the bands related to the vibrations of hydroxyl groups bonded to the octahedral atoms as well as of the Al–O–Si band decreased gradually or disappeared with increasing treatment temperature. The IR spectrum of the Acid-Mnt-104 (i.e. Mnt activated at 104°C) presented only the bands for amorphous silica (1090, 796, and 465 cm–1) indicating that the layered structure of Mnt was almost completely destroyed. The amount of acidity and the surface area of the catalyst had a noticeable effect on the removal efficiency of MB. The synergistic effect between the excellent adsorption ability and the OH generated by H2O2 activated by Fe/Acid-Mnt could lead to enhanced removal efficiency of MB in the Fenton-like system. The greatest removal efficiency of MB (97.8%) exhibited Fe-supported Acid-Mnt activated by HNO3 at 100°C.
In addition to montmorillonite, the utilization of vermiculite, a 2:1 expandable clay mineral, as a catalyst was also studied recently. Marosz et al. (Reference Marosz, Kowalczyk and Chmielarz2020a) tested two series of modified vermiculites as catalysts for dehydration of methanol and ethanol. The first series of catalysts were obtained by treatment of raw vermiculite with a solution of nitric acid (0.8 M) at 95°C for 2, 8, or 24 h. The second series of catalysts was obtained by intercalation of vermiculite with alumina pillars. Prior to the pillaring process, raw vermiculite was treated with nitric acid (0.8 M HNO3, 95°C, 4 h) followed by complexation of Al3+ and Fe3+ cations, leached from clay layers, with oxalic acid or citric acid. Such treatment was necessary to increase the ion-exchange properties of vermiculite and therefore to improve the efficiency of vermiculite intercalation with alumina pillars. Acid-activation of parent vermiculite resulted in a decrease in the intensity of the bands related to the vibrations of OH groups reflecting the leaching of the central atoms from the octahedral sheets of vermiculite. Moreover, a shift of the νSi–O band from 954 to 995 cm–1, the appearance of a broad shoulder near 1060 cm–1 and the increase in the intensity of the band at 800 cm–1 proved the partial transformation of the tetrahedral sheets into the three-dimensional framework of amorphous silica. The IR spectra recorded for the alumina-pillared vermiculite samples were similar to spectra of the acid-treated vermiculites. An increased intensity of the band at 670 cm–1 was suggested by Marosz et al. (Reference Marosz, Kowalczyk and Chmielarz2020a) to be a result of aluminum addition and the formation of alumina pillars. Moreover, a shoulder at 1060 cm–1 exhibited lower intensity than for acid-treated samples. The authors related it to the partial removal of amorphous silica aggregates during the pillaring process. The catalytic activity of alumina-pillared vermiculites was found to be significantly greater than the acid-treated samples due to the contribution of stronger acid sites, possibly located on the alumina pillars.
Besides swelling clay minerals (montmorillonite and vermiculite), the use of IR spectroscopy in catalytic studies of non-swelling clay minerals such as kaolinite or fibrous clay minerals (sepiolite and palygorskite) was also reported in recent years. El-Aal et al. (Reference El-Aal, Said, Abdallah and Goda2022) prepared two series of catalysts based on kaolin clay calcined at 400°C (K400) and tested them for methanol dehydration to dimethyl ether (DME) at relatively low temperatures. The first series was obtained by treating kaolinite with H2SO4 at different percentages, the second by intercalating kaolinite with WO3 and ZrO2 at different percentages. The interface interaction potentially responsible for promoting catalytic activity was analyzed based on the vibrational bands of the unmodified and modified kaolin K400. After the kaolin was modified by low ratios of H2SO4 (1–3 wt.%), a small variation in the band patterns was observed. However, with a further increase in the acid loading (5–15 wt%), some bands appeared, disappeared, or shifted, and their intensities also changed. The νOH bands decreased gradually due to the dehydroxylation process caused by the penetration of protons into the kaolin layers. Moreover, the modification of kaolin by H2SO4 influences also the position and the intensities of the OH-bending and -stretching vibrations of water, which may have a role in the catalytic dehydration of methanol to DME. No apparent change in the intensities and the positions of the characteristic bands of kaolin treated with WO3 and ZrO2 were observed. The absence of the bands assigned to WO3 and ZrO2 in the spectra of modified samples indicated that both oxides were very dispersed in the kaolin framework. The acidity of the catalysts was determined through the dehydration of isopropyl alcohol and by FTIR spectra after pyridine adsorption. The kaolin structure and acidic properties were influenced significantly by the ratios of the modifiers used. The catalyst containing 10 wt.% of ZrO2 exhibited an excellent 98% conversion with 100% DME selectivity. The results obtained revealed that it was possible to prepare highly active, eco-friendly, and cost-effective catalysts based on natural kaolin for their application in acid-catalyzed reactions.
The potential of acid-activated sepiolite to catalyze dehydration of glycerol to acrolein was investigated by Zhou et al. (Reference Zhou, Li, Zhuang, Wang, Tong, Yang, Lin, Li, Zhang, Ji and Yu2017). Series of catalysts were prepared from purified natural sepiolite treated with hydrochloric acid of various concentrations (0–8 mol/L) at 80°C, followed by drying at 100°C. The effect of texture and the acidity of the hydrochloric acid-activated sepiolite catalysts on the catalysts’ performance was investigated. The comparison of the FTIR spectra of natural sepiolite and acid-activated sepiolite catalysts revealed that the activation had several effects, such as the elimination of a portion of the zeolitic water in the tunnels, partial removal of magnesium and aluminum from the octahedral sheets of sepiolite, breakage of the Si–O–Si bonds in the tetrahedral sheets, and the formation of amorphous silica. Pyridine adsorption followed by in situ IR spectroscopy was conducted to distinguish the type of acidity on the surface of the natural sepiolite and the HCl-activated sepiolite catalyst. The characteristic adsorption bands of pyridine at 1448 cm–1, 1492 cm–1, 1545 cm–1, 1614 cm–1, and 1623 cm–1 were identified in the MIR spectra. A strong absorption band at 1448 cm–1 suggested the presence of Lewis acid sites; the band at 1545 cm–1 signified the presence of Brönsted acid sites. The intensities of these bands were stronger for acid-activated sepiolite than for natural sepiolite indicating that the amounts of both Lewis and Brönsted acid sites increased for the hydrochloric acid-treated sepiolite samples. Compared with the natural sepiolite, the HCl-activated sepiolite catalysts exhibited increased catalytic activity for the gas-phase dehydration of glycerol to acrolein. A 92.9% conversion of glycerol, a 59.4% selectivity of acrolein, and a 55.2% yield of acrolein were obtained over the sepiolite catalyst activated with a 2 mol/L HCl aqueous solution.
Marosz et al. (Reference Marosz, Kowalczyk, Gil and Chmielarz2020b) reported on the catalytic performance of natural, unpurified clay mineral samples of allophane, palygorskite, and sepiolite and thermally and acid-treated samples for dehydration of methanol to dimethyl ether (DME) as well as dehydration of ethanol to diethyl ether (DEE) and ethene. The changes in the chemical and structural compositions as well as surface acidity of the samples were analyzed and correlated with their catalytic performances. The IR spectra of natural clays and samples calcined at 500°C for 6 h were compared with samples acid treated in 0.8 M HNO3 at 95°C for 2, 8, or 24 h followed by temperature treatment at 500°C for 6 h. Similar changes in the spectra of all three clay samples were observed. Thermal treatment of allophane, palygorskite, and sepiolite resulted in the disappearance of the bands related to the stretching and bending vibrations of water molecules. Thermally treated samples showed a significant decrease in the intensities of the bands related to the stretching and bending vibrations of the structural OH groups suggesting partial dehydroxylation of their structure. On the other hand, acid treatment of all three clay minerals resulted in only a slight modification of their spectra compared to thermally treated samples. A significant increase in the BET surface area, pore volume, and surface concentration of acid sites for the sepiolite and palygorskite series was detected, while the allophane series showed the opposite trends. Despite that, allophane series gave the best results for both methanol and ethanol dehydration among all the samples studied.
Acid-activated clay minerals as adsorbents
Acid activation of clay minerals results in an increase in the specific surface area and porosity of materials; such materials are thus used frequently as adsorbents of different species. Acid-activated bentonites have been utilized for years as bleaching earths for a range of bleaching and decolorizing applications (Komadel, Reference Komadel2016 and the references therein; Siddiqui, Reference Siddiqui1968). Their main use is to remove not only color bodies but also other undesirable constituents from vegetable and industrial oil as well as from waste-waters. In the following section, the selected recent papers using IR spectroscopy for the characterization of adsorbents are introduced.
Acid-activated clays from various parts of Ethiopia were applied by Yassin et al. (Reference Yassin, Shiferaw and Tedla2022) to the bleaching of edible oil. Bleaching of edible oil removes coloring pigments, peroxides, and other impurities which cause poor quality and instability in edible oils. The FTIR spectra of untreated and 25% H2SO4-treated clay samples confirmed the presence of montmorillonite, kaolinite, and quartz. No significant change in the intensities and positions of the bands near 1030 cm–1 (Si–O stretching) and 530 cm–1 (Al–O–Si bending) suggested that the original clay structure was still preserved. The results showed that all samples activated with H2SO4 had greater bleaching efficiency compared to the clays activated with HCl and HNO3 under similar conditions. Acid-activated clays revealed the potential to improve the flavor, taste, and shelf life of the oil.
Wastewater from textile and other industries which involve dyes are a serious health hazard for human, animal and plant life. An efficient adsorbent is required to remove contaminants from wastewaters, therefore. The most important dyes are azo dyes as they account for 65–70% of total dye produced worldwide and are used widely in the textile industry. Sarma et al. (Reference Sarma, SenGupta and Bhattacharyya2018) reported the use of K10 montmorillonite (Mnt) and 0.25 M and 0.5 M H2SO4-treated Mnt for removal of the anionic azo dyes Crocein orange G (COG) and Procion red MX5B (MX5B) from water. The experimental techniques used for the characterization of the prepared materials showed that the clay mineral structure remained mostly intact after acid treatment at the conditions selected for study. The position of the Si–O stretching band near 1053 cm–1 observed for raw Mnt confirmed partly acid-activated montmorillonite. No significant changes in the position of the Si–O stretching and Al–O–Si and Si–O–Si bending bands after H2SO4 treatment proved that there were no further structural changes. However, the surface impurities were removed and increase in the surface area, pore volume, and CEC was observed. Acidic pH used in adsorption process favored the adsorption of both dyes reaching maximal values at pH 2.0 for both dye. Acid treatment of K10-Mnt showed 23.45 and 15.67% increases in adsorption capacity for MX5B and COG, respectively. In summary, the montmorillonite studied and its acid-treated forms could be used effectively to remove various anionic azo dyes from water.
The effects of thermal (250°C), acidic (H2SO4), and alkaline (NaOH) modification of smectite clay (BC) from the Belchatow lignite deposit in Poland on the adsorption of anionic dyes Reactive Red 198 (RR 198) and Acid Red 18(AR 18) were compared by Pajak (Reference Pajak2021). The IR spectra confirmed that in addition to the main smectite component, the BC also contained kaolinite (~3695 cm–1), calcite (1448 cm–1), and quartz (800 and 792 cm–1). The AlAlOH and AlFeOH bending bands at 921 cm–1 and 873 cm–1, respectively, reflected partial substitution of Al with Fe in the octahedral sheets. Thermal treatment influenced mainly the total specific surface area (SSA) and the porosity of samples, while the chemical modifications affected the changes in total SSA, porosity, and the chemical composition.
The IR spectrum of H2SO4-modified BC (BC-H2SO4) revealed the disappearance of the AlAlOH and AlFeOH bands and an intensity decrease of the 536 cm–1 band due to decomposition of the octahedral sheets. Furthermore, the 1448 cm–1 peak from calcite disappeared as a result of the chemical reactions of CaCO3 with H2SO4. Adsorption of dyes was investigated by batch experiments at room temperature, a wide range of initial dye concentrations, and an adsorbent dose of 50 g. The dye RR 198 was bound in noticeably larger amounts than the dye AR 18, by both the natural and the modified clay. The largest amounts of both anionic dyes were removed by BC-H2SO4. The results obtained suggested that the dyes were probably bound through chemisorption, by forming hydrogen bonds between Si–OH and Al–OH groups in the clay and –NH, –NH2, and –OH groups in the dyes.
The influence of wet milling as a pretreatment step to the acid activation of vermiculite was investigated by Węgrzyn et al. (Reference Węgrzyn, Stawiński, Freitas, Komędera, Błachowski, Jęczmionek, Dańko, Mordarski and Figueiredo2018). Acid treatment was performed using HNO3 of various concentrations and the adsorption properties of the prepared materials were tested using a cationic dye Astrazon Red FBL 200%. Grinding of vermiculite resulted in fragmentation of the material’s particles, but did not alter significantly the crystallinity, chemical composition, or specific surface area of the material. The finely ground material was more susceptible to acid leaching which caused decomposition of the layers, leaving materials with significantly decreased crystallinity and comprised mainly of amorphous silica when higher concentrations were applied. The ATR-FTIR spectra of the acid-activated materials were typical of vermiculites that hand experienced acid leaching. The characteristic bands of vermiculite decreased in intensity and a series of new bands associated with amorphous silica appeared. By applying fine grinding, it was possible to obtain materials with similar adsorption capacities using an acid solution with much lower concentration than the original one.
Wastewaters contaminate with heavy metals has become an significant global problem which threatens human health and the environment. Egyptian bentonite was activated with H2SO4 (Selim et al, Reference Selim, Rostom, Youssef, Abdel-Khalek, Abdel Khalek and Hassan2020) of various concentrations and with thermal treatment up to 900°C and these improved its performance for adsorbing Pb2+ and Zn2+ from aqueous solution. Acid activation increased both the surface area and the average pore volume of the samples. The decreased intensities of the bands attributed to the OH vibrations of octahedral atoms confirmed decomposition of the layered structure. The increase in the H2SO4 concentration also resulted in a decrease in bands associated with the adsorbed water at 3426 cm–1 and 1642 cm–1. Acid activation followed by thermal activation provided more porous clay than that treated with acid only. The adsorption efficiency of dually treated bentonite increased with increasing both the initial ions concentration and the bentonite dose. The maximum Zn2+ and Pb2+ removals, at an adsorbent dose of 25 g/L and pH 6.2, was 99% and 99.67%, respectively.
Besides bentonite, other types of clay rocks or clay minerals were also used in studies of the acid-activation process. The adsorption properties of kaolinite/muscovite clay modified with H2SO4 and NaOH for the removal of Pb(II) ions from aqueous media was studied by Tetteh et al. (Reference Tetteh, Ofori, Quashie, Jääskeläinen and Suvanto2022). Natural clay contained 67.5% of kaolinite and 32.5% of muscovite. The effects of contact time, pH, ionic strength, and the mass of adsorbent were studied. The IR spectrum of untreated clay showed all characteristic bands of the vibrations of the OH and Si–O groups of kaolinite, the dominant mineral in the sample. The absorption bands of mica were not mentioned as they overlapped with more intense bands of kaolinite. Tetteh et al. (Reference Tetteh, Ofori, Quashie, Jääskeläinen and Suvanto2022) discussed briefly changes in the IR spectra upon treatment declaring a slight decrease in band intensities compared to the spectra of untreated sample. The observed minor changes revealed high resistance of kaolinite structure towards acid and alkali handling. However, the adsorption studies disclosed that activated materials were effective at the removal of Pb(II) ions from aqueous media. The alkali-activated samples had the greatest adsorptive capacity followed by the acid-activated clay.
The studies reported in this section so far showed the application of acid-treated clays as single-functional adsorbents. However, wastewaters, as a side effect of industrialization, are often simultaneously contaminated by more than one organic and inorganic species. Therefore Yang et al. (Reference Yang, Zhu, Chen, Fu, He, Zhu and He2020) studied a new multi-functional adsorbent based on montmorillonite (Mnt), aiming to remove simultaneously hydrophobic organic contaminants (HOC) such as nitrobenzene, oxyanion contaminants such as phosphate, and heavy metals, e.g. Cd(II), present in water. Organo-montmorillonite (OMnt) was prepared by intercalation of cetyltrimethylammonium bromide (CTMAB) in an amount corresponding to 50% of the CEC of Mnt. OMnt was then activated in nitric acid (AOMnt) and impregnated in Fe(NO3)3 solution to produce Fe-composite. The IR spectroscopy provided evidence about the change in the surface functional groups after acid activation and Fe impregnation. The characteristic bands related to the stretching (2926 and 2854 cm–1) and bending (1477 cm–1) vibrations of CTMA were observed not only in the spectrum of OMnt, but also for AOMnt and Fe-AOMnt. Their presence indicated that intercalated CTMA+ endured acid activation and Fe introduction. The bands at ~1035 cm–1 (νSi–O) showed no obvious change in the patterns of Mnt and OMnt, but that of AOMnt was clearly broadened by two emerging bands at ~1043 cm–1 and ~1110 cm–1 confirming partial destruction of the Mnt layers upon acid treatment and creation of porous nanosilica (PNS). Introduction of the Fe hydroxides did not alter the shape of spectra in Fe-AOMnt. The acid activation increased the pore volume and specific surface area and uniform distribution of Fe hydroxides on AOMnt was accomplished. The adsorption experiments revealed that Fe-AOMnt was able to remove effectively and simultaneously, nitrobenzene, phosphate, and Cd(II) in the multi-contaminant system. The nitrobenzene was adsorbed on hydrophobic CTMA+ cations present in the interlayer spaces of Mnt, while Cd(II) formed ternary surface complexes (≡Fe–P–Cd) on the adsorbed phosphate.
The acid-treated clays can also be used in less traditional applications, e.g. for adsorption of air pollutants, organic reagents or drugs. In addition to bentonites, the utilization of other clays and clay minerals has also been reported in the literature during recent years. HCl-activated palygorskite is a promising candidate for the adsorption of volatile organic compounds in practical applications and this was explored by Zhu et al. (Reference Zhu, Zhang, Wang, Wen, Su, Zhu, He and Xi2018). The effect of acid treatment on the structure and surface properties of palygorskite was investigated by various experimental techniques including FTIR spectroscopy. The IR spectrum of untreated palygorskite showed the complex band at 1651 cm–1 assigned to the OH-bending vibration of adsorbed water (1630 cm–1) and water coordinated to Al or Mg ions at the edges of the 2:1 layers (1660 cm–1). With increasing HCl concentration, the intensity of the 1660 cm–1 band decreased as a result of the release of the OH groups bound in the MgO6 octahedra at the edges of the channels. A slight decrease in the intensity of the band at 910 cm–1 (δAlAlOH) indicated a partial depletion of the palygorskite structure. The complex Si–O stretching band with four more or less resolved bands at 1193, 1123, 1034, and 988 cm–1 was not significantly altered with treatment confirming a good resistance of palygorskite to acid. The structure of palygorskite withstood treatment with the acid concentration as high as 7 mol/L. Acid activation, however, significantly enhanced the surface area and porosity of the mineral. The best toluene adsorption capacity was determined for a sample treated in 5 mol/L. This sample can be regenerated readily by thermal desorption and has exhibited reproducibility after six cycles.
Chloroanilines are used widely in the production of polymers, rubber additives, dyes, pharmaceuticals, and pesticides. These toxic compounds have a large tendency to accumulate in the environment and a low natural biodegradability. An effective techniques for removing chloroanilines from aqueous solutions is adsorption. Halloysite acid-activated with H2SO4 at various temperatures (23–100°C) for removal of aniline and chloro-substituted anilines from aqueous solutions was investigated by Szczepanik et al. (Reference Szczepanik, Słomkiewicz, Garnuszek, Rogala, Banaś, Kubala-Kukus and Stabrawa2017). The composition, structure, and morphology of activated halloysites were characterized using various methods including FTIR-ATR spectroscopy. The IR spectra of raw halloysite and halloysite treated with H2SO4 up to 80°C showed similar bands in both OH-stretching (395-3620 cm–1) and Si–O-stretching/bending and OH-bending (1200–400 cm–1) regions. Differences, however, were observed for halloysite activated at 100°C. The OH-stretching bands disappeared; only one broad Si–O stretching band was observed at 1090 cm–1, and the intensity of the AlAlOH and Si–O–Al was reduced to a minimum. All these changes together with the enhanced intensity of the 792 cm–1 band confirmed the increased amounts of amorphous silica for H2SO4-treated halloysite at 100°C. The acid-activated halloysite had enhanced ability to remove aniline and chloroanilines from aqueous solutions as the acid activation temperature increased. The aniline and chloroaniline removal efficiency reached a maximum for samples activated at 80°C, especially for aniline and 4-chloroaniline removal.
Halloysite was also investigated as a potential drug carrier. The possible use of modified halloysite nanotubes as a gentamicin carrier was examined by Stodolak-Zych et al. (Reference Stodolak-Zych, Rapacz-Kmita, Gajek, Rózycka, Dudek, Kluska, Rapacz-Kmita, Gajek, Rózycka, Dudek and Kluska2023) with a view to determining the usefulness of the modification in terms of the effect on the amount of the drug attached, its release time, but also on the biocidal properties of the carriers. Prior to gentamicin intercalation a native halloysite (H0) was functionalized with various methods including reaction with sulfuric acid (H1), expanded halloysite modified with sulfuric acid (H2), phosphoric acid (H3), and with ammonium persulfate in sulfuric acid (H4), sodium alkali (H5), and curcumin (H6). The MIR spectrum of H0 shows all bands characteristic of halloysite related to the vibrations of OH and Si–O groups. The modification of halloysite with sulfuric acid (H1) did not substantially affect the shape of the spectrum compared to H0. The band with a maximum at 1668 cm–1 observed for neat halloysite, indicating the presence of strongly bound structured water, was shifted and decreased in intensity for H1, which may indicate the transformation of hydrated halloysite into metahalloysite. The next three modifications (H2–H4 samples), revealed a clear reduction, or the disappearance of bands at 3624 and 3699 cm–1, proving a strong reaction of the modifiers with OH groups in the halloysite. The bands responsible for the vibrations of the Si–O–Al silica bridges or Si–O–Si silicon oxygen bridges were also significantly reduced, which was related to the elution of silicon and aluminum atoms from the mineral. FTIR spectral analysis showed that in most cases no new bonds were formed between the modified halloysite and gentamicin. Only in the samples modified with ammonium persulfate and curcumin did new absorption bands appear, which may suggest the formation of new chemical bonds. Modification of the halloysite surface affected the amount of intercalated gentamicin and its release into the surrounding environment; however, it did not significantly affect its ability to further delay drug release over time.
Conclusions
Acid activation of clays and clay minerals remains an attractive modification for research and industrial applications. This review highlights the wide range of uses for FTIR spectroscopy in studies of acid-treated clay minerals. The first part summarized some results related to the structural transformations of acid-treated clay minerals with various other conditions, based on the experiences of the present authors over a period of many years. A detailed interpretation of the IR spectra measured in traditional mid-IR but also in the less common near-IR regions provided complex information on the changes occurring in the clay minerals structure when reacted with inorganic acid. The second part reviewed the most recent studies focused on the utilization of the IR spectroscopy in studies related to the acid-activated clay minerals in catalysis and adsorption processes of pollutants. Infrared spectroscopy was applied exclusively to follow changes: (1) in the clay-mineral structure; and (2) in their surface acidity after treatment. It is evident that FTIR spectroscopy will remain one of the most important methods for the investigation of acid-treated clay minerals into the future.
Data availability
Data are available from corresponding author upon reasonable request.
Acknowledgements
The authors are grateful to all of their colleagues who participated in their studies of acid-treated clay minerals over many years. The present work was supported by the Scientific Grant Agency VEGA (Grant 2/0166/21) and by the Slovak Research and Development Agency (APVV-20-0175).
Funding
Funding sources are as stated in the Acknowledgments.
Competing interests
The authors declare that they have no known conflict of interest.



