The trend toward longer work lives has been underway for over two decades in the USA. Many factors have likely contributed to this trend, including Social Security reforms and rising education levels (Coile, Reference Coile2019). Changes in employer-sponsored pensions are another potentially critical factor. Pensions have shifted from defined benefit (DB) plans – which often contain strong financial incentives to work until the plan's early or normal retirement age and to retire thereafter – to defined contribution (DC) plans, which lack these age-based incentives. The loss of the financial incentives to retire at specific ages thus may be contributing to increased labor force participation at older ages.
Importantly, this shift in employer-sponsored pensions from DB to DC plans has been far more pronounced for private sector workers than for public sector workers, who comprise one-sixth of the labor force. The share of all private industry workers with DB plans fell from 35% in the early 1990s to 18% in 2011, while the share of state and local workers with DB plans stood at 78% in 2011 (Wiatrowski, Reference Wiatrowski2012). Most federal employees also continue to have a DB plan.
Previous work has established both the prevalence of strong age-based incentives in DB plans and their importance in the retirement decision. While this was first established in studies that focused on private sector workers (Stock and Wise, Reference Stock and Wise1990) or did not distinguish workers by sector (Coile and Gruber, Reference Coile and Gruber2007), other studies have similarly found this for public sector workers (Asch et al., Reference Asch, Haider and Zissimopoulos2005) and especially public school teachers (Costrell and Podgursky, Reference Costrell and Podgursky2009; Costrell and McGee, Reference Costrell and McGee2010). The literature estimating the impact of the shift from DB to DC pensions on retirement is more limited: Friedberg and Webb (Reference Friedberg and Webb2005) estimate that the lack of age-based incentives in DC plans leads workers to retire 2 years later on average, while Mermin et al. (Reference Mermin, Johnson and Murphy2007) attribute a fifth of the increase in the expected probability of working past age 62 over a 25-year period to the decline in DB coverage.
Thus, it is known that workers are retiring later, that a shift from DB to DC pension plans may be contributing to this trend, and the shift in pension plan type is concentrated among private sector workers. Perhaps surprisingly, however, the existing literature (to our knowledge) has not examined whether retirement trends are similar for public and private sector workers and whether changing retirement incentives by sector are contributing to differences in retirement behavior between these two types of workers.
In this paper, we aim to help fill that gap by exploring changes in the retirement incentives and retirement behavior of public and private sector workers over the past quarter-century. We begin by documenting trends over time in labor force participation at older ages by sector. We then use data from the Health and Retirement Study (HRS), linked to Social Security earning records and pension information from the HRS’ Pension Estimation Program, to estimate the financial incentives for continued work at older ages for public and private sector workers and to explore how these incentives have changed over time. Finally, we estimate regression models relating these financial incentives to retirement decisions, with the ultimate goal of using our estimates to understand how changing financial incentives may be affecting the retirement behavior of public and private sector workers.
This analysis contributes to our understanding of retirement incentives and retirement behavior by providing a comparison of public and private sector workers. While there is a substantial literature on retirement incentives and retirement, including numerous studies on public sector workers, most studies examine these workers in isolation rather than comparing their experiences to those of private sector workers; an exception is Papke (Reference Papke2019), discussed further below. This paper is also distinguished from the existing literature on public sector workers by its ability to incorporate both Social Security and private pensions into the calculation of retirement incentives; many existing studies use state or local administrative records but lack data on Social Security covered earnings. Furthermore, this paper can add to our understanding of the implications of changing pension plan type for labor force participation at older ages by extending the work of Friedberg and Webb (Reference Friedberg and Webb2005), the primary existing reference on this question, to include nearly 20 years of additional data.Footnote 1
We have several key findings. First, and perhaps surprisingly, we find that changes over time in labor force participation at older ages are generally similar for public and private sector workers. Second, our data indicate a shift from DB to DC plans and a rise in the share of workers without a pension for private sector workers, and more unexpectedly, for public sector workers as well (according to self-reported data). However, we find that public sector workers have a larger entitlement to future retirement benefits based on their work to date and also a larger financial gain for continued work at older ages, as compared to private sector workers. Moreover, this difference across sectors is growing across cohorts. Third, we find that public and private sector workers are both responsive to financial incentives for continued work at older ages. Overall, while we find that the gain to work at older ages is rising more rapidly across cohorts for public sector workers and that financial incentives affect retirement behavior, we find no evidence that diverging incentives by sector are reflected in differential aggregate retirement trends.
In the remainder of the paper, we first discuss relevant background information and literature. We then discuss the data and empirical strategy, including our measure of the financial gain to continued work at older ages, before presenting a descriptive analysis of trends in retirement behavior and incentives as well as our regression results. In the discussion, we discuss the implications of our findings for the potential connection between the shift in employer-sponsored pensions and the trend of working longer.
1. Background and literature
An overview of Social Security and employer-provided pension provisions is necessary to understand the retirement incentives discussed below. Entitlements to Social Security benefits and pensions differ by sector and (for public sector employees) by level of government. For private sector workers, virtually all employment (and self-employment) incurs an obligation to pay Social Security payroll taxes (6.2% of wages paid each by employer and employee, on wages up to $132,900 in 2019) and an entitlement to future retired worker benefits if the worker accrues 40 quarters of covered employment over her career. The benefit amount is based on the employee's 35 best years of (wage) indexed earnings, with a progressive formula applied such that the replacement rate is higher for lower-income workers. Benefits are first available at age 62 and are reduced for those who claim before the Full Retirement Age (FRA, currently age 66 and rising to age 67) and increased for those who claim after the FRA.
Private sector workers may also be eligible for an employer-sponsored pension. In 2018, 51% of all private industry workers had access to a DC plan (only), 13% had access to a DB and a DC plan, and 4% had access to a DB plan (only), while 32% had no access to a pension plan (BLS, 2018). The prevalence of DB plans does not vary much by full-time status or firm size, but is dramatically higher for unionized workers – two-thirds have a DB plan (either as their only plan or with a DC plan as well). In addition to the large shift over time from DB to DC plans, there has been a shift within DB plans to cash balance plans (Wiatrowski, Reference Wiatrowski2012), which have some features of a DC plan, such as portability (Cahill and Soto, Reference Cahill and Soto2003).
While details vary considerably across DB plans, there are several elements common to many plans. One is the requirement of a certain number of years of service (YOS) before the worker is vested and eligible to receive benefits. Most plans allow workers to claim benefits after attaining a certain age, YOS, or a combination of these, often with reduced benefits at the plan's early retirement age and full benefits at the normal retirement age. Benefits are often based on a formula that depends on YOS and final earnings or average earnings over a few years. These features can combine such that retirement wealth – the present discounted value of the future stream of pension income – evolves with additional work in a highly non-linear manner, often rising sharply at vesting and between the early and normal retirement ages and falling thereafter (Stock and Wise, Reference Stock and Wise1990; Costrell and Podgursky, Reference Costrell and Podgursky2009). By contrast, DC plans provide a uniform accrual, as the employer deposits a fixed percent of salary per year into the employee's account and/or a match to the employee's contribution. Cash balance plans also have uniform accrual.
For federal employees, retirement benefits depend on date of hire. Those hired in or after 1987 are in the Federal Employees Retirement System (FERS), a multi-tier system that includes Social Security, a DB plan, and a DC plan (Thrift Savings Plan, TSP). DB benefits for most workers are equal to 1% of average salary (over the 3 best years) times YOS and may be available as early as age 55. There is a small employer contribution to the TSP and employees may also make contributions, which are matched. Employees contribute 0.8% of pay to the DB plan and pay Social Security taxes. Federal employees hired before 1987 are covered by the Civil Service Retirement System (CSRS). They are ineligible for Social Security but receive a DB plan roughly twice as generous as the DB plan in FERS, for which they contribute 7% to 8% of pay. These workers may participate in TSP but there is no employer contribution or match.Footnote 2
State and local employees have the most variation in retirement benefits, as they may be covered by a public (employer-sponsored) pension, Social Security, or both, depending on their jurisdiction and occupation. Since 1951, states have been able to enter into ‘Section 218’ agreements (named for the relevant section of the Social Security Act) to provide Social Security benefits to public employees. While all states have such agreements, the share of public workers covered varies – in 2008, more than 90% of workers were covered in 26 states, but fewer than 50% were covered in five states, including Texas and California. Most of the 28% of state and local employees not covered by Social Security are local employees, often police, firefighters, and teachers (IRS, 2014).Footnote 3 As noted earlier, there has been little shift to DC plans in public pensions – in 2012, 91% of public pension participants had a DB plan, 7% had both a DB and DC plan, and only 2% had only a DC plan (Munnell et al., Reference Munnell, Aubry and Cafarelli2014).
A final institutional feature that can affect retirement benefits for public sector workers is the Windfall Elimination Provision (WEP). The WEP can reduce Social Security retired worker benefits for workers who are eligible for a pension from a job in non-covered employment, such as state and local workers who are not covered by Social Security on their public job but have attained eligibility for Social Security based on other jobs. The WEP limits the ability of these workers to benefit from Social Security's progressive benefit formula, which is intended to raise replacement rates for career low-income earners.Footnote 4 A related program, the Government Pension Offset (GPO) can reduce spouse and survivor benefits under similar circumstances. Gustman et al. (Reference Gustman, Steinmeier and Tabatabai2013) estimate that 3.5% of households are subject to either WEP or GPO.Footnote 5
There is a substantial literature examining the effect of Social Security and private pensions on retirement, dating back to the 1980s. As recognized by some early studies, these benefits could affect retirement decisions through both wealth and accrual effects – that is, both the present discounted value of the stream of future benefits the worker can expect to receive over her lifetime based on her work to date (‘PDV’) and the change in PDV associated with working one more year (‘accrual’) may matter.Footnote 6 Stock and Wise (Reference Stock and Wise1990) observe that working this year provides the option to work in future years that may have positive accruals, pointing to a need for more forward-looking incentive measures.Footnote 7 They develop and structurally estimate an option value model based on the change in utility arising from retiring at the optimal future date rather than today; Samwick (Reference Samwick1998) includes an option value (‘OV’) measure (the utility gain from retiring at the optimal date) directly in retirement regressions. Coile and Gruber (Reference Coile and Gruber2007) develop an alternative measure, peak value (‘PV’), that captures the change in PDV between its present and maximum future value. Their measure is similar to OV, but PV does not incorporate the gain from additional earnings and is a financial rather than a utility-based measure.
In all of these studies, retirement decisions are found to be responsive to retirement incentive measures. While most of the studies are based only on private sector workers or do not distinguish workers by sector, there is a related literature that focuses on public sector workers. Asch et al. (Reference Asch, Haider and Zissimopoulos2005) estimate retirement models using PV and OV for a sample of federal workers covered by CSRS and find that these incentive measures affect their retirement. Many of the studies focus on public school teachers, making use of administrative data from one or a few jurisdictions. Costrell and Podgursky (Reference Costrell and Podgursky2009) document ‘peaks, cliffs, and valleys’ in the retirement wealth accruals by age in six state teacher pension systems. Costrell and McGee (Reference Costrell and McGee2010) estimate retirement regressions that include accrual, PV, and PDV for Arkansas teachers and find that these measures have the expected effects. Brown (Reference Brown2013) obtains similar results in a study of California teachers that use a pension reform for identification.
The study most similar to ours is Papke (Reference Papke2019). Both studies use HRS data to estimate pension incentives for public sector workers and run retirement regressions including PV. While Papke focuses on public sector workers, she runs regressions for private sector workers also. Clarifying how the two studies differ is thus useful. A first key difference is in motivation – our paper is focused on whether retirement incentives and retirement behavior are trending differently over time for private vs. public sector workers and whether changes in incentives and in behavior are related. We therefore provide descriptive statistics on these trends and apply our regression estimates in order to answer this question. Second, we use restricted Social Security earnings records to calculate retirement incentive measures that reflect the worker's and spouse's entitlement to both Social Security and employer-sponsored pension benefits, while Papke calculates pension incentives and includes indicator variables for Social Security coverage and ‘leveling’ in the retirement regression.Footnote 8 Our analysis includes federal government workers. Finally, the findings of the two studies differ in some aspects, as discussed further below.
To summarize, the retirement benefit landscape is complex. All private sector workers have Social Security and about two-thirds have access to an employer-sponsored pension, with a major shift over time from DB to DC plans. Federal workers are in a multi-tier system that includes a DB and DC plan, and for more recent hires, Social Security. Roughly four in five state and local government workers have a public pension, nearly all of which are DB plans, and a similar fraction has Social Security coverage. Among the many differences between DB and DC plans, the most salient for our analysis is that retirement wealth accruals in DB plans often feature strong incentives to work to certain ages and retire thereafter (the ‘pull’ and ‘push’ of positive and negative accruals, in Costrell and McGee, Reference Costrell and McGee2010). Many studies find that workers are responsive to these incentives in making retirement decisions. The shift away from DB plans in the private but not public sector might therefore be expected to lead to differential trends in retirement behavior. We seek to explore whether retirement incentives and behavior are trending differently for public vs. private sector workers and whether changing incentive measures can explain changes in behavior over time.
2. Data and empirical strategy
The data for our analysis come from the HRS, a longitudinal, biennial survey of the US population aged 50 and above. Following the launch of the survey in 1992 with the HRS original cohort (born 1931–41 and then ages 51–61) and the subsequent addition of older respondents, new cohorts ages 51–56 have been introduced to the survey every 6 years (in 1998, 2004, 2010, and 2016), ensuring continual coverage of this population. We use all 13 HRS survey waves that are currently available, encompassing the years 1992 through 2016. Where possible, we draw variables from the RAND HRS Longitudinal Data 2016 (V1), and supplement this as needed with variables from the RAND HRS Fat Files.
Our analysis also makes use of three HRS restricted data sets, which can be linked to the main data. First, we use Social Security earnings records (Respondent Cross-Year Summary Earnings v4.0), which include annual earnings in covered employment for the years 1951 to 2013, to determine Social Security eligibility and benefits. Second, we use the HRS Pension Estimation Program Package (v3.1) to calculate pension entitlements. The HRS periodically collects Summary Plan Descriptions (SPDs) from the employers of HRS respondents. The pension program codes this detailed pension information and combines it with respondent data (such as salary and start year) to create a database that researchers can use to create customized pension data. We describe in more detail below how we use the Social Security and pension data to construct our retirement incentive measures. Finally, we use the Industry and Occupation Data (v4.0.1) to assist in identifying public sector workers, a process also detailed below.
The HRS has a number of important advantages for our purposes. First, the availability of detailed data on Social Security earnings and employer-sponsored pensions allow us to calculate retirement incentive measures that encompass both kinds of retirement benefits. Second, the survey includes both private and public sector workers among its respondents, in large enough numbers to allow for meaningful comparisons, and contains information that can be used to identify sector. Third, the long-running nature of the HRS allows us to explore how both incentives and behavior have been changing over time.
These advantages notwithstanding, there are some data-related challenges to our analysis. One significant challenge is that HRS only began asking respondents to identify whether their current job was in the public or private sector starting in 2006. To identify sector in earlier survey waves, we use two methods. First, if the worker says in 2006 that she has not changed jobs since the previous wave, then we apply the sector reported in 2006 to the 2004 wave, and we repeat this process for earlier waves where possible. Second, in cases where the first method cannot be applied because the worker has changed jobs over time or retired before 2006, we impute sector as follows. Using data from the 2006 to 2016 waves, we run a cross-tabulation of sector and detailed (3-digit) occupation code to ascertain the share of workers in each occupation who report that they are in the public sector. Next, we code occupations as being public sector when this share is 70% or above, private sector when this share is 5% or below, and of mixed or indeterminate sector when this share is between 5% and 70% (see Appendix Figures 1a and 1b for the frequency of occupations by fraction of workers reporting that they are in the public sector and Appendix Table 1 for the most common occupations coded as public, private, and indeterminate using this approach). Finally, we apply the occupation-level public/private flag to respondents' detailed occupation code data for 1992–2004 in order to impute sector.
Given that sector is critical to our analysis, it is worth explaining how the threshold values in our imputation process (5% and 70%) were chosen. The choice of these values involves trading off two kinds of error – requiring a higher share of workers in an occupation to be from the public (or private) sector for an occupation to be deemed public (or private) reduces the chance of assigning sector incorrectly, but raises the number of workers for whom we will not be able to impute sector. Given that roughly 23% of the HRS sample is employed in the public sector (based on self-reported data from 2006 to 2016),Footnote 9 using a 70% value means that we require a concentration of public sector workers in an occupation that is roughly three times as high as what we would see if there were no correlation between sector and occupation (e.g., if 23% of workers in every occupation were in the public sector) in order to code it as public, while a 5% value requires a much lower concentration of public sector workers in an occupation than would occur with no correlation in order to code it as private. To further support our choice of these values, in Appendix Table 2, we compare self-reported and imputed sector for waves 2006–16 and show that we assign sector correctly for 94% of private sector workers and 93% of public sector workers. In Appendix Table 3, we show that our process produces a share of public sector workers by wave that is essentially constant over time and similar across waves with and without imputations (waves 1–7 vs. waves 8–13).
A second data challenge is that Social Security and pension information is not available for all respondents. About one-quarter of respondents did not give permission for their Social Security records to be used; Haider and Solon (Reference Haider and Solon2000) find that this decision correlates ‘only weakly’ with respondents' observable characteristics. There are also respondents covered by an employer-provided pension for which the HRS was not able to obtain an SPD. Recent efforts to reduce missing SPDs have included directing respondents to ask their employer for a copy of the SPD in 2004 and using information available on government employer websites (for public sector employees) and in Form 5500 filings (for private sector employees) in 2010. As a result, rates of missing pension data have declined over time (Fang et al., Reference Fang, Brown and Weir2016).Footnote 10 We restrict our analyses to those HRS respondents who have linked Social Security data and who either are included in the HRS Pension Estimation Program (with a matched plan) or report that they do not have a pension.
As discussed in the literature review, useful retirement incentive measures may include retirement wealth (PDV) and various measures of the gain to continued work, including the change in wealth associated with working one more year (accrual), the change in wealth associated with working to the future date at which wealth is maximized (PV), and the change in utility associated with working to the future date at which lifetime utility is maximized (OV). It is useful to recall that pension accruals (the change in wealth arising from additional work due to the pension alone) and Social Security accruals (defined similarly) can be either positive or negative. Once a worker has attained eligibility for either type of benefit (e.g., reached the early retirement age), working another year generally means giving up 1 year of benefit receipt. In return, the worker may be entitled to a larger benefit through the benefit formula (if current earnings are higher than earnings that would otherwise have been used in the calculation) and/or through a more favorable actuarial adjustment for later claiming (Shoven and Slavov, Reference Shoven and Slavov2014a; Reference Shoven and Slavov2014b). For Social Security, there are also payroll taxes to be paid.Footnote 11 The net of all of these factors may be positive or negative.Footnote 12
To compute these incentive measures, we first calculate the Social Security benefit and DB pension annuity (if any) to which the worker would be entitled at each possible retirement age from 55 to 69. Next, we calculate the PDV of retirement wealth at each retirement age, discounting future benefits for time preference (at a real rate of 3%) and mortality (using life tables from the Social Security Administration).Footnote 13, Footnote 14 We assume that workers claim Social Security when they retire (or at age 62 if retiring before that age), and that they also commence pension receipt at retirement.Footnote 15 We measure retirement wealth at the household level, including the spouse's entitlement to retired worker, dependent spouse, and/or survivor benefits and to pension benefits (appropriately accounting for the probability that either/both spouses are alive in each future year) and fixing the spouse's retirement age at 62 so as to ensure that our incentive measures reflect only the gain in wealth associated with the respondent's own retirement delay. All values are reported in constant 2018 dollars.
We construct a person-year sample in which HRS respondents contribute one observation to the sample for each year between 1992 and 2015 that they are between the ages of 55 and 69 and are working at the beginning of the year.Footnote 16 Our dependent variable is retirement by the end of the year.Footnote 17 We treat retirement as an absorbing state and exclude future observations once we observe any retirement after age 55. Conducting the analysis in this way is essentially equivalent to estimating a retirement hazard model with non-parametric baseline hazard. We estimate regressions such as:
 $$Retired_{it} = PV_{it} + PDV_{it} + AGE_{it} + X_{it} + \delta _t + \varepsilon _{it}$$
where i refers to individual and t to year, Retired is an indicator variable equal to 1 if the individual retires this year, PV and PDV are incentive measures that incorporate Social Security and employer-sponsored pension benefits, AGE is a set of age dummies, and δ is a set of year dummies. X represents individual characteristics – dummy variables for sex, marital status, whether the spouse is working, education, occupation, health status, and the presence of employer-sponsored health insurance and retiree health insurance, as well as current and lifetime earnings and total assets. Because our analysis focuses on how the evolution of retirement incentives is affecting private vs. public sector workers, we estimate this model separately by sector as well as for all workers combined.
3. Results
3.1 Trends in retirement behavior
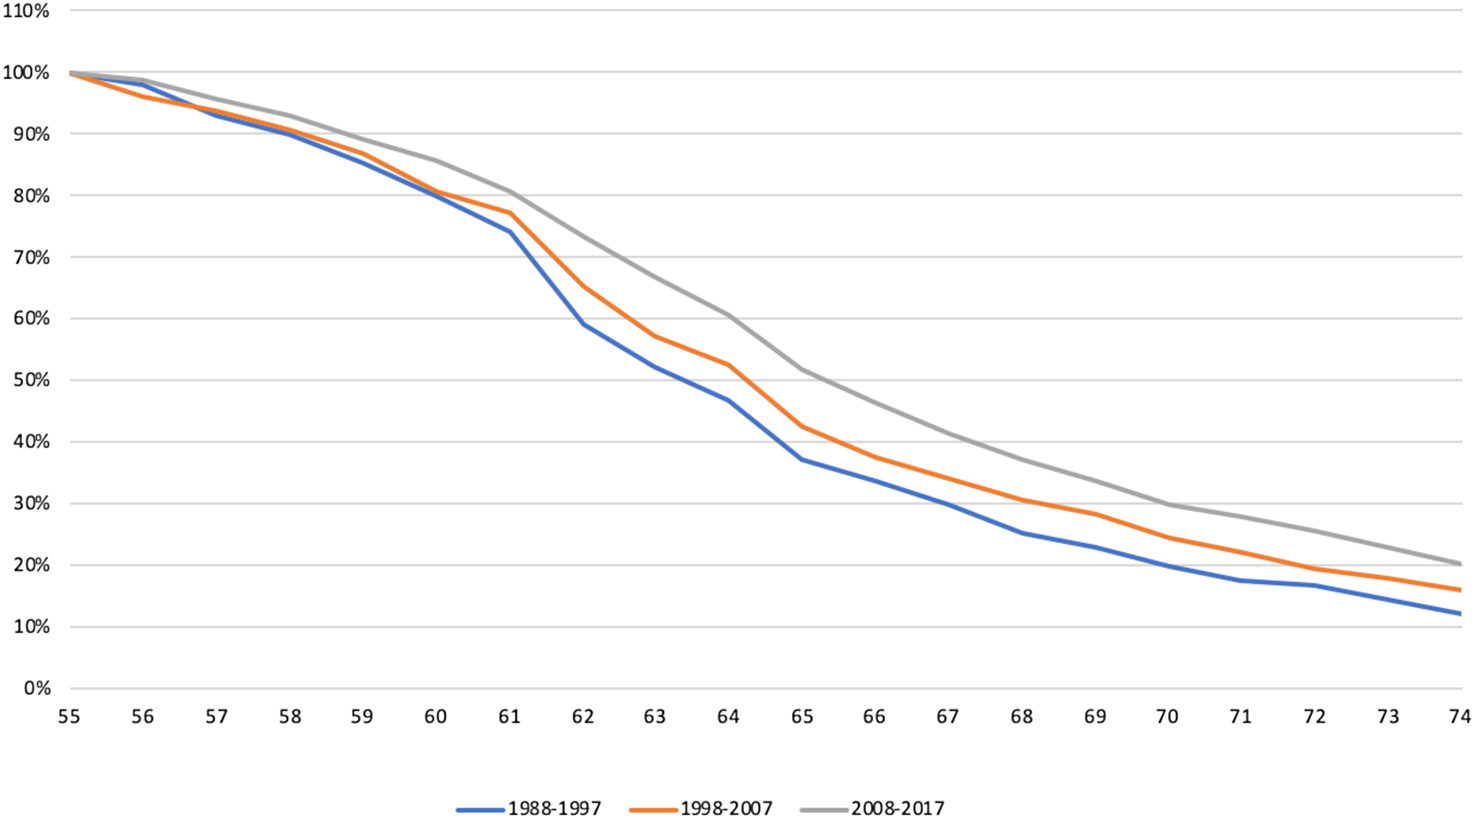
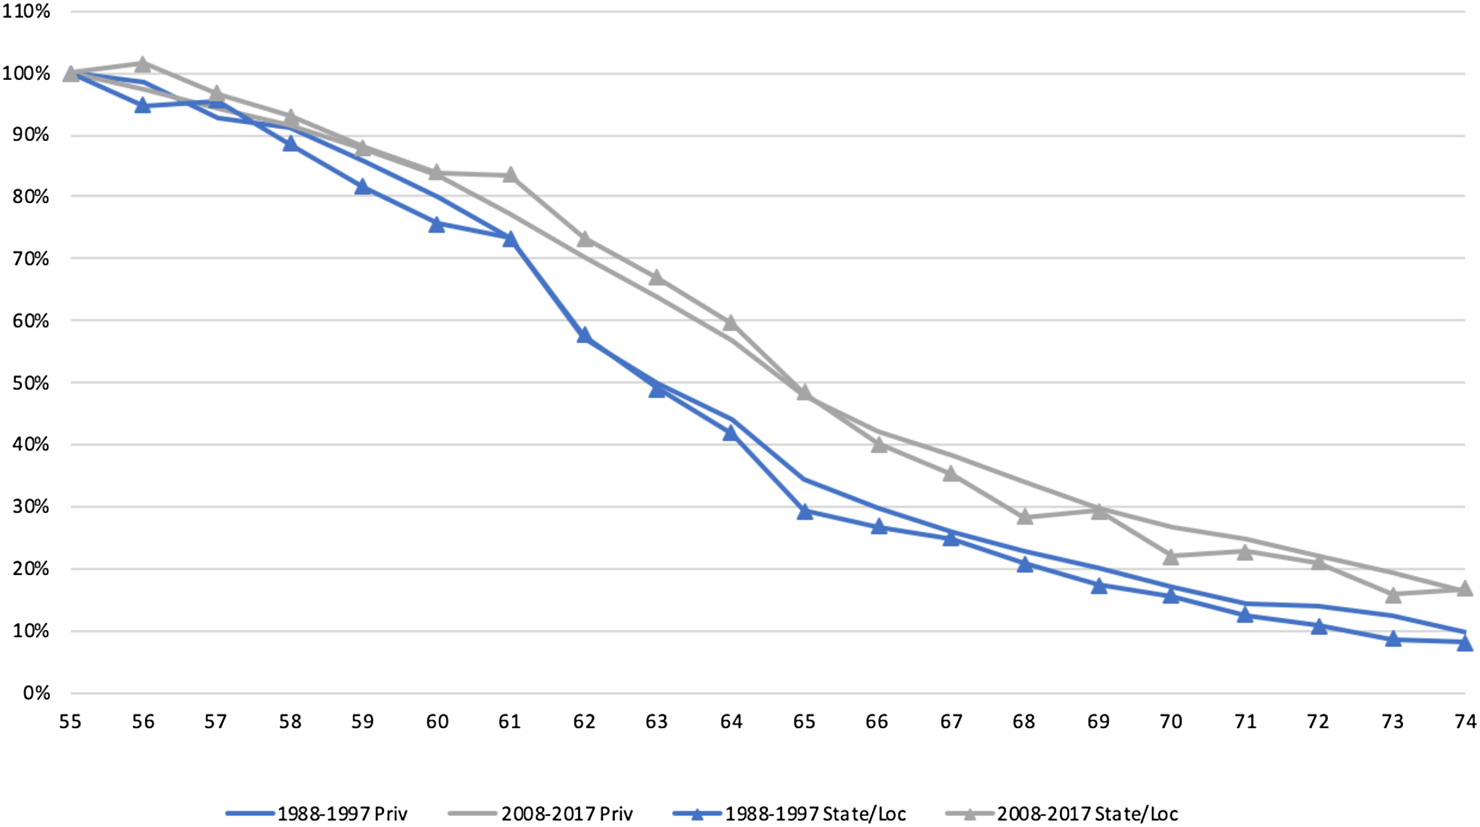
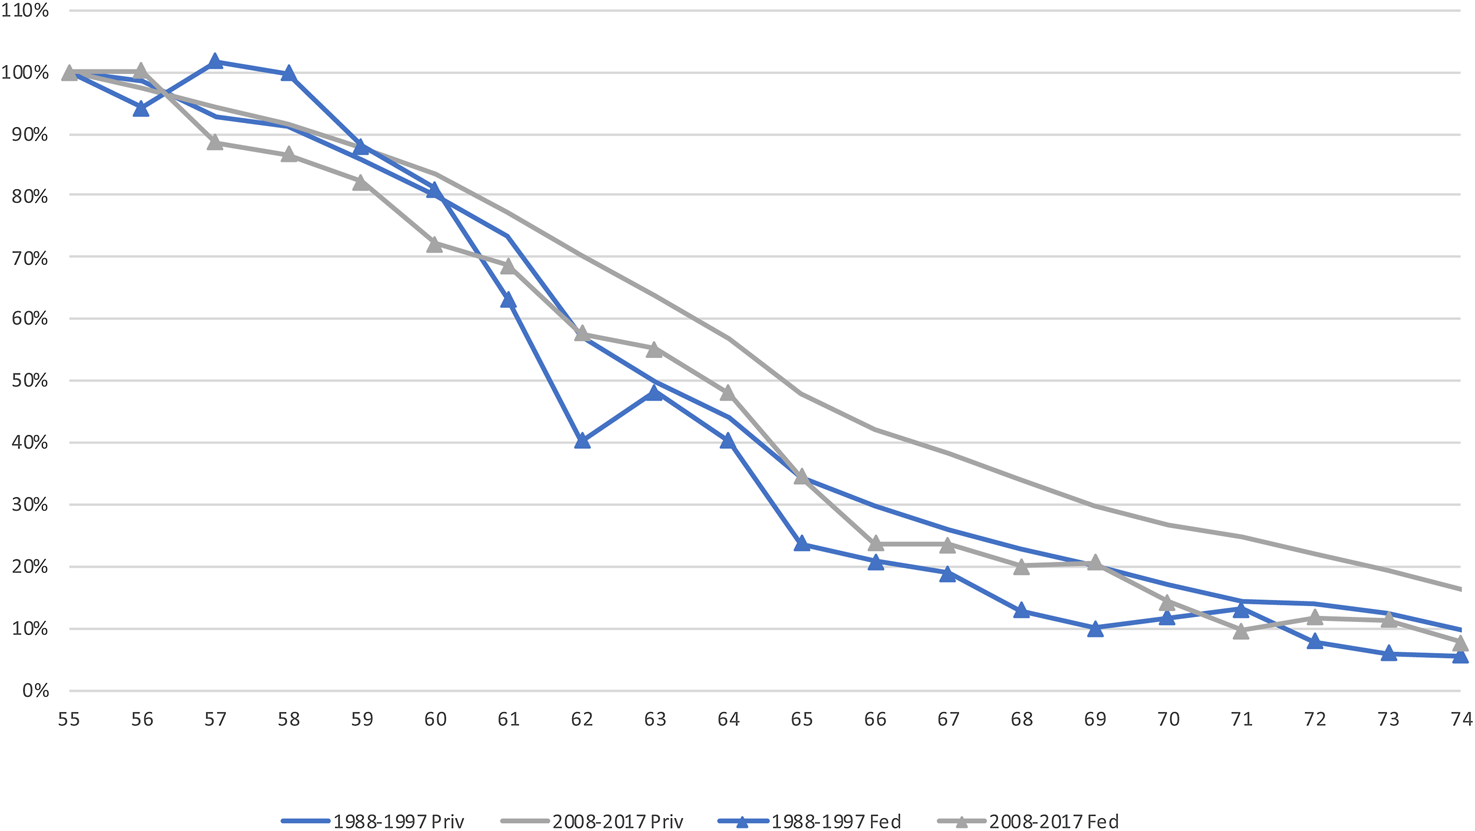
We now turn to documenting trends in retirement behavior. While it is well-known that older workers are staying in the labor force longer, trends by sector are not as well known. We begin with an analysis using data from the March Current Population Survey (CPS), a large labor force survey commonly used to calculate labor force statistics. Since CPS data are not longitudinal, establishing whether workers who are employed in the public sector at a given age, say age 55, subsequently retire earlier or later than those working in the private sector at the same age is not straightforward. To provide such an estimate, we compute an employment ‘survival rate’ by age by calculating, at each age a (after 55), the share of the population working in the public (or private) sector at age a relative to the share of the population working in that sector at age 55 (measured in the same year, or group of years).Footnote 18 Since we do not follow the same people over time but rather use the employment rate of adjacent birth cohorts at a given point in time to infer labor market persistence, these estimates may differ from what would be obtained from longitudinal data. We make these calculations for three groups of years – 1988–97, 1998–2007, and 2008–17 – to display trends over time.Footnote 19
We first show results in Figure 1 for all workers. As expected, the data show a significant increase over time in labor force participation at older ages, with the share of age 55 workers still employed at ages 62–65 rising by about 14 percentage points between the first and last decades. Figure 2 shows comparative data for private sector workers and state and local workers (omitting the middle decade for clarity). The employment profile by age among those employed at age 55 in the first time period (1988–97) is quite similar for these two types of workers, with government workers retiring only slightly earlier than private sector workers, and the increase in participation over time is also similar for the two groups. In Appendix Figures 2 and 3, we show the implied retirement hazard by age for the two groups of workers; for both, the spikes as ages 62 and 65 diminish markedly over time. Thus, while the shift away from DB pensions in the private sector might have been expected to lead to divergent retirement trends, with a larger increase in participation at older ages for private sector workers than for public sector workers due to the loss of age-specific retirement incentives for many private sector workers, such a divergence is not clearly evident from Figure 2. Figure 3 compares private sector workers with federal workers. As the federal workforce is about one-quarter the size of the state and local workforce, the survival rate for this group is noisier. However, there is some indication that federal employees retire earlier than their private sector counterparts in the first period (1988–2007) and that the trend toward worker longer is less pronounced for them.
Employment survival rate among all workers, by age and year, CPS 1988–2017.

Employment survival rate among private vs. state/local employees, by age and year, CPS 1988–2017.

Employment survival rate among private vs. federal employees, by age and year, CPS 1988–2017.

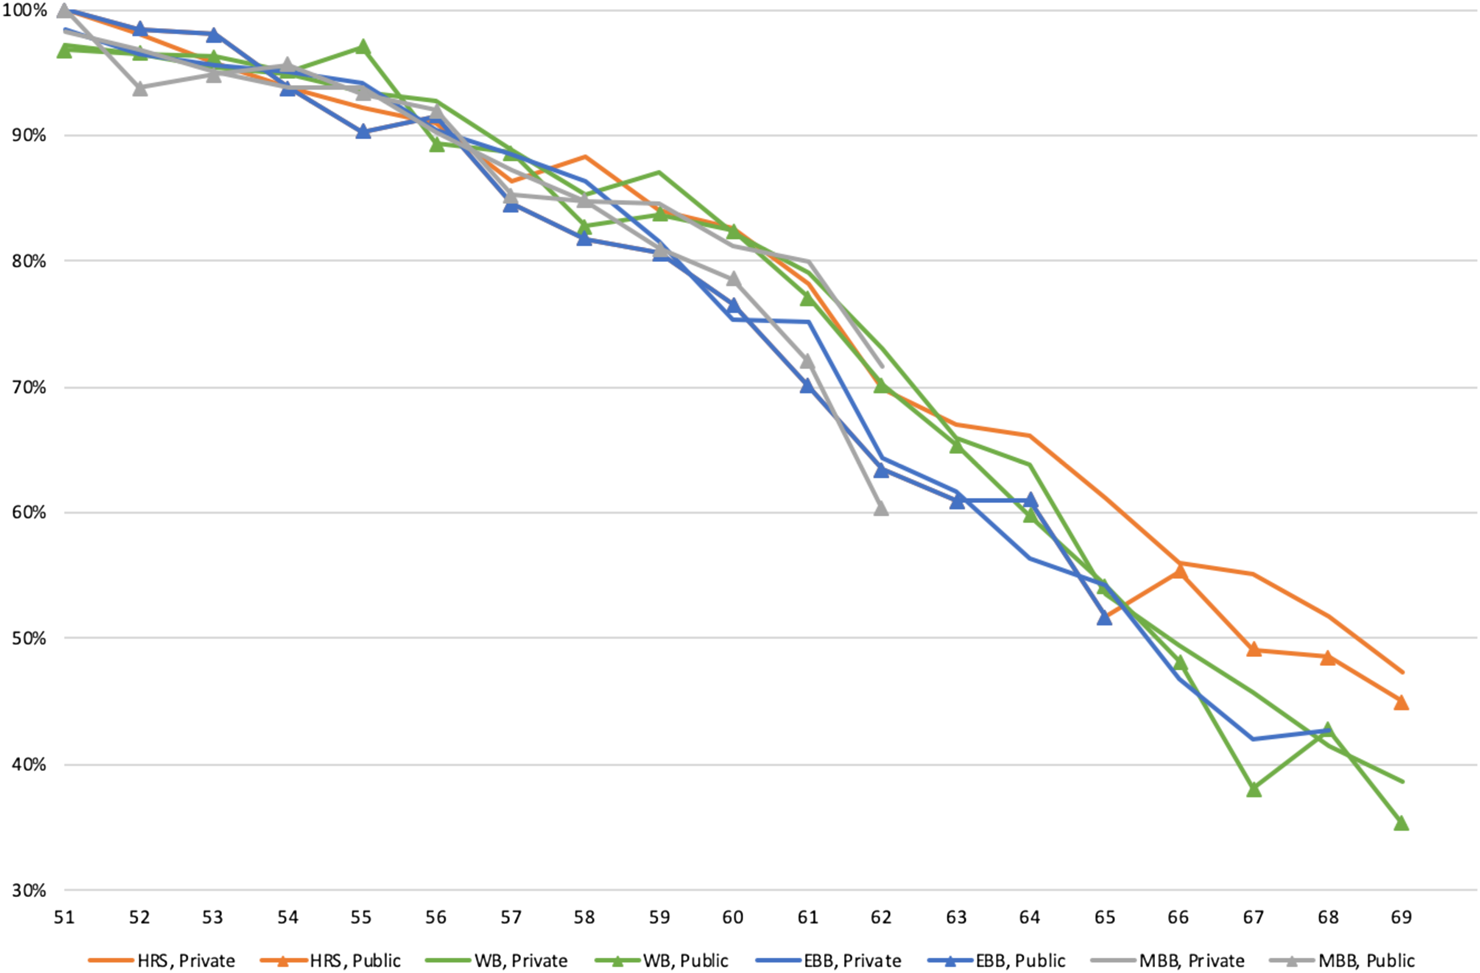
Next, we provide a similar calculation using the HRS. As the HRS data are longitudinal, we conduct a cohort-based analysis that follows the same workers over time. We focus on those ages 51–56 at their initial entry to the survey and compare four birth cohorts: the younger half of the original HRS cohort (born 1936–41), the War Babies (WB, born 1942–47), the Early Baby Boomers (EBB, born 1948–53), and the Mid Baby Boomers (MBB, born 1954–59). We restrict our analysis to those working at their first HRS survey wave, so our calculations reflect the probability of continuing to work among this group. We use data through 2016, such that cohorts are followed for between 4 and 13 survey waves, and present results separately by sector. Our outcome of interest is withdrawal from the labor force rather than retirement from the career job.Footnote 20
The results of this exercise, shown in Figure 4, do not provide clear evidence of a trend toward longer work lives among more recent cohorts, perhaps due to sampling variation arising from the relatively small sample sizes for each cohort, age, and sector. However, there is some tendency for those working in the public sector (here including federal, state, and local workers) at their first survey wave to retire sooner than those working in the private sector. For example, at age 62 the probability of work among those working at their first HRS survey wave is 3–11 percentage points lower among public vs. private sector workers, depending on cohort.
Employment survival rate by cohort and sector, HRS data.

In sum, there is some evidence that public sector workers retire earlier than private sector workers, particularly federal employees. In our analysis of CPS data, we find similar increases over time in work at older ages for state and local government workers as for private sector workers, but some indication that the increase in work of federal employees has been smaller.
3.2 Retirement incentives
Next, we examine descriptive statistics on self-reported pension coverage and retirement incentives by sector and over time. We caution that self-reports of pension coverage are subject to measurement error. Gustman et al. (Reference Gustman, Steinmeier and Tabatabai2008) report that one-third of survey respondents report a plan type that is incongruent with the type reported by their employer; while much of this error is offsetting, so that aggregate statistics from the two sources are more similar, it is not possible to know from their study whether this is also true within each sector.
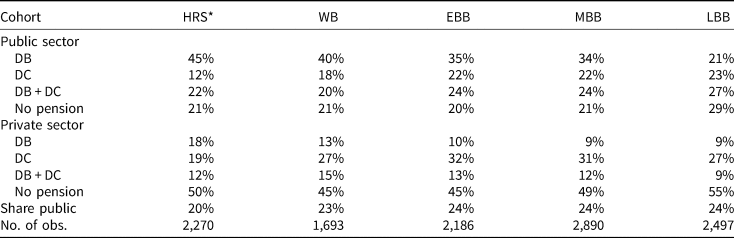
Table 1 provides data on self-reported pension coverage on the current job at the entry survey by sector and cohort for the four cohorts referenced above as well as the late baby boomers (LBB, born 1960–65).Footnote 21 Information for up to four pension plans is combined to determine whether the worker has a DB plan, DC plan, both DB and DC plans, or no pension plan. About one-quarter of each cohort is in the public sector. Among private sector workers, half of workers are not included in any pension plan, and this figure is fairly constant across cohorts. The well-known shift from DB to DC plans is evident for this group – the probability of DB (only) coverage falls by about 10 percentage points between the first and last cohorts, from 18% to 9%, while the probability of DC (only) coverage rises by a similar amount, from 19% to 27%. The share with both a DB and DC plan is roughly constant across cohorts at about 12%.
Pension coverage in HRS by cohort and sector

Notes: *HRS cohort includes those born in 1936–41 only. Sample (for all cohorts) includes only those who are working at their first HRS survey and for whom sector can be identified; see text for details. Pension plan coverage is based on self-report at the respondent's first survey, using data on up to four pension plans (RAND variables rXjcpenY for wave X and pension plan Y).
Public sector workers are much more likely to be in a pension plan – only one in five is not covered (except in the LBB cohort, where the share not covered rises to nearly three in ten). There is a dramatic decline in the share of workers with a DB plan only, from 45% in the HRS cohort to 21% in the LBB cohort. This is offset in part by a rise in the share with both DB and DC plans, and there is also a rise in the share with a DC plan only, from 12% to 23%. The share with any DB plan (DB only or DB and DC) falls by 19 percentage points between the HRS and LBB cohorts. While these changes likely primarily reflect a real shift over time toward greater use of DC plans in the public sector, their magnitude may also be influenced by the rise of cash balance plans (Munnell et al., Reference Munnell, Aubry and Cafarelli2014), which are DB plans but share many attributes of a DC plan and thus may be at greater risk of being misclassified. In short, while some caution may be warranted around the exact magnitude of these changes – about half of the change occurs between the MBB and LBB cohorts and additional data will be needed to determine whether the recent acceleration in the trend persists – there is clearly a long-term trend of public sector workers becoming less likely to have a DB plan in these data.
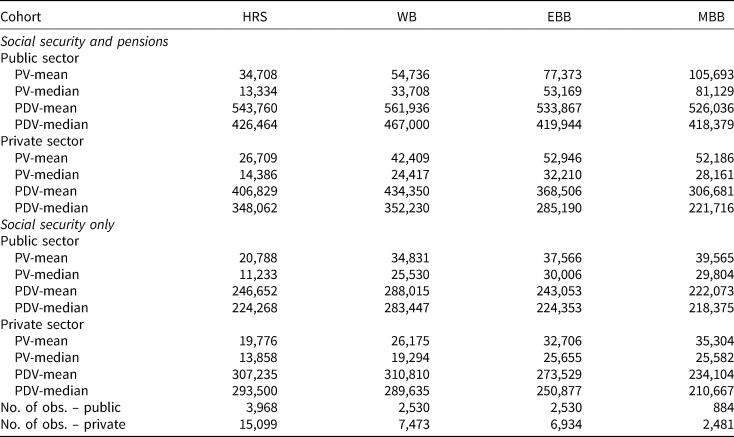
In Table 2, we report summary statistics for our main incentive measures, PV and PDV, by sector and HRS cohort for the person-year sample used in the regression analysis. We report mean and median values (in $2018), and also show values that include Social Security and employer-sponsored pension benefits (top panel) and Social Security only (bottom panel), to make it possible to infer the role of pensions. We trim the top and bottom 1% of the sample here and in the analysis below, to minimize the impact of extreme values. There may be differences in the age composition of the sample across cohorts (e.g., the MBB sample will tend to be younger).
Retirement incentives by sector and cohort

Notes: Values are reported in $2018. Sample excludes the top and bottom 1% of values. Sample is the HRS person-wave sample used in the regression analysis (except for the LBB cohort, who are included in the regressions but not in the table).
A few findings emerge from this table. In the top panel where pensions are incorporated, PDV (a household measure) is higher for respondents in the public sector than for private sector respondents. As an example, for the median respondent in the original HRS cohort, PDV is $426,000 in the public sector vs. $348,000 in the private sector. This difference by sector is apparent in both mean and median values and grows substantially across cohorts. It is worth noting, however, that our calculations exclude DC pension wealth; if DC account balances are larger for private sector workers (and growing over time), this would tend to mitigate their apparent (and growing) disadvantage in retirement resources as reported in Table 2. While the rising values across cohorts for public sector workers might seem surprising given that this group experiences some decline in the share of workers with a DB plan, this could reflect the effect of rising lifetime earnings across cohorts or increasing generosity among surviving DB plans.
In the calculations that exclude pensions (lower panel), PDV values are more similar across sectors. Mean and median values are $60,000 to $70,000 lower for public sector workers than for private sector workers in the original HRS cohort, but the gap narrows across cohorts. While it may seem counterintuitive that the PDV of Social Security benefits is fairly similar for respondents in the private and public sectors, this could reflect several factors: (1) the majority of public workers (particularly those hired more recently) are covered by Social Security; (2) our calculations do not include WEP and GPO provisions, which lower Social Security benefits for some public sector worker households; and (3) PDV is a household measure that includes the Social Security benefits of the respondent's spouse, who may work in the private sector.
PV is our primary measure of the financial incentive for continued work at older ages. Including both Social Security and pensions (top panel), median PV for private sector respondents is roughly $14,000 for the HRS cohort and grows to $28,000 for the MBB cohort, while mean values are nearly twice as large. Median PV values for workers in the public sector are similar for the HRS cohort but larger for the other cohorts, reaching $81,000 for public sector workers in the MBB cohort. Thus, the return to working until the age when retirement wealth is maximized is greater in the public sector, particularly for recent cohorts.
The important role of pensions is again made clear by comparing these results to the PV values when pensions are excluded (lower panel). As with PDV, values across the two sectors here are fairly comparable at both the mean and median. These values grow somewhat over time, reaching $25,000 to $30,000 at the median for workers of both sectors in the MBB cohort. Increases in this PV measure may reflect, at least in part, the effect of recent changes in Social Security policy, such as the rise in the Delayed Retirement Credit, which rewards delayed claiming beyond the FRA.
The picture that emerges from these tables is a complex. The patterns in pension coverage in Table 1 match national (non-age-specific) statistics in some respects, as with the decline in DB pensions in the private sector, but less so in others, as with the (even larger) decline in DB pensions in the public sector (although much of this drop occurs at the very end of our sample period). Patterns from Table 2 seem more in line with our expectations. First, workers in the public sector have larger PDV values (future retirement benefits based on their work to date) than do workers in the private sector, and we can infer that this is due to their more generous DB benefits since Social Security-only PDV measures are similar across sector. (However, the exclusion of DC wealth from these calculations means that they provide an incomplete picture of workers' financial preparedness for retirement.) Second, workers in the public sector have larger PV values, indicating that the financial gain from working until the future date when retirement wealth will be maximized is also greater for them. These gains can be substantial – $81,000 at the median for the most recent cohort in our sample. The rising PV values over time for public sector workers suggest that the reward for choosing the ‘right’ retirement age is growing for this group of workers.
3.3 Retirement regressions
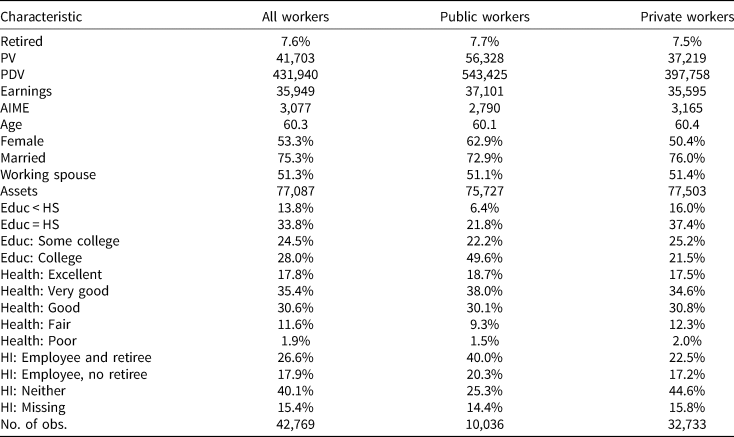
Finally, we turn to our regression results, which explore whether public and private sector workers are responsive to these retirement incentive measures. Descriptive statistics for the sample and by sector are included in Table 3. They reflect higher mean PV and PDV values for public sector workers, as discussed above, and also show that public sector workers are more likely to be female (63% of public sector workers vs. 50% of private sector workers) and college-educated (50% vs. 22%); they are also nearly twice as likely to have retiree health insurance from their employer (40% vs. 23%). The average probability of retirement (over a 1-year period) is similar for public and private sector workers, at 7.7% and 7.5%, respectively.
Descriptive statistics

Note: Values are sample means.
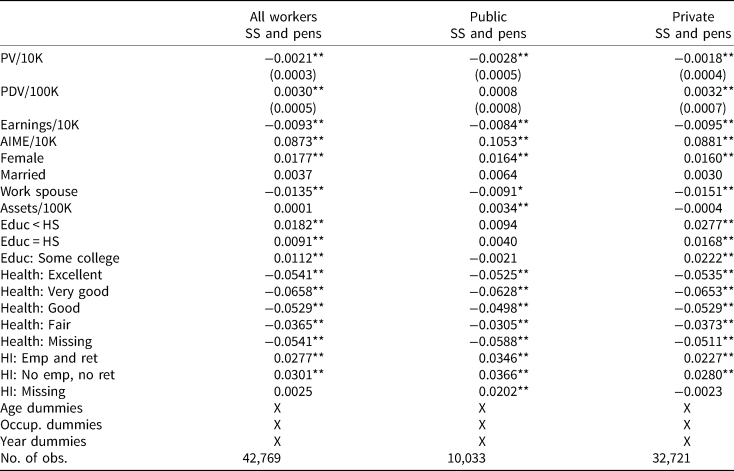
We report regression results in Table 4, estimated for all workers and separately by sector, using incentives that incorporate both Social Security and employer-sponsored pensions. In column 1, the PV coefficient has the expected negative sign, indicating that those with a greater financial incentive to continue work are less likely to retire, and it is statistically significant. In terms of the magnitude, a $10,000 increase in PV reduces the probability of retirement by 0.21 percentage points. A one-standard deviation change in PV (roughly $60,000) would thus reduce the probability of retirement by about 1.3 percentage points, or about 17% relative to the mean retirement rate of 7.6%. The PDV coefficient implies that an additional $100,000 of retirement wealth raises the probability of retirement by 0.3 points. A one-standard deviation change in PDV (roughly $330,000) would thus raise the probability of retirement by about 1.0 percentage points, or about 13% relative to the mean.
Retirement models

Note: ** (*) indicates statistical significance at the 5% (10%) level.
For public sector workers, the effect is one-third larger (a 0.28 percentage point effect per $10,000 of PV); conversely, for private sector workers the estimated effect is slightly smaller than that for all workers. The PDV coefficient for public sector workers is essentially zero, while for private sector workers it remains positive and statistically significant.
It is worth noting that changes over time in DB pension plans can introduce measurement error in the incentive variables. For private sector workers, a pension plan freeze may limit their ability to continue to accrue benefits under the plan; more rarely, a plan termination can lead to a (partial) loss of earned benefits. Fang et al. (Reference Fang, Brown and Weir2016) report that 30% of private sector HRS respondents whose DB plan was coded in 2010 are in a frozen plan. In the public sector, legal protections vary by state, but employees also face a risk of benefit cuts; Aubry and Crawford (Reference Aubry and Crawford2017) report that about one-quarter of state and local plans made benefit changes affecting current employees between 2009 and 2014. However, changes in pension benefits will lead to measurement error only if they occur after plan data was collected and coded by the HRS. A separate issue is that individuals may be less responsive to incentive measures if they anticipate a future pension freeze or benefit cut. It is difficult to assess how much of an impact this kind of uncertainty might have on the estimates.
In short, we find that both types of workers respond to our dynamic incentive measure, PV. This finding differs from Papke (Reference Papke2019), who fails to find a statistically significant effect of PV. One potential explanation is that her regressions include indicator variables for whether the individual has reached the pension plan's early and normal retirement ages, variables that may be strongly correlated with the PV measure, leaving insufficient variation to estimate its effect. A second explanation could be the inclusion of Social Security benefits in our measure.
4. Conclusion
Over the past several decades, there has been a dramatic shift in employer-sponsored pensions from DB to DC type. It has been suggested that this shift may be contributing to the dramatic increase in labor force participation at older ages, and some evidence supports this hypothesis (Friedberg and Webb, Reference Friedberg and Webb2005). However, national statistics suggest that public sector workers have been less affected by this shift. This naturally leads to the question: are there different trends in the retirement incentives of public and private sector workers that are contributing to divergent trends in retirement behavior?
Our findings are consistent with expectations in some ways but less so in others. We might have expected to see a divergence in labor force participation at older ages by sector, with any participation increases in the private sector that were being driven by pension changes not occurring to the same extent in the public sector. In fact, we find that the aggregate behavior of state and local government workers is fairly similar to that of private sector workers and that the rise in labor force participation at older ages over time has been similar in the two groups. There is some indication that federal workers may retire a bit earlier and may not have delayed retirement by as much over time.
In terms of pension coverage and incentives, in the HRS data we see a decline in self-reported DB pension coverage across cohorts (as measured at first survey appearance) for private sector workers, as expected, as well as a surprisingly large decline for public sector workers (most notably in the LBB cohort). However, we find that the financial incentive to work at older ages as captured by our PV measure is larger for public sector workers, and that this differential is growing across cohorts and is driven by differences in DB pensions rather than by differences in Social Security. In our retirement models, we find that public and private sector workers are both responsive to the financial incentive to work longer. Ultimately, however, growing differences by sector in the gain to continued work do not appear to have translated into diverging retirement behavior, as we observe similar trends in the two groups.
There are many possible reasons why the retirement behavior of public and private sector workers may have followed a parallel trend over the past several decades. Other changes across cohorts, such as improving health or rising education, may have been common to both groups and had a similar impact on the behavior of each, dwarfing any pension-driven differences in trends. It is also possible that one of these other factors may have had a bigger impact on the retirement behavior of public sector workers, offsetting any differential effect of pension changes.
Insofar as we find that the incentive to work at older ages is rising across cohorts for all workers (albeit more rapidly for public sector workers) and that both types of workers respond to these incentives, changing retirement incentives could be contributing to a trend of longer work lives among both types of workers. While some of the limitations discussed above affect our ability to project the effect of changing incentives on behavior, determining how much of the recent rise in work at older ages can be attributed to changes in employer-sponsored pensions remains an important priority for future research.
Supplementary material
The supplementary material for this article can be found at https://doi.org/10.1017/S1474747219000416.
Acknowledgements
This paper was prepared for the NBER Conference ‘Incentives and Limitations of Employment Policies on Retirement Transitions: Comparisons of Public and Private Sectors’, August 9–10, Jackson, WY. We thank John Shoven and conference participants for very helpful comments. We thank the staff at the NBER, especially Mohan Ramanujan, for enabling use of restricted HRS data.