I. INTRODUCTION
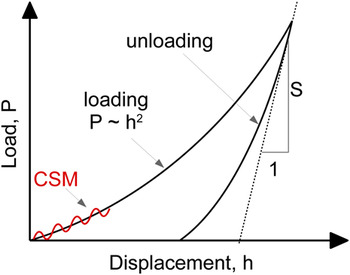
Nanoindentation is a versatile tool for characterizing mechanical properties of small volumes. In this technique, an indenter with known geometry is driven into a flat surface for several tens to hundreds of nanometers, and then, it is subsequently withdrawn. With nanoindentation, not only the hardness and Young’s modulusReference Oliver and Pharr1 are determined but also fracture toughness,Reference Li, Diao and Bushan2 strain hardening index and yield strength,Reference Antunes, Fernandes, Menezes and Chaparro3–Reference Giannakopoulos and Suresh5 residual stress,Reference Lepienski, Pharr, Park, Watkins, Misra and Zhang6, Reference Swadener, Taljat and Pharr7 and creep effectsReference Fischer-Cripps8 can be studied as well. The Oliver–Pharr methodReference Oliver and Pharr1, Reference Oliver and Pharr9 is the most common approach to derive the Young’s modulus (and hardness) from the load–displacement data shown in Fig. 1 and is based on the expression:
 $$E_{\rm{r}} = {{S\sqrt {\rm{\pi }} } \over {2{\rm{\beta }}\sqrt A }}\quad,$$
Schematic illustration of indentation load–displacement data.

where E r is the reduced modulus taking into account the Young’s modulus and Poisson ratio of the indenter. A is the contact area derived from contact depth and contact geometry, β is a correction factor, and S = dP/dh is the contact stiffness derived from the upper part of the unloading slope with a power law fit. By applying an additional small oscillating displacement (1–10 nm) to the primary displacement, the stiffness and hence the Young’s modulus can be determined continuously as a function of indentation depth; this option is called “continuous stiffness measurement” (CSM).
The analysis method proposed by Oliver and Pharr was initially developed for monolithic materials, but the method was used for characterizing heterogeneous materials as well. Nanoindentation can be used, e.g., to characterize thin films due to the small indentation depth of as little as a few nanometers. Special attention must be paid to extract film-only properties because even if the indentation depth is smaller than the film thickness, the underlying substrate may influence the measurements and cause significant errors. It is observed that the measured Young’s modulus changes from being “film dominated” to “substrate dominated” with increasing indentation depth. Several authors investigated thin films and developed analyticReference Saha and Nix10–Reference Gao, Chiu and Lee12 and empiricalReference Dörner and Nix13–Reference Jung, Lawn, Martyniuk, Huang and Hu15 models to fit the data and extract film-only properties.
Another example for heterogeneous materials is the composites, containing particles embedded in a matrix. Global loading with deep indentations and indentation sizes greater than a single microstructural entity can be used to determine the overall properties of the composite.Reference Shen and Guo16, Reference Kozola and Shen17 The possibility to position the indent with high accuracy in lateral direction enables nanoindentation to probe single microstructural entities in a multiphase material as well, such as metal–matrix composites or precipitation-hardened alloys.Reference Mussert, Vellinga, Bakker and van der Zwaag18–Reference Durst and Göken20 It has been shown by FE simulationsReference Durst and Göken20 that the hardness of elastic–perfectly plastic particles embedded in a matrix material with a yield strength ratio of two (particle/matrix) and the same Young’s modulus can be determined when the contact radius is less than 70% of the particle radius.
Investigations to quantify the Young’s modulus of single particles of a particle–matrix composite by nanoindentation, where the Young’s moduli as well as the hardness of particle and matrix differ up to two orders of magnitude, have not been performed so far to our knowledge. Applications might be 0–3 piezocomposites, Li-ion electrode materials, or abrasive papers since in all cases, ceramic particles are embedded in a polymeric matrix resulting in the mentioned difference in properties.
The aim of the present paper is to investigate the suitability of nanoindentation for characterizing a particle–matrix composite where the Young’s modulus of single particles is of interest. For the experimental part in Sec. II, we fabricated reference samples, containing ceramic particles embedded in a polymeric matrix, with well-known properties and very high Young’s modulus as well as high hardness ratios between the particles and the matrix. In Sec. III, we further performed FE simulations to study the indentation process of individual particles and to analyze the influence of the soft matrix on the calculated Young’s modulus. Based on the experiments and simulations, we present a novel framework for analyzing the data in Sec. IV.
II. EXPERIMENTS
A. Materials
PVDF 6020 (Solvay Solexis, Wilmington, DE), available in powder form, was used for the soft polymer matrix. As a reference filler material, ceramic particles of amorphous silica (SiO2) or stabilized zirconia (ZrO2/Y2O3, 87/13) were used. The fillers have sizes as large as 2–3 mm (bulk) to smaller particles of 14 and 10 μm (after grinding) for SiO2 and ZrO2, respectively. The bulk samples and the particles are from the same material batches, and the mechanical properties are assumed to be equal.
B. Sample preparation
1. Bulk material
Pieces of SiO2 or ZrO2 with a diameter of around 2–3 mm were embedded into epoxy resin (SpeciFix-20; Struers GmbH, Willich, Germany). For characterizing the matrix, a bulk piece of polyvinylidene fluoride (PVDF) was fabricated by hot pressing the powder to a tablet with 6 mm in diameter and a thickness of 2 mm. The bulk PVDF tablet was embedded into epoxy resin. Afterwards, the embedded specimens were polished using SiC paper and subsequently by a 3 μm and a 1 ?m diamond paste. Finally polishing was completed using polishing suspension. The bulk materials SiO2 and ZrO2were used as a reference to calculate the nanoindentation error in the measured Young’s modulus of single particles in the particle–matrix composites.
2. Particle–matrix composites
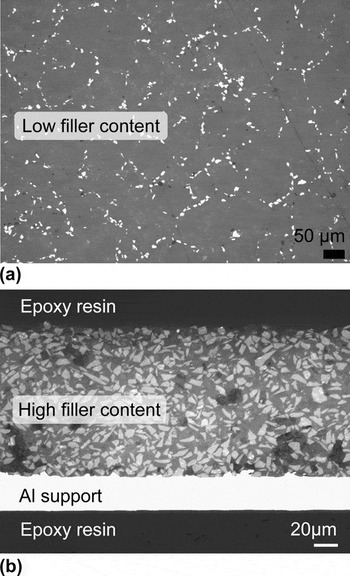
Reference samples with low (10 vol%) and high (80 vol%) filler content were also prepared and are shown in Fig. 2. The filler content was calculated according to the densities of PVDF (1.7 g/cm3), SiO2 (2.5 g/cm3), and ZrO2 (5.6 g/cm3). Porosity was not taken into account.
Light microscopy images of particle–matrix composite reference samples with ZrO2ceramic particles embedded in a PVDF polymeric matrix. (a) Low and (b) high filler content.

For the reference sample with 10 vol% filler content, the PVDF powder and the respective filler were homogenized in a first step using a ball mill with soft agate balls. The grinding process breaks up agglomerates of the particles and creates a mechanical alloying between the particle and PVDF matrix. Then, the homogenized mixture was hot pressed at 40 °C above the melting temperature of PVDF with a pressure of 300 bar to a 6-mm-diameter 2-mm-thick tablet. Finally, the disks were embedded into resin and the surface was prepared as described before.
To produce samples with 80 vol%, a PVDF binder solution (10 wt% in N-methyl-pyrrolidone) was used to prepare a slurry by mixing the filler and the PVDF solution in a SpeedMixerTM (Hausschild & Co KG, Hamm, Germany) at 2000 rpm for 5 min. The slurry was cast onto a 25-μm-thick aluminum foil using a drawdown machine with a doctor blade. Wet films were dried on a hot plate at 100 °C for 2 h. For characterizing these particle–matrix systems by nanoindentation, pieces with a diameter of 15 mm were stamped out. The stamped out piece was cut perpendicular to the direction of thickness and embedded in the resin with the cross-sectional area visible from the top view as shown in Fig. 2(b). The preparation of the surface can be found in the bulk material section.
C. Nanoindentation test procedure
The nanoindentation experiments were performed on a Nano Indenter XP (MTS Nano Instruments, Inc., Oak Ridge, TN) with a Berkovich tip. All indents were performed using the CSM option with a superimposed displacement oscillation of 2 nm and a frequency of 45 Hz. By using CSM, the material parameters, especially the Young’s modulus, can be determined continuously as a function of penetration depth and time-dependent deformation effects, which might occur for the polymeric matrix, are avoided. The strain rate was chosen to be 0.05/s. Before each series of measurements, the tip was cleaned because it cannot be excluded that pieces of smaller particles are ripped out from the matrix, remain at the tip, and influence the measurements. Positioning of the indent was done with the built-in optical microscope unit. To check whether the positioning accuracy with the optical microscope is sufficient to hit a single particle, a built-in high precision piezoscanner (Flexure Stage; PI) and the Nanosuite software (Agilent Technology, Santa Clara, CA) were used for imaging some indents in contact mode scanning with a force of 3–5 μN and a scanning speed of 10 μm/s.
D. Results and discussion
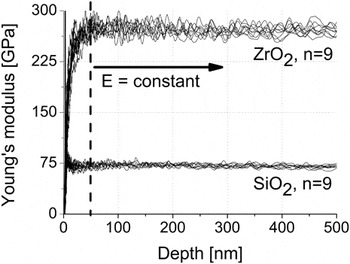
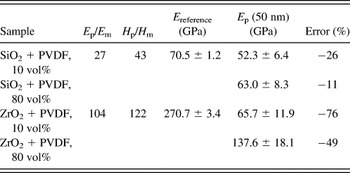
For characterizing the bulk materials, nine indents were performed using the CSM option, and the obtained Young’s modulus was constant for indentation depths deeper than 30–50 nm as shown in Fig. 3 for SiO2 and ZrO2. Results for smaller indentation depths cannot be taken into account due to falsifications caused by surface roughness, imperfections of the indenter tip, or uncertainties in determining the zero point of contact.Reference Li, Chen, Cheng and Cheng21, Reference Fischer-Cripps22 The bulk polymeric PVDF matrix has a Young’s modulus of 2.6 GPa and a hardness of 0.15 GPa, the bulk SiO2 sample has a Young’s modulus of 70.5 GPa and a hardness of 6.5 GPa, and the bulk ZrO2 has a Young’s modulus of 270.7 GPa and a hardness of 18.3 GPa. Hence, the reference samples have a Young’s modulus and hardness ratio between ceramic particles (subscript p) and polymeric matrix (subscript m) of E p/E m = 27 and H p/H m = 43 for the SiO2/PVDV composite and E p/E m = 104 and H p/H m = 122 for the ZrO2/PVDV composite.
Young’s modulus of bulk SiO2 and ZrO2 samples against the penetration depth. Nine measurements were performed for each sample. The mean values were taken as references for the SiO2 and ZrO2particles.

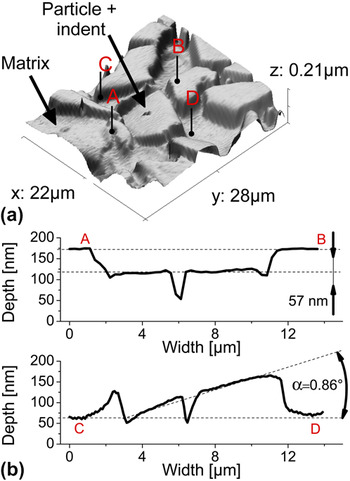
In a next step, the Young’s modulus of single embedded particles was investigated. To ensure that the indent is positioned correctly, a section around the indent was imaged in contact scanning mode during a postprocess. As it can be seen in Fig. 4(a), the accuracy of the optical set indent was high enough to hit the single particle. It can be further seen from Fig. 4(b) that the indented particle was driven into the soft matrix by 57 nm and rotated compared to the surrounding particles by an angle of 0.86°.
Indented ZrO2particle. (a) 3D surface plot of indented particle and surrounding composite material and (b) 2D surface profile of indented particle.

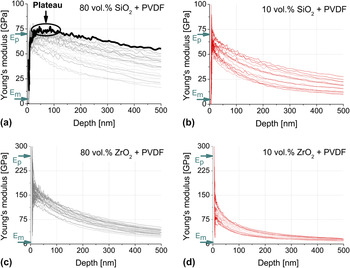
The results for the Young’s modulus are plotted in Fig. 5 and can be summarized as follows:
Young’s modulus of single SiO2 (a, b) and ZrO2 (c, d) particles against the penetration depth for samples with 80 vol% (black) and 10 vol% (red) filler content. Fifteen to thirty particles were characterized for each specimen. The Young's moduli of the bulk properties are labeled with E p (subscript p for particle) and E m(subscript m for matrix). The bold curve in (a) shows a pronounced plateau.

First, the measured modulus decreases continuously with increasing indentation depth and the properties are underestimated compared to the bulk materials. An exception are the curves of Young’s modulus for small indentation depths <50 nm; some samples show an increasing Young’s modulus value, which approaches a saturation, and others decrease to the same saturation value. These effects are also present for bulk materials caused by predominant effects at small indentation depths as mentioned earlier. Similar to bulk materials, the first tens of nanometers should be neglected. For the prepared samples and the nanoindenter used in this study, 50 nm turned out to be a good choice for the minimum indentation depth. Another exception where the Young’s modulus does not decrease continuously is the plateau seen in some measurements for SiO2 particles with high filler content [bold curve in Fig. 5(a)]. Here, the plateau is pronounced up to 100 nm and thus not affected by the mentioned effects for small indentation depths. The value of the plateau corresponds to the bulk properties of SiO2.
Second, for a fixed indentation depth, a large scatter of several tens of GPa in particles’ Young’s modulus is observed for each sample. We assume that the scattering is caused by different sizes of the indented particles. For the indents, particles with a diameter around 10 and 14 μm for ZrO2 and SiO2, respectively, were selected for the indents. However, particles’ depth cannot be measured with the optical microscope, which was used to position the indents. The particle size dependence is further investigated by FE simulations later in this paper.
Third, a higher Young’s modulus of the particles is measured for the specimens with higher filler content [Figs. 5(a) and 5(c) versus Figs. 5(b) and 5(d)]. In the authors’ opinion, the overall stiffness of the particle–matrix system is increased due to the higher filler content of hard particles giving a better support for the indentation process of a single particle.
Fourth, a higher discrepancy between the property of the particle and the matrix leads to a larger error of the determined particles’ properties compared to the corresponding bulk modulus [Figs. 5(a) and 5(b) versus Figs. 5(c) and 5(d)].
Table I summarizes the errors for the different reference samples. The error is calculated for the minimum indentation depth of 50 nm. The highest error is observed for the reference specimen with highest ratio between particle and matrix properties and for a low filler content and is as high as 76%.
Nanoindentation Young’s modulus E p for single particles in a softer matrix for different composites. The composites differ in their filler content and the ratio of particle (subscript p) to matrix (subscript m) properties. The Young’s moduli of the single particles was calculated at the minimum indentation depth h min = 50 nm. The error results from comparison to bulk properties (E reference).

III. Simulations
A. FE model
To provide an insight for the experimentally observed effects of the indentation process of a single hard particle embedded in a soft matrix, finite element calculations were performed using the software package Abaqus/Standard (Dassault Systèmes Simulia Corp., Providence, RI). An axisymmetric two-dimensional (2D) specimen was modeled, consisting of a cylindrical particle and the surrounding matrix. The indenter was modeled as a rigid conical body with a half opening angle of 70.3°, giving the same area function as a Berkovich indenter. The usage of a cone is a well-established simplification for the three-sided Berkovich tip used in our experiments.Reference Fischer-Cripps23, Reference Bhattacharya and Nix24 Imperfections of the contact geometry, such as tip rounding or surface roughness, may influence the results especially at low indentation depths,Reference Li, Chen, Cheng and Cheng21, Reference Fischer-Cripps22 but these were not taken into account in our simulation. Contact between the indenter and the specimen was modeled as hard contact in the direction perpendicular to the surface, and a finite sliding formulation without friction was used in tangential direction. The outer dimensions of the specimen consisting of the particle and the surrounding matrix were fixed with 48 × 48 μm2in diameter and height, and the dimension of the particle itself was varied between 2 and 32 μm with an aspect ratio of 1.
The particle and the surrounding matrix were modeled as elastic–perfectly plastic isotropic materials with the reduced Young’s modulus E r, yield strength σY, and Poisson ratio ν. The modulus was derived from indentation experiments of the bulk samples. The yield strength was calculated by σY = H/C, with the measured hardness H and an estimated constraint factor C. For SiO2, C = 1.5 is known from literature and C = 3 for PVDF was chosen because of the higher modulus to hardness ratio.Reference Fischer-Cripps23 The Poisson ratio was assumed to be 0.17 for SiO2and 0.35 for PVDF.
A high mesh density with spacing between single nodes of approximately 15 nm was created beneath the indenter tip, and a coarser mesh was used farther away. Displacements in the loading direction were fixed at the lower specimen boundary, whereas the outer and upper boundaries of the specimen were unconstraint.
For the FE simulations of the indentation process itself, the indenter was driven into the surface for a given distance and withdrawn again with geometrical nonlinearities taken into account. All simulations were performed for indentation depths of {100, 150, 200, 250, 300, 400, 500} nm. To derive the modulus of the simulated load–displacement data, the Oliver–Pharr methodReference Oliver and Pharr1 was implemented in the software package Mathematica (Wolfram Research, Champaign, IL). Pileup or sink-in effects may influence the calculated parametersReference Bolshakov, Oliver and Pharr25 but were not taken into account to allow the comparison with the experiments.
B. Results and discussion
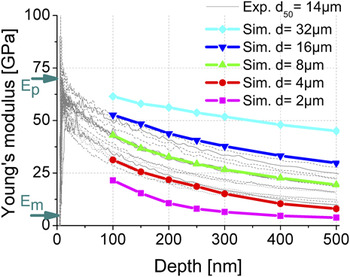
The indentation process was simulated for a single ceramic SiO2 particle in a polymeric PVDF matrix. The Young’s modulus is plotted against the penetration depth in Fig. 6 (colored curves) together with the experimental results for SiO2particles (gray curves) with a low filler content. The calculated Young’s modulus decreases with increasing indentation depth and the shape of the simulated and experimental curves is similar. The calculated Young’s modulus also decreases with decreasing particle size, and the range of curves from the experimental data using 14-μm particles falls between 4 and 16 μm of the simulated results. The simulations confirm the assumption made in Sec. II that the large scattering in the results is due to a scatter in particle size.
Young’s modulus against the penetration depth for SiO2 particles with different diameters from FE simulations (colored bold curves) and corresponding experimental data (light gray). The Young’s moduli of the bulk properties are labeled with E p (subscript p for particle) and E m(subscript m for matrix).

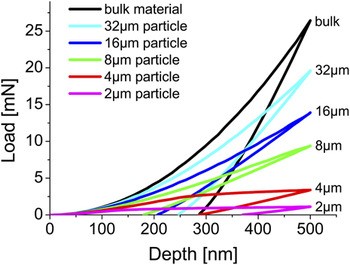
According to Eq. (1), the modulus depends on the contact stiffness S and the contact area A. As mentioned in Sec. I, the basis for calculating the contact stiffness and the contact area is the load–displacement data. The load–displacement data are shown in Fig. 7 for different particle sizes and differ in two aspects from the bulk material: first, the loading curve is getting flatter for smaller particles and does not follow P ∼ h 2as for bulk materials. The loading section from the 4-μm particle even shows a pronounced kink at an indentation depth of 250 nm. Second, the slope of the unloading curve is decreasing with decreasing particle size. Calculation of the Young’s modulus with these effects will be considered closely in the following sections.
Load–displacement data of SiO2 particles with different diameters from FE simulations (colored curves) embedded in a soft PVDF matrix and for a bulk SiO2specimen (black curve).

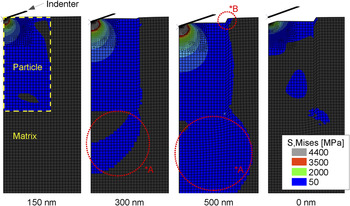
Figure 8 shows images of the FE simulation of a single 4-μm SiO2 particle in a PVDF matrix. For small indentation depths, the matrix is deformed purely elastically but with increasing indentation depth, the matrix deforms plastically (Fig. 8, *A), and the particle dives into the matrix (Fig. 8, *B). When the indenter is withdrawn again, the particle remains driven into the plastically deformed matrix as it was already seen in the three-dimensional (3D) scan within the experiments (Fig. 4).
Indentation of a 4-μm SiO2particle embedded in a softer PVDF matrix (images are cut around the particle). Colors are indicating the von Mises stress, whereas 50 MPa (blue) is the yielding strength of the matrix and 4400 MPa (gray) of the particle, respectively. *A indicates plastic deformation of the matrix; *B highlights the sink-in behavior of the particle.

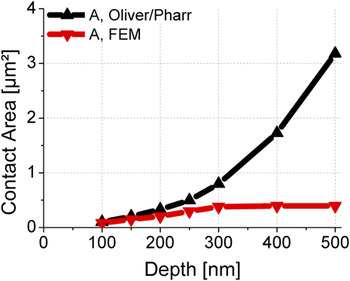
The mentioned kink in the loading section of the 4-μm particle in Fig. 7 correlates with the incipient plastic deformation of the matrix. Because the particle then just dives into the matrix and is not deformed anymore, the contact area calculated based on the indentation depth is overestimated. Figure 9 illustrates that in particular for penetration depths >300 nm when the matrix deforms plastically, the true values (red) diverge significantly from the contact area calculated according to Oliver and Pharr (black) based on the indentation depth on the first place.Reference Oliver and Pharr1 The contact area is overestimated further with increasing indentation depth, and thus, the modulus is underestimated according to Eq. (1).
Contact area for a 4-μm SiO2particle calculated according to the Oliver–Pharr method (black) and actual contact area taken from the FE results (red).

The shallower unloading curve of the particle compared to bulk material indicates a reduced stiffness of the system (S = dP/dh) leading to smaller moduli according to Eq. (1). In our opinion, the reduced stiffness can be attributed to the increasing volume content of soft matrix.
The effect of the overestimated contact area and the reduced stiffness of the system are cumulative, leading to smaller values for the Young’s modulus when calculated from Eq. (1).
IV. FRAMEWORK FOR CHARACTERIZING YOUNG’S MODULUS OF HARD PARTICLES EMBEDDED IN A SOFT MATRIX
A. General procedure
Figure 10 illustrates a framework for characterizing the Young’s modulus of hard particles embedded in a soft matrix by nanoindentation with the aim of minimizing the error in the measured Young’s modulus.
Framework for characterizing hard particles in a soft matrix by nanoindentation.

In a first step, nanoindentation measurements are performed in the CSM mode to measure the Young’s modulus as a function of penetration depth. As illustrated in Sec. II, there is always a range of curves with a big scatter in the Young’s modulus when characterizing isolated particles. Within the simulations, this effect was allocated to different particle sizes and the smallest error occurs for the biggest particles. Unfortunately, only the diameter of the particle in the cutting plan can be measured, and information of its depth is not accessible with surface images. To increase the accuracy of the result, bigger particles should be used. It is thus necessary to perform a sufficient number of indents until a dense band of curves has revealed. Instead of taking the mean value, only the curves with the highest moduli are considered for the next steps.
If a pronounced plateau is present, the Young’s modulus of the plateau corresponds to the Young’s modulus of the bulk material [see also Fig. 5(a)]. To exclude an influence of predominant effects at small indentation depths such as imperfections of contact geometry and others mentioned earlier, the plateau has to extend beyond a minimum indentation depth to be counted as a plateau in the above sense. Measurements at corresponding bulk samples have shown that h min= 50 nm seems to be a good choice for the characterized samples and the used nanoindenter in this study. The minimum indentation depth may be different for other materials and test equipment but can be determined in the same way as shown here.
However, if no pronounced plateau is present, the Young’s modulus is underestimated from the very first indentation depth and decreases further with increasing indentation depth. To minimize the error, the curves with the highest moduli are then fitted for indentation depths larger than h min and extrapolated back to zero and the modulus for the fictive indentation depth of h = 0 is taken as the modulus of the particle.
B. Extrapolation model
As mentioned in Sec. I, several analytic and empirical extrapolation models for determining the Young’s modulus of thin films have already been investigated. Empirical models with several fitting parameters provide more flexibility, especially with limited information about the system. For example, boundary conditions such as the depth of the particles or the conditions beneath the indented particle (e.g., pores versus another particle) may vary. The following empirical models are investigated with respect to their suitability for particle–matrix systems.
Menčík et al.Reference Menčík, Munz, Quandt, Weppelmann and Swain14 proposed an exponential function to fit the results of the composite Young’s modulus at different indentation depths according to:
 $$E_{\rm{c}} = E_{\rm{s}} + (E_{\rm{f}} - E_{\rm{s}} )e^{ - {\rm{\alpha }}x} \,;\,\,x = {h \over t}\quad,$$
where h is the penetration depth and t the thickness of the film. E f and α are fitting parameters. Menčík et al.Reference Menčík, Munz, Quandt, Weppelmann and Swain14 further proposed a reciprocal exponential function:
 $${1 \over {E_{\rm{c}} }} = {1 \over {E_{\rm{s}} }} + \left( {{1 \over {E_{\rm{f}} }} - {1 \over {E_{\rm{s}} }}} \right)e^{{\rm{\alpha }}x} \,;\,x = {h \over t}\quad.$$
A similar function was proposed earlier by Dörner and NixReference Dörner and Nix13:
 $${1 \over {E_{\rm{c}} }} = {1 \over {E_{\rm{s}} }} + \left( {{1 \over {E_{\rm{s}} }} - {1 \over {E_{\rm{f}} }}} \right)e^{{{\rm{\alpha }} \over x}} \,;\,\,x = {h \over t}\quad.$$
Another empirical approach is the power law function proposed by Jung et al.Reference Jung, Lawn, Martyniuk, Huang and Hu15:
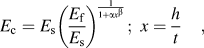 $$E_{\rm{c}} = E_{\rm{s}} \left( {{{E_{\rm{f}} } \over {E_{\rm{s}} }}} \right)^{{1 \over {1 + {\rm{\alpha }}x^{\rm{\beta }} }}} \,;\,\,x = {h \over t}\quad,$$
with the additional fitting parameter β. All models take into account the thickness t of the film and the Young’s modulus E s of the substrate. In our case, the film thickness t could be related to the particle’s depth but is not known and, hence, t was included in a new fitting parameter α′ = α/t replacing α. The Young’s modulus of the substrate E s could be related in general to the combined Young’s modulus of the particle’s support material, consisting of other particles and the polymeric matrix. Again, accurate properties are not known for our system and may vary between different particles. For instance, there may be another particle in direct contact with the indented one resulting in a higher stiffness; in contrast, a pore might be located beneath the indented particle resulting in a lower stiffness. E sis therefore kept variable.
However, certain bounds are defined in the fitting procedure to ensure physically reasonable values. For hard particles in a soft matrix, the combined Young’s modulus E s beneath the particle is assumed to be smaller than the measured Young’s modulus of the particle itself at the previously suggested minimum indentation depth of h min = 50 nm; in general, it is E s < E p (h min). It should be noted that E p (subscript p for particle) is used instead of E f (subscript f for film). Further, the Young’s modulus of the particle E p at the fictitious indentation depth h = 0 is assumed to be greater than the particles’ Young’s modulus at minimum indentation depth h min and smaller a certain maximum value, which was chosen to be 5 times the measured Young’s modulus of the particle at h min, so E p (h min) < E p < 5E p (h min).
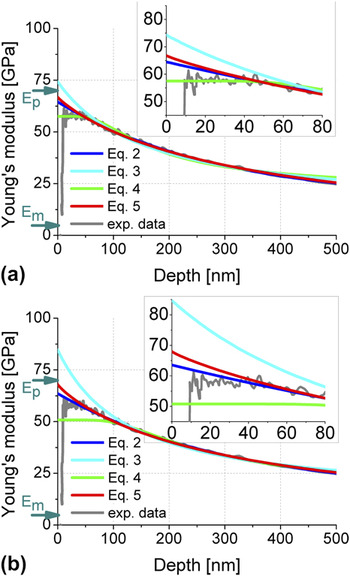
To choose an appropriate model, Eqs. (2)–(5) were fitted to the experimental results according to the modifications and bounds mentioned before. Criteria for the selection of an appropriate model are the sensitivity of the fitting parameters to the chosen minimum indentation depth h min, which should be as low as possible. And further, the Young’s modulus of the particle should be estimated as accurately as possible but not overestimated.
Figure 11 shows the fitting results for single SiO2 particles in a PVDF matrix, where only the curve with the highest modulus has been used. To investigate the sensitivity of the fitting algorithm on the choice of h min, the minimum indentation depth was varied between h min = 50 nm and h min = 100 nm. Equation (4) (Dörner and Nix) shows a high sensitivity to the minimum indentation depth. The behavior of the exponential function [Eq. (2), Menčík et al.] and the power law function [Eq. (5), Jung et al.] is much more stable than the others, whereas the error of the power law function [Eq. (5)] is smaller in both cases without overestimating true particles’ properties. The qualitative behavior of the fitting functions is the same for the ZrO2particles, which is not shown here.
Comparison of fitting functions for the nanoindentation Young's modulus of single hard particles in a softer matrix. The functions are fitted for a minimum indentation depth of (a) 50 nm and (b) 100 nm. The Young?s moduli of the bulk properties are labeled with E p (subscript p for particle) and E m (subscript m for matrix). From top to down in the detailed view: Eq. (3), Eq. (5), Eq. (2), and Eq. (4).

In a next step, we analyzed the reference samples with the adapted power law fitting model. According to our framework (Fig. 10), only the upper curves (three in our case) were analyzed. The results are summarized in Fig. 12: as observed earlier, the error correlates with the property ratios of the particle and the surrounding matrix as well as with the filler content. For the SiO2 particles (E p/E m = 27, H p/H m = 43), the error was eliminated and true particles’ properties could be calculated for the sample with high filler content (80 vol%) as well as for the sample with low filler content (10 vol%). In case of the ZrO2 particles (E p/E m = 104, H p/H m= 122), the error could not be eliminated but was significantly decreased from −76% to −48% for the samples with low filler content (10 vol%) and from −49% to −25% for the samples with high filler content (80 vol%).
Comparison of the calculated Young’s modulus of the reference samples, where the nanoindentation Young’s modulus of single particles in a softer matrix is evaluated with different data analyzing techniques. Deviations compared to the corresponding bulk samples are written in the bars.

V. CONCLUSIONS
(i) When characterizing the Young’s modulus of isolated hard particles in a considerably softer matrix by nanoindentation using CSM, errors may occur since the Young’s modulus is severely underestimated.
(ii) The error increases with increasing indentation depth, decreasing particle size, decreasing filler content, and for higher Young’s modulus and hardness ratios between particle and matrix.
(iii) The errors originate from two sources: first from the overestimated contact area, especially when the particle dives into in the plastically deformed soft matrix, and second in the reduced overall stiffness of the system. Both effects are more pronounced for greater indentation depths, leading to a further reduction of the Young’s modulus with increasing indentation depth.
(iv) Due to a variation in particle size as well as changing boundary conditions beneath the indented particle (e.g., pores versus another supporting particle), a whole range of curves with a large scatter in Young’s modulus are observed for different particles.
(v) Significant improvements in the accuracy can be achieved according to our framework as follows: (a) perform CSM measurements at different particles until a dense band of curves for Young’s modulus is observed; (b) for further analysis, consider only the curves with the maximum Young’s modulus instead of taking a mean value; (c) if there is a pronounced plateau, this corresponds to the bulk Young’s modulus of the particle; otherwise, the properties are underestimated and the error can be eliminated or decreased by (d) fitting the curves with the highest moduli for indentation depths >h minand extrapolating back to zero with the proposed model.
(vi) With regard to future characterizations of other particle–matrix systems, the identified errors can be considered as the upper limit if the ratio of particle to matrix properties is not greater than the reference samples nor is the filler content smaller than the reference samples.