

1. Introduction
One of the most enduring challenges that political economy has addressed is how to implement policies that increase the wealth of nations. Adam Smith (Reference Smith1776) provided an answer, arguing that in a market economy individuals pursuing their own interests are led by an invisible hand to engage in activities that enhance the wealth of their nations. The conclusion that nations with well-functioning market institutions grow prosperous while those without such institutions do not has been supported by centuries of research. More recent historical studies by Joel Mokyr (Reference Mokyr1990), Douglass North (Reference North1991), David Landes (Reference Landes1998), Daron Acemoglu, Simon Johnson and James Robinson (Acemoglu et al., Reference Acemoglu, Johnson and Robinson2001), Edward Glaeser, Rafael La Porta, Florencio Lopez-De-Silanes and Andrei Shleifer (Glaeser et al., Reference Glaeser, La Porta, Lopez-de-Silanes and Shleifer2004) are examples. Some unfortunate natural experiments appear to support this conclusion. When Germany (into West and East) and Korea (into South and North) were each divided into two separate countries after the Second World War, one with a market economy and one with a centrally planned economy, the market economies thrived while the centrally planned economies remained impoverished. The answer appears straightforward. Market institutions generate prosperity.Footnote 1
Mancur Olson Jr (Reference Olson1996) argues persuasively that institutional quality determines why some nations prosper while others languish in poverty, and William Baumol (Reference Baumol1990), along the same lines, notes that the institutional structure of some nations channels entrepreneurial activity toward creative and productive activities, whereas in other countries institutions create an incentive for entrepreneurial individuals to engage in predatory and destructive activities. Baumol's analysis points directly toward the importance of the rule of law. The rule of law means that the legal system protects property rights and treats all individuals the same. When this is the case, entrepreneurial individuals can get ahead by being productive and exchanging what they produce with others, enhancing everybody's wealth.
Without the rule of law, some people are favored under the legal system, and property rights are not well protected. In such a situation, productive individuals find any gains they reap under attack by a predatory legal system, while those who enjoy privileged status under the law can profit by appropriating the production of others. The benefit that those favored under a predatory legal system reap manifests itself as corruption. Without the rule of law entrepreneurial individuals have the incentive to establish themselves in government positions where they can tax and regulate resources to their advantage, and to manipulate the legal system (perhaps with bribes or threats) so that they are able to use the force of government to transfer resources from productive individuals to themselves. Anne Krueger (Reference Krueger1974) describes the wasteful rent-seeking activity in India that was produced by an institutional structure that rewarded political connections over productive activity. In such situations, the economy is less productive, partly because everybody has less of an incentive to engage in productive activity, and partly because those who have the potential to be most productive are drawn toward predatory rather than productive activities.
2. Why do nations retain unproductive legal institutions?
Starting from the premise that a well-established rule of law leads nations to be more prosperous, a common view regarding why poor nations retain a system of poorly protected property rights and legal systems that favor some individuals over others is that those who have political power are able to use the legal system to provide transfers to themselves. Referring to the poor nations of Africa, George Ayittey says:
African despots are loath to relinquish control or power. They would rather destroy their economies and countries than give up economic and political power. This power allows them to allocate or extract resources to build personal fortunes and to dispense patronage to buy political support (Ayittey, Reference Ayittey and Powell2008: 168).
The politically powerful benefit more from getting a larger piece of a small pie than they would get from changing the system so that the pie was larger, but they were unable to get a disproportionately larger share. Governments without the rule of law are more predatory than those with legal institutions that show less favoritism.
There are two components to this conjecture. The first is that maintaining corrupt regimes can give those with political power a greater command over resources. If this is the case, then enhancing the rule of law should lessen the government's command over resources, reducing what they have available to build their fortunes and pay off their supporters. The second component is that corruption helps those with political power to maintain their power. The analysis that follows considers both of these components.
If the rule of law increases an economy's productivity, then in theory there is a potential exchange that could implement unbiased legal institutions to replace predatory institutions and make everybody better off. This may not happen, following the reasoning of the previous paragraph, if reductions in corruption make the current regime less stable. A promise from citizens that after implementation of the rule of law those who are currently favored under the legal system would continue to receive a payoff from the increased productivity of the economy may not be credible.
The premise is that were the rule of law established, those who hold political power would give up command over resources because they would end up with less by taking a smaller share of a larger pie. Yet it is far from clear that the take of those who hold political power will be reduced with better enforcement of the rule of law, because lawless behavior will reduce the ability of the government to collect taxes. In a study that is suggestive, Dean Yang (Reference Yang2008) shows that when corrupt customs officials are replaced by contractors who objectively enforce customs laws, government revenue increases. Similarly, it would appear that when the Shah of Iran was in power from 1941 to 1979, the Shah was able to command more wealth under a system with a strong rule of law than the Islamic government that replaced the Shah. Britain provides another example of a monarch who, over centuries and not just years, was able to retain an increasing command over resources in a society with a strong rule of law. Both the Glorious Revolution of 1688 in Britain, and the overthrow of the Shah, indicate that implementing the rule of law does not assure continued and unchallenged political power, but the examples provide anecdotal evidence suggesting that the rule of law can increase the government's command over resources.
Whether those in power can increase their take by implementing a more impartial legal system is an empirical question. If the answer is yes, this calls into question the explanation that the rule of law is maintained by predatory rulers who benefit from keeping a larger share of a smaller pie.
3. Government spending as a measure of political benefit
An empirical examination of these issues requires measures of both the resources commanded by those with political power and the rule of law. One measure of the benefit that goes to those with political power from retaining a corrupt legal system is government expenditures, a measure of the command over resources that those in government can direct. One might question whether government expenditures are a good measure of the benefits that accrue to those with political power. In one sense it is, because those with political power determine how those resources are allocated. It is true in any regime that those with political power cannot simply take those resources entirely for their own use. As Bruce Bueno De Mesquita et al. (Reference Bueno de Mesquita, Smith, Siverson and Morrow2003) and William Niskanen (Reference Niskanen2003) argue, regardless of the form of government those who hold political power must use the resources at their disposal to buy the support of those who help them maintain their power. In an autocracy this may be a small group who have economic power, who can marshal political support, or who specialize in violence, along the lines suggested by Douglass North, John Wallis and Barry Weingast (North et al., Reference North, Wallis and Weingast2009). In a democracy much of the government's take may have to be redistributed to buy the support of a majority of voters.
In any system those who hold political power cannot simply confiscate government revenues to use as they choose, because regardless of the type of government, those who hold political power must use much of those revenues to buy political support. The way those resources are used to buy support will vary between democracies and autocracies, as Niskanen (Reference Niskanen2003) and Bueno de Mesquita et al. (Reference Bueno de Mesquita, Smith, Siverson and Morrow2003) note. An autocrat provides private goods to his cronies, whereas democratic leaders must spread benefits more widely to gain majority support. There is no clear reason to think that one form of government would have to spend more to buy its support than another, even though the mix of goods that the government provides is likely to be different. However, in any system government expenditures do measure the resources that those with political power have the power to direct, whether into their own pockets, to buy political support, or to purchase goods and services to further the public interest.
One might conjecture that democratic governments produce more public goods, but even the most democratic of governments produce relatively little that could be classified as public goods. For example, in 2010, the United States federal government allocated 61.4% of its budget to payments for individuals and 3.7% of its budget to net interest. National defense was 19.7% of the budget, which is often considered a public good. However, autocracies spend on defense too, and national defense might be viewed as expenditures to maintain the government's power, Randall Holcombe (Reference Holcombe2008) argues. These three categories add up to 84.8% of the federal budget, leaving only 15.2% that could possibly be public goods, except for defense, which political leaders use to defend their interests.Footnote 2 If autocracies spend less of their budgets on public goods than democracies, it could not be much less than what the democratic United States spends.
4. Rule of law and per capita income
A measure of the rule of law comes from James Gwartney and Robert Lawson (Reference Gwartney and Lawson2007) who have quantified seven components of the rule of law – judiciary independence, protection of property rights, impartial courts, contract enforcement, integrity of the legal system, military interference with government, and regulation on the sale of real property – and have aggregated these seven components into an index that measures the rule of law. This section confirms that the rule of law, as measured by the Gwartney–Lawson index, is positively correlated with per capita income across nations.
Gwartney and Lawson (Reference Gwartney and Lawson2007: Appendix 1) explain the nature of the data and data sources that go into the index. Judicial independence, impartial courts and protection of property rights are all extracted from the World Economic Forum's Global Competitiveness Report, with additional data for impartial courts only coming from the World Bank. The raw data behind the index come from surveys given to people in their own countries. For judicial independence, they are asked: ‘Is the judiciary in your country independent from political influences of members of government, citizens, or firms?’ For impartial courts, the survey question asks respondents to rank on a 1–7 scale, ‘The legal framework in your country for private businesses to settle disputes and challenge the legality of government actions and/or regulations is inefficient and subject to manipulation (= 1) or is efficient and follows a clear, neutral process (= 7).’ For protection of property rights the survey asks respondents to rank on a scale the degree to which ‘Property rights, including over financial assets . . . are clearly defined and well protected by law.’ Military interference and integrity of the legal system come from the PRS Group's International Country Risk Guide, which is designed to offer information to international businesses. Legal enforcement of contracts and regulatory restrictions comes from the World Bank's Doing Business guide.Footnote 3 The World Bank estimates the amount of time it would take to use the legal system ‘. . . to collect a clear-cut debt’ and the monetary cost of the case as a percentage of the debt. The time and money costs are averaged to come up with their estimate of the legal enforcement of contracts. One key thing to note about the data is that it is not based on the amount of money government spends to protect property rights, or enforce the rule of law, so the rule of law variables are not another measure of the government spending variable that is used as a dependent variable.
The introduction to the paper asserted that enforcement of the rule of law (and other market institutions) is associated with higher incomes. There is a substantial literature supporting this proposition, so this analysis accepts that conclusion as firmly established. However, because this analysis uses the Gwartney–Lawson measure, there is a question regarding whether this specific measure of the rule of law is also associated with higher incomes. Note that while much literature has shown the link between the entire Gwartney–Lawson index and prosperity, the analysis in this paper uses only the rule of law component of the index, not the entire ‘Economic Freedom’ index.
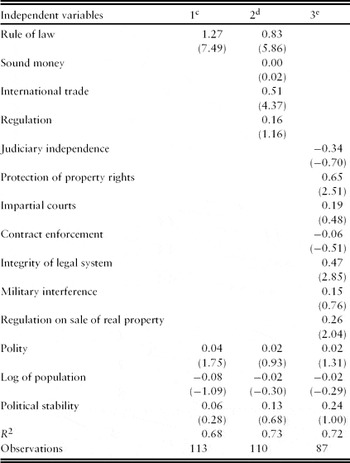
Tables 1 and 2 show that the rule of law component of the index is correlated with higher incomes. Using log of GDP per capita, the first column in Table 1 runs a regression using the Gwartney–Lawson measure of the rule of law as an independent variable, along with the polity measure of political government, population, and political stability as independent variables. The polity variable comes from the Polity IV dataset constructed by Monty Marshall, Keith Jaggers and Ted Robert Gurr (Marshall et al., Reference Marshall, Jaggers and Gurr2008), and is a country's democracy score minus its autocracy score. These variables account for political competitiveness and attempt to measure the actual type of regime a country has, rather than looking at the way a country's laws describe its political system. Higher scores reflect a more democratic nation with more political competitiveness and more citizen participation in the electoral process. The countries included in the regressions are listed in Appendix 1. Descriptive statistics for each variable are shown in Appendix 2.
Ordinary least squares (OLS) regression resultsa,b

Notes: aDependent variable: log of GDP per capita. bNumbers in parentheses are t-statistics. cColumn 1 features the simple regression with the main variable of interest: rule of law. dColumn 2 also includes the other components of the Economic Freedom of the World Index from Gwartney and Lawson (Reference Gwartney and Lawson2007). eColumn 3 breaks the rule of law variable into its subcomponents. The number of observations varies according to the availability of components and subcomponents of the economic freedom measures.
Ordinary least squares (OLS) regression resultsa,b

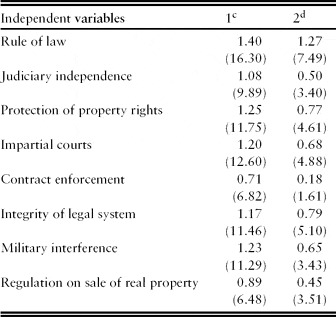
Notes: aDependent variable: log of GDP per capita. bNumbers in parentheses are t-statistics. cColumn 1 displays results from regressions where the rule of law variables are used separately and are the only control variables in the regression. dColumn 2 displays similar results when controls for population, political regime and political stability are included.
The rule of law is normalized with a standard deviation of 1, so the coefficient in Table 1, column 1, shows that a 1 standard deviation increase in measured rule of law increases per capita income by 127%. The t-statistic of 7.49 shows a close statistical relationship. While 127% may seem like a large increase, it is associated with a 1 standard deviation increase in the rule of law, and is reasonable considering the large variation in per capita incomes across nations. A 1 standard deviation change is the exact difference between the United States and Uruguay, for example. The difference between the United States and Mexico is 1.2 standard deviations.
The second column uses the rule of law along with three other major components of the Gwartney–Lawson index to show that even when they are taken into account, the rule of law remains highly statistically significant, with a t-statistic of 5.86. The other major components are sound money, international trade, and regulation. The Gwartney–Lawson index also has a size of government component, which is not shown in regression 2 because of the correlation between size of government and the dependent variable, per capita gross domestic product (GDP). However, in a separate regression (not shown), including it still leaves the rule of law statistically significant at the 0.01 level. The rule of law has a statistically significant relationship with per capita GDP regardless of how the other components of the Gwartney–Lawson index are taken into account.
The third column uses the seven separate components of the aggregate Gwartney–Lawson rule of law measure as independent variables. Three are positive and significant at the 0.05 level and the other four have absolute t-statistics below 1. Because the measures are correlated with each other it is not surprising that some are not statistically significant, but those that are show the expected positive relationship.
Table 2 shows the rule of law coefficients and t-statistics for the rule of law variables when they are run individually as independent variables. Column 1 shows the coefficients and t-statistics when the rule of law variable listed to the left is the only independent variable in the regression; column 2 shows the coefficient and t-statistic when polity, log of population, and political stability are added as independent variables. In all regressions but one (contract enforcement with the other independent variables), the rule of law variables show up positive and significant at better than the 0.05 level. The results in Tables 1 and 2 show that the Gwartney–Lawson measure of the rule of law, both in the aggregate and when looking at the individual components, is positively correlated with per capita income. Following the literature, this analysis accepts that better institutions are associated with higher incomes. There is a substantial literature showing that the rule of law produces higher income, and the purpose of the regressions in Tables 1 and 2 is simply to demonstrate that the relationship holds with the specific measure of the rule of law used in this analysis.
5. Rule of law and government expenditures
One measure of the degree to which those with political power control economic resources is government expenditures. Ultimately, government expenditures are directed by those who run the government, whether the expenditures add to their own personal wealth or are used to buy support to keep the incumbent regime in power. Following Anthony Downs (Reference Downs1957), political competition implies that the incumbent government must direct resources toward maximizing political support, and while Downs was writing specifically about democracy, that same idea comes through in Bueno de Mesquita et al. (Reference Bueno de Mesquita, Smith, Siverson and Morrow2003) and Niskanen (Reference Niskanen2003) as applicable to any form of government. Using log of per capita government expenditures as a measure of the political elite's control over resources, Table 3 shows the relationship between the rule of law and government expenditures.
Ordinary least squares (OLS) regression resultsa,b

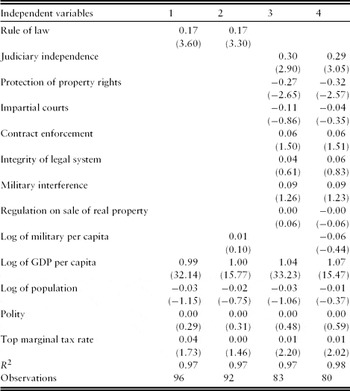
Notes: aDependent variable: log of per capita government expenditures. bNumbers in parentheses are t-statistics.
The first specification in Table 3 uses the aggregate rule of law measure as an independent variable along with log of per capita GDP, log of population, and the polity index. Higher incomes can enable per capita government expenditures to increase because higher-income nations derive a larger share of their incomes from wages and salaries paid by corporations, which are easier to monitor and tax. Also, people living closer to subsistence will have less that can be taxed away. High-income nations can tax away more than half an individual's income, whereas people living barely above subsistence would die if half their incomes were taxed away. In addition, the demand for government output is likely to rise as income rises. Thus, when looking at the impact of the rule of law on government expenditures, there are several reasons why per capita income should be held constant. Population might have an impact because people might be less mobile, and therefore easier to tax, in larger countries, and polity is included because more autocratic governments may use their power to tax more, but neither is statistically significant.
The results show that the rule of law increases government expenditures per capita, even holding income constant. A second specification includes log of military expenditures per capita as another control variable, but it is not significant and the results are similar. This result is inconsistent with the hypothesis that by allowing corruption and not enforcing the rule of law those with political power can end up with a larger slice of a smaller pie. Not only does the rule of law have a positive effect on incomes in general, as Tables 1 and 2 show, it also increases the resources that are commanded by government.
The rule of law variable is normalized with a mean of zero and a standard deviation of 1, so the coefficient of 0.17 means that a 1 standard deviation increase in the rule of law increases per capita government expenditures by 17%, which shows that governments do not enrich themselves by allowing corruption. The opposite is true. Governments can command more resources by strengthening the rule of law. Because the rule of law also increases per capita income, as Tables 1 and 2 show, the coefficients in Table 3 only show the direct effect of the rule of law on government expenditures, holding income constant. Because the rule of law also increases income, there is an indirect effect also, so the results shown here are conservative estimates of the effect of the rule of law on government expenditures. They do not include the indirect effect in which the rule of law increases income, and higher income is positively correlated with higher levels of government expenditures. Even these conservative estimates show that the rule of law increases a government's take, and that the effect is quantitatively large.Footnote 4
Regressions 3 and 4 look at the individual components of the rule of law by disaggregating the rule of law variables into the seven components that compose it. In regressions not shown in the paper, when each component is run by itself without the other rule of law components, only integrity of the legal system and military interference are significant at the 0.05 level, indicating that more integrity in the legal system and less military interference are associated with higher government expenditures per capita. The remaining variables are positive, except for protection of property rights, which has a t-statistic of –0.34. Looked at individually, two of the seven components indicate that when that component indicates a better rule of law, government expenditures rise; the others are not statistically significant. Note that in Table 2 all of the components of rule of law showed a positive statistically significant relationship with per capita income.
Perhaps more interesting are the specifications in regressions 3 and 4 of Table 3, which include all seven of the rule of law components as independent variables to examine how each one affects government expenditures when the others are held constant. Because they are collinear, one would expect that they would reduce each other's statistical significance, and in fact only two of them are statistically significant at the 0.05 level: judiciary independence and protection of property rights. Judiciary independence is positive, whereas protection of property rights has a negative sign. It appears that holding the other rule of law components constant, a more independent judiciary enables the government to collect more revenue, whereas having more secure property rights reduces government expenditures per capita.
GDP per capita has a coefficient close to 1 in all of the regressions, indicating that holding other factors constant, a 1% increase in GDP per capita results in a 1% increase in government expenditures per capita. The t-statistics are very high in all regressions, which is not surprising, and the coefficient close to 1 indicates that with other things held equal, government expenditures as a share of GDP are unaffected by the level of per capita GDP. Population, polity and military spending do not have a statistically significant effect. One might conjecture that more autocratic governments are able to collect more (or less) revenues to fund their expenditures, but the polity variable is included to hold the degree of democracy/autocracy constant, and does not have a statistically significant effect.
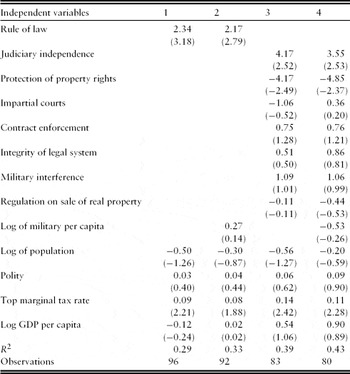
Table 4 reproduces the regressions from Table 3, substituting government expenditures as a percentage of GDP as the dependent variable. The results are qualitatively the same. Again, the rule of law is positively correlated with a government's share of GDP, indicating that those who direct a government's resources can increase their share of the pie with better enforcement of the rule of law. Again, when looking at the individual components in specifications 3 and 4, judiciary independence works the same way, enhancing a government's share of GDP, while protection of property rights reduces a government's share of GDP.
Ordinary least squares (OLS) regressiona,b

Notes: aDependent variable: government expenditures as a percentage of GDP. bNumbers in parentheses are t-statistics.
These results indicate that the argument that those who head corrupt governments benefit from the lack of the rule of law because they are able to command a larger slice of a smaller pie is incorrect. A higher rule of law score is associated with higher levels of government expenditures, whether measured as per capita expenditures or as a share of GDP.Footnote 5 The rule of law would help those with political power to increase their take and expand their command over resources. The exception to this is the property rights component of the rule of law. It appears that a more impartial legal system is associated with an increase in a government's command over resources, while better protection of property rights limits a government's command over resources.
6. Rule of law and political stability
If those with political power can increase their take by better enforcing the rule of law, why would they tolerate corruption and compromised courts? (They might tolerate weak property rights because it appears that the enforcement of property rights does not increase a government's take.) One possible answer is that even though corruption reduces their command over resources, it provides a payoff to those who support the incumbent regime, enabling incumbents to maintain their power. The previous results show that those who control the government can increase their take with better enforcement of the rule of law, but the incumbent regime might worry that without the payment that corruption gives to their supporters, their regime will be replaced, and the larger benefits of political power will go to their successors.
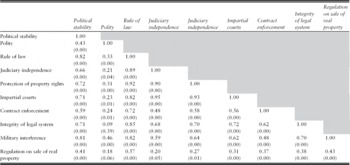
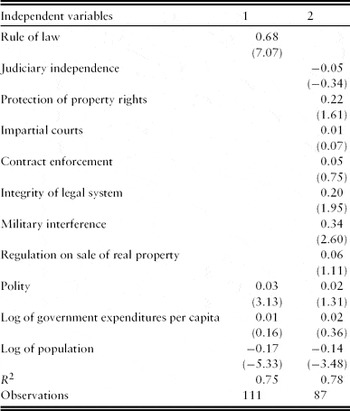
To examine that idea, Table 5 looks at the correlation between political stability and the rule of law. The political stability measure comes from the World Bank's world governance indicators 1996–2008, and ranges from –2.5 for high instability to 2.5 for high stability.Footnote 6 Greater instability means a greater likelihood of a government being overthrown by violent or unconstitutional means. Table 5 shows that improvements in the rule of law are positively correlated with political stability. Table 6 shows the results of ordinary least squares (OLS) regressions examining the relationship between political stability and the rule of law, and shows the same result. Higher values of the rule of law are associated with more political stability, and the t-statistic of 7.07 shows a strong statistical relationship. Thus, incumbent regimes are more likely to be displaced if they are corrupt and do not enforce the rule of law.
Correlations of political stability and rule of law variablesa

Note: aNumbers in parentheses are p-values.
Ordinary least squares (OLS) regressiona,b

Notes: aDependent variable: political stability. bNumbers in parentheses are t-statistics.
If one tends to think of incumbent regimes as a single individual, like a president or dictator, it is true that the longest-lasting dictators remain in power longer than elected presidents, for example, but dictators often dismiss those under them, and the longest-serving members of the United States Congress, for example, have tenures that would be the envy of any dictator.Footnote 7 One cannot explain corruption as the result of incumbents using it to maintain their power, because corrupt regimes are more unstable than those that enforce the rule of law.
The second regression in Table 6 looks at the individual components of the rule of law, and, as before, the correlation among the components reduces their statistical significance. Three components stand out, however. The only individual component statistically significant at the 0.05 level is military interference, and higher values indicate less interference (more rule of law). The positive correlation shows that more military interference is associated with more instability, not surprisingly, because one of the larger threats to incumbent regimes is a takeover by the military. Integrity of the legal system is not quite significant at the 0.05 level, but it suggests that political stability and integrity of the legal system are positively related. Protection of property rights is positive, but with a t-statistic of 1.61 is not significant at the 0.05 level. It may be that more secure property rights also enhance political stability.
The results in Tables 5 and 6 call into question the idea that corrupt regimes tolerate corruption because it pays off supporters of the incumbent regime, enhancing their hold on political power. In fact, the opposite appears true. Incumbent regimes that better enforce the rule of law are more stable.
7. Conclusion
The results in this paper call into question some common ideas about why some governments appear to tolerate corruption and do not enforce the rule of law. One reason that has been suggested for the persistence of corrupt legal institutions in poor countries is that while most of the country is poorer as a result, those with political power benefit from being able to use those corrupt legal institutions to increase their share of the nation's income. One measure of the economic resources that those with political power have at their disposal is government expenditures, and using this measure the conjecture that corrupt legal institutions give those with political power a larger share of a smaller pie is not true. In fact, even as the pie gets larger (because the rule of law is also associated with higher per capita incomes), a government's command over resources increases as the rule of law is enforced. The explanation that political leaders in countries with corrupt legal institutions maintain those institutions so they can get a larger share of a smaller pie does not hold up to empirical scrutiny. Improving the rule of law gives political leaders control over a larger slice of a larger pie.
This suggests that if those in power want to expand their command over resources, they would do better by establishing and enforcing a firm rule of law rather than allowing corruption and favoritism in the legal system. This points to another hypothesis that even if less corruption increases a government's command over resources, it may be that corruption is paying off the incumbent government's supporters and keeping it in power. This hypothesis, too, is called into question by looking at the relationship between rule of law and political stability. In fact, governments are more stable the better they are able to enforce the rule of law, so the incumbent regime's hold on power would be enhanced, not threatened, by a reduction in corruption.
This leaves open the question of why rulers do not move toward an increased rule of law when it appears that there are potential financial gains to the ruling class and greater regime stability. One answer might be that, much as James Buchanan and Dwight Lee (Reference Buchanan and Lee1982) differentiate between a short-run and long-run Laffer curve, the ruling elite may believe that despite potential long-run gains in wealth and stability, there are short-run costs to upsetting the status quo. Ruling elites may exhibit a status quo bias that appears in many areas of human behavior. Another reason might be that the ruling elite cares about factors beyond the quantity of resources under their control, and the privileges that come to those that are favored by a biased legal system weigh heavily enough in the utility functions of elites that they are willing to trade some income away to gain the privileges that come with it. These are conjectures about why ruling elites may not support the rule of law even when there are apparent benefits to them, not definitive answers, so this paper certainly does not offer the last word on the subject.
Table of countries

Notes: aCountry with an overall rule of law score but missing one or more component scores. bCountry without measured 2005 military spending. cCountry without a Polity IV measure. dCountry without a measured top marginal tax rate.
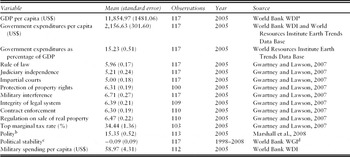
Descriptive statistics

Notes: aWorld development indicators. bThe polity variable normally ranges from –10 to 10, but has been normalized in our sample to range from 0 to 20. cPolitical stability ranges from –2.5 to 2.5, where a higher value indicates more stability. dWorld governance indicators.