


A crucial issue in the political development of states is why conflict between ethnic groups within the state endures and how such intergroup conflict might be transcended. Policy alternatives include methods for ethnic integration of state institutions via quotas or affirmative action, autonomy provisions, or strategies that seek to remove ethnic divisions from public consciousness (de Zwart Reference de Zwart2005; Horowitz Reference Horowitz1985). The wisdom of pursuing one or another strategy in a given context is an issue that deserves empirical attention. In this article, I examine the consequences of an integration-based strategy implemented in an especially challenging context: military reform in the aftermath of the brutal, ethnically charged civil war in Burundi (1993–2004). Findings from social psychology, which I review below, suggest that ethnic integration and the heightened “contact” that it entails carry the promise of reducing participants’ prejudice and ethnic salience. When applied to formerly warring and ethnically divided factions, the hope is that these effects lower the potential for future mobilization along ethnic lines. Political scientists have tended to be skeptical of such claims, proposing that such policies may even exacerbate the very conflict they are intended to transcend. This occurs by “freezing” the salience of ethnic identity and generating resentments along ethnic lines. These contrasting viewpoints guide my analysis of quota-based ethnic integration in the Burundian military. I draw on macro-level evidence about the depth of integration that occurred and the performance of the resulting institution. I then draw on micro-level evidence that arises from a natural experiment that quasi-randomly assigns exposure to ethnic integration based on the military retirement age.
There are two reasons that Burundi is an important case for students of conflict resolution. First, Burundi's Hutu–Tutsi ethnic structure is part of the class of “ranked ethnic systems” that have provided the setting for violent conflicts that have been especially difficult to untangle (Horowitz Reference Horowitz1985, Reference Horowitz1991; Wimmer Reference Wimmer, Delanty and Kumar2006). The privilege afforded to segments of the minority Tutsi segment and the severe constraints to mobility for majority Hutu provide a ready narrative for ethnic mobilization that has colored Burundi's, and neighboring Rwanda's, violent postindependence history. Lessons from this case may be applicable to other contexts that face functionally equivalent legacies of mass exclusion and perceived minority ethnic domination (Chua Reference Chua2004). Second, Burundi is located in Africa's Great Lakes region, which has unfortunately been host to an enormous fraction of the world's war-related death in recent decades. In addition to Burundi's fragile peace, there continues to be much worry about the stability of Rwanda's postwar political order. The nearly decade-and-a-half of violent disorder in the east of neighboring Democratic Republic of Congo is partially a result of spillovers from Rwanda and Burundi. Understanding the nature of contemporary civil conflict is, to no small extent, a matter of understanding this particular set of intertwined conflicts.
This article begins with a theoretical discussion on the possible consequences of quota-based ethnic integration, focusing on the optimistic social psychology literature on the “contact hypothesis” as well as more pessimistic political science and political psychology literature on “hierarchy maintenance.” I then review the macro-level features of the case, including the context of the conflict, the nature of the integration that occurred, and apparent consequences for the performance of Burundi's military. I follow with micro-level evidence, explaining and then analyzing a natural experiment that quasi-randomly assigned exposure to ethnic integration based on the retirement age. The findings suggest that at the macro level, deep ethnic integration was feasible despite the recent history of massive interethnic violence and animosity, and that this has yielded a cohesive and effective state institution. At the micro level, the evidence suggests that exposure to integration is associated with less prejudice and is benign in terms ethnic salience. A conclusion draws out implications.
ETHNIC INTEGRATION AND CONFLICT
There exists a theoretical debate in the social science literature about the consequences of ethnic integration policies such as quotas for ethnic conflict. Quota-based integration of institutions is a commonly employed strategy in addressing legacies of ethnic exclusion and ethnic conflict, due in part to its transparency and to the appreciation that legacies of exclusion may not disappear without proactive measures (Fryer and Loury Reference Fryer and Loury2005). Aside from the philosophical debate over quotas, the behavioral science literature debates the likely consequences of quotas. This includes an emerging literature on the effects of quota-based representation in elected bodies, where results suggest that quotas and other types of “descriptive representation” may contribute to enhanced attention to marginalized groups’ welfare (Duflo Reference Duflo2005) and less prejudicial attitudes and behaviors among constituents (Chauchard Reference Chauchard2010; Dunning Reference Dunning2010). I focus here on theories about how individuals subject to quota-integrated institutions may react and the implications of such reactions for ethnic conflict more generally. We can distinguish between those who are optimistic about the contribution of quotas to reducing ethnic tensions from those who are pessimistic, suggesting instead that quotas may exacerbate tensions.
Optimistic theories derive from social psychology literature tied to the intergroup “contact hypothesis” originating in the work of Allport (Reference Allport1954). Allport proposed that increased contact in the presence of four essential conditions will lead to a reduction in negative affect toward an out group and a consequent reduction in prejudice and parochialism. These conditions, as applied to a quota-integrated institution, are that (1) the integrated groups are afforded equal status in the institution, (2) members of the institution work toward common goals, (3) attainment of those goals must require cooperation, and (4) integrative aims must have the support of authorities, law, or custom. In a recent synthesis, Pettigrew (Reference Pettigrew1998) proposes that a fifth condition is also essential: (5) opportunities for friendship formation across group lines are not totally blocked. The supposed psychological mechanisms are that subjects correct mistaken views about out-group members, develop a sense that working with out-group members is normal, form emotional bonds across group boundaries, and learn that ingroup norms are not necessarily optimal or even superior to those of the out group. In a meta-analysis of 515 studies, Pettigrew and Tropp (Reference Pettigrew and Tropp2006) find that the hypothesis holds in a broad array of contexts, although very little of the evidence comes from experimental or quasi-experimental data in naturalistic settings and so questions of internal and external validity cloud these findings. Scholars of comparative politics have found contact theory to be useful in interpreting patterns of inter-racial tolerance in postapartheid South Africa (Gibson Reference Gibson2004; Gibson and Gouws Reference Gibson and Gouws2003) and the prejudice-reduction effects of a reconciliatory media intervention in postwar Rwanda (Paluck Reference Paluck2009; Paluck and Green Reference Paluck and Green2009a).
Ethnic integration in the military provides a good test of contact theory, as the formal terms of integration typically establish conditions (1) and (4), and the nature of military activity and military life establishes conditions (2), (3), and (5) (Gaub Reference Gaub2011, 4–5). By working together as “brothers in arms” in an integrated military, the argument goes, soldiers should become less ethnically prejudiced toward out groups. In addition, following Pettigrew (Reference Pettigrew1998, 72–75), such integration and contact is hypothesized to trigger “in-group reappraisal,” resulting in “deprovincialization” or reduction in in-group parochialism and, under optimal conditions, recategorization of one's self-identification in way that “obscures the ‘we’ and ‘they’ boundary.” Ethnic integration would do little to hamper the effectiveness of the institution, while having the benefit of reducing interethnic animus among those who would otherwise be most threatening were there renewed appeals to mobilize along ethnic lines.
Other theoretical approaches suggest reasons to be more pessimistic. In the political science and political psychology literature, theories of “hierarchy maintenance” suggest that quota-based integration will generate resentment among those whose status is threatened, causing such individuals to withdraw cooperation, become more adversarial, and even work to undermine the quota-integrated institution (Blumer Reference Blumer1958; Coser Reference Coser1956; Levine and Campbell Reference Levine and Campbell1972). In the political science literature, hypotheses along these lines have been used to explain the origins of violent intergroup conflict, sometimes pointing specifically to status shifts within major state institutions such as the military (Gurr Reference Gurr1970; Horowitz Reference Horowitz1985, Reference Horowitz2001; Petersen Reference Petersen2002). In a similar vein, theorists of civil conflict have proposed that the use of quotas may freeze the salience of ethnic identities that political entrepreneurs had used instrumentally during wartime to divide people and seek political advantage (Aitken Reference Aitken2007; Simonsen Reference Simonsen2005). If this is true and if soldiers are really the muscle of ethnicized political tendencies, then we should expect soldiers to be especially adamant about the importance of their ethnic identity.
Each viewpoint is plausible, and the overall effect of quota-based integration is likely an aggregate of both positive and negative effects. Findings on racial integration in the U.S. military has tended to follow the expectations of contact theory and provide a model for effective desegregation (Landis, Hope, and Day Reference Landis, Hope, Day, Miller and Brewer1984; Moskos and Butler Reference Moskos and Butler1997). Gaub (Reference Gaub2011)’s case studies of Nigeria, Lebanon, and Bosnia find that unit-level integration of ethnic groups has tended to “exert a soothing effect” (p. 143). On the other hand, research with the Israeli Defense Forces (IDF) failed to find any effect of integration on relations between Israelis of European versus Middle Eastern descent (Amir, Bizman, and Rivner Reference Amir, Bizman and Rivner1973). In line with the hierarchy maintenance literature, Heinecken (Reference Heinecken1998) presents survey evidence of white South African officers’ resentment toward racial integration policies, while Krebs (Reference Krebs2004, 106–108) gives examples from the nineteenth century Italian military, present-day Israeli Defense Forces, and in colonial Africa where ethnic mixing may have exacerbated tensions. A problem with all of these studies, however, is the lack of compelling experimental or quasi-experimental variation in integration exposure, a point to which I return below. At the end of the day, our interest for policy is to determine whether one or another tendency dominates and to do so with utmost rigor. This study attempts to do so in the aftermath of the extremely violent and ethnically charged civil war in Burundi.
THE CONTEXT OF BURUNDI'S CIVIL WAR
The context is the ethnic integration of Burundi's military after the 1993–2004 civil war. The high level of violence during the war coming after decades of accumulated exclusion, mistrust, and resentments would seem to make this a hard setting for quota-based integration policies to succeed. In comparable circumstances, such as in Rwanda, quota-based integration has been off the table as part of a general postwar ban on any formal reference to ethnicity (Lemarchand Reference Lemarchand, Marysse, Reyntjens and Vandeginste2007). In Bosnia, state institutions including the army are structured on the basis of a segregated or “pillarized” logic, with the first ethnically integrated military unit appearing only in 2005, ten years after the resolution of the war (Simonsen Reference Simonsen2007). Nonetheless, in Burundi integration of mostly Hutu rebels into the Tutsi dominated army began after a 2003–4 cease fire which drew into the peace process the largest rebel group in the country, the National Council for the Defense of Democracy-Forces for the Defense of Democracy (CNDD-FDD, by its French acronym).Footnote 1 Some historical background is necessary to understand why ethnic integration was such a landmark step in Burundi's political development.
Burundi is a small, impoverished, land-locked country of approximately 8 million people (as of 2012) in the center of Africa. It has been wracked by a cycle of political violence since independence in 1962. Like neighboring Rwanda to the north, Burundian society is marked by a castelike stratification that has historically privileged a Tutsi minority relative to majority Hutu and a very small third group, the Twa.Footnote 2 Also like their neighbors in Rwanda, Burundians have struggled to escape a conflict pitting custodians of this “ranked ethnic system” (Horowitz Reference Horowitz1985, Reference Horowitz1991; Lemarchand Reference Lemarchand1970) and “violent discriminatory state” (International Crisis Group 2003, 6) against those agitating to remove barriers to Hutu mobility.
Burundi's national army, known as the Forces armées burundaises (FAB) until 2004, featured centrally in the country's bloody political drama since independence in 1962. In the first four years after independence Burundian politics suffered a series of assassinations, an abortive coup by Hutu officers, repressions, and reprisal massacres. The events culminated in a purge of high ranking Hutu officers and a 1966 military coup led by the minister of defense, Captain Michel Micombero, a Tutsi from Bururi province. Thus began a period of de facto military rule and intensified concentration of economic opportunities and power into the hands of a Tutsi military clique from the southern Bururi province (Ngaruko and Nkurunziza Reference Ngaruko and Nkurunziza2000). The clique oversaw a dramatic intensification of Hutu exclusion as well as a degree of exclusion of nonsouthern Tutsi. A 1972 insurrection coordinated by Hutu expatriates and Hutu army members escalated to involve massacres of Tutsis, mostly in the southern part of the country. This triggered a barbarous crackdown by the army, which went beyond restoring order and sought to prevent future uprisings by “decapitating” Hutu society. A more thorough purge of Hutu members of the army and police followed. Competition among clan-based factions of southern Tutsi military officers shaped the next 20 years of Burundian politics (Lemarchand Reference Lemarchand1994).
In the late 1980s and early 1990s, then-President Pierre Buyoya, also a Tutsi from Bururi, presided over a process of ostensible national reconciliation. Buyoya oversaw the promulgation of a national unity charter and new constitution in 1992, setting the stage for elections in 1993. Some places in the national officer academy, the Institut supérieur des cadres militaires (ISCAM), were opened to Hutu candidates. But the gesture masked a more general resistance to army reform among the Tutsi elite. The 1992 national unity charter declared that “the truth is that there is no discrimination within the army,” a rather absurd claim (Lemarchand Reference Lemarchand1994, 139). One of the beneficiaries of this process, a Hutu from Bururi named Jean-Bosco Ndayikengurukiye, was a member of one of the integrated ISCAM classes. He would eventually defect to become a leader in the rebellion that broke out in 1993.
In peaceful and generally fair elections in 1993, Melchior Ndadaye, a civilian Hutu who had returned from exile in Rwanda, defeated the incumbent Buyoya by a large majority in the presidential race (Reyntjens Reference Reyntjens1993). Ndadaye's administration called for the rapid promotion of some Hutu officers within the military to better align the officer corps with the interests of the civilian government. After only 3 months in power, Ndadaye was assassinated in a bungled coup attempt on October 21, 1993. The assassination triggered what a United Nations commission described as genocidal reprisals by Hutu mobs against Tutsi men throughout the countryside, followed by massacres of Hutus by the Tutsi-dominated army and police (United Nations 1996). Hutu members of Ndadaye's government fled the capital, Bujumbura, to establish a rebel movement, the CNDD, and its military wing, the FDD. Explicit in their stated goals was the defeat and dismantling of the so-called “armée mono-ethnique,” so-called because the officer corps was the near-exclusive domain of southern Tutsis.
The army (FAB), CNDD-FDD, and some smaller rebel factions fought in a civil war that lasted until 2004. Fighting touched most regions of the country producing an astounding 250,000–300,000 deaths out of a prewar population of 6–8 million (International Crisis Group 2003). Burundi's prewar socioeconomic development levels were already among the world's lowest, although for its income level, the country did have relatively well-developed infrastructure and institutions. The war severely stalled development for over a decade, resulting, for example, in an estimated 20% decline in real GDP over 1993–2002 (World Bank 2004).
THE MILITARY INTEGRATION OUTCOME
A peace process had begun in 1996 and discussions of military reform featured prominently from the start. The main factions—the CNDD-FDD and the FAB—started with diametrically opposed visions for how such reform should proceed. The rebel CNDD-FDD took a maximalist position, calling for the complete dismantlement of the national army and its reconstruction to reflect the national ethnic balance. The FAB, as the incumbent national army, characterized the situation as a “problem of merely integrating a few rebel elements into the armed forces” (Nindorera Reference Nindorera2007, 11). This disagreement propelled the conflict until military stalemate and war exhaustion began to catch up to both sides in 2000–2003.
Agreements signed by the warring parties in Arusha in 2000 and Pretoria in 2003 ushered in genuine peace. The FDD forces were largely successful on the battlefield, although the FAB forces were not defeated outright. These rebel successes are reflected in the agreements, whose provisions led the way to a near revolution in the country's distribution of power (International Crisis Group 2005). Key among them was integration of the army and police (Boshoff and Gasana Reference Boshoff and Gasana2003). The peace agreement established a rule of “ethnic balance” such that posts would be allocated to Hutus and Tutsis in a 50–50 manner, and the overall composition of the security forces was reformed “to achieve ethnic balance and to prevent acts of genocide and coups d’état” (Arusha Accords, protocol II, chapter 1, article 11). The agreement called for the integration of members of the rebel groups into a reconstituted national military. Technical experts from South Africa provided substantial input into the process, drawing on their own integration experience.Footnote 3 Precise details of integration were finally set in a “Forces Technical Agreement” signed in Pretoria in November 2003. It called for an integrated army top officer echelon with 60% FAB officers and 40% CNDD-FDD officers, and a 65–35 FAB to CNDD-FDD breakdown for the integrated police top officer echelon. Throughout the ranks of these combined security forces, the principle of “ethnic equilibrium (50–50)” would be observed, with the margin between the 60–40 and 65–35 quotas made up by Hutu members of the FAB and new recruits.
A two-phase integration process was set in motion in 2004. The first phase was the “assembly” phase, which ran from 2004 to late 2005. During this phase, some 26,000 members of the rebel armies were gathered in cantonments, with a contingent of 7,000 CNDD-FDD soldiers immediately merged into integrated units with members from the 40,000-strong FAB. During this period, 14,000 soldiers were demobilized, of which about 5,000 came from the FAB and 9,000 from the rebel forces. The second phase, beginning in late 2005 was the “rationalization” phase. It was during this phase that full integration took place, including bridging training for rebel combatants and full mixing of ex-national army members and the remaining 10,000 ex-rebels into integrated units. During this time, the military was also trimmed toward a target of 25,000 army troops and 20,000 police. Among FAB troops, the first wave of demobilization in 2004 was mostly voluntary, as the military was too preoccupied with the task of “assembly” to process retirement. Involuntary demobilization of ex-FAB, based mainly on renewed application of a 45-years-of-age eligibility and retirement threshold, began to be applied in 2005.
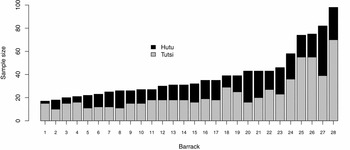
Just how deep was the ethnic integration that occurred? Figure 1 shows proportions of Hutu and Tutsi military members from a sample of barracks that were included in a survey of soldiers undertaken in the summer of 2007, three years after the integration process began.Footnote 4 We see that the ethnic integration called for in the peace agreement was apparent across the barracks, meaning that integration occurred at the lowest levels. Given that soldiers in the same barrack live and train together, integration down to this level would require regular and intense interethnic contact. For soldiers entering the new military from the FAB, ethnic integration and heightened interethnic contact are the dominant feature distinguishing their experience in the new military, as the old FAB rank structure, training protocols, and doctrine were retained by the terms of the Forces Technical Agreement.Footnote 5
Ethnic Distribution by Barrack in the Military Sample

Qualitative accounts indicate that the resulting military has functioned as a cohesive and effective institution, cited by Burgess (Reference Burgess2006), for example, as an exemplar of postwar military integration.Footnote 6 Aside from training and living together in the barracks, integrated units have fought together in counterinsurgency operations against a renegade armed group led by Agathon Rwasa that refused to disarm. They have also deployed as part of peacekeeping missions in Sudan and Somalia, being exposed to active engagements and taking dozens of killed or wounded in pursuing their mission (Sedra Reference Sedra2010). While abuses and instances of insubordination have been documented in these campaigns, in no cases have observers perceived interethnic tensions as being an issue (All Africa 2007; Human Rights Watch 2007, 2008). The situations in which questions of ethnicity have risen to the surface have been provoked by political party leaders from outside the military. This includes accusations by the leadership of Tutsi-dominated UPRONA party that the ruling CNDD-FDD violated 50–50 ethnic balance in officer promotions; the accusations were eventually dropped (Agence France Press 2007). The integration process was also a highly salient feature of the postwar transition in Burundi. In a survey of Burundi civilians conducted alongside the soldiers’ survey, 63% of respondents listed military integration as among the main points of the peace agreement, despite not having been prompted to do so.Footnote 7 Two other studies of public opinion suggested that the integrated military is viewed favorably by the Burundian public (Crawford and Pauker Reference Crawford and Pauker2008; Nindorera Reference Nindorera2007).
A MICRO-LEVEL NATURAL EXPERIMENT
We have seen that the reforms resulted in a cohesive military despite rapid and deep quota-based integration of ethnic groups whose members had been caught recently in vicious intergroup violence. To what extent is this result undergirded by micro-level transformations in behavior and attitudes? The contact literature cited above would expect that exposure to integration would result in less prejudice and less ethnic salience. The hierarchy maintenance literature would propose the opposite. The nature of the integration process provided a natural experiment that allows us to study this question. Specifically, among members of the incumbent armed forces (FAB), eligibility for the newly integrated armed forces was based on an age cutoff of 45 years of age. By comparing those just above and below the cutoff, we can isolate the effects of participating in the quota-integrated military versus being demobilized. By accounting for aspects of the demobilization experience, we obtain an estimate of the effect of exposure to ethnic integration per se for ex-FAB soldiers around 45 years of age.
To take advantage of this natural experiment, I use a database of interviews with Burundian soldiers from the multipurpose Wartime and Post-conflict Experiences in Burundi survey. I focus on men who were professional rank-and-file members or noncommissioned officers in the national army—the Forces armées burundaises (FAB)—during the war.Footnote 8 Substantively, it is FAB members and especially Tutsi FAB members that the integration process spelled a major loss in relative standing. Therefore it is for them that we can genuinely assess the relative strength of “resentment” versus “contact” effects. It was noted in the previous section that the army was dominated by a Southern, Tutsi officer corps. The FAB rank and file nonetheless included some Hutus, many of whom joined for sustainable employment after they completed a military track for Burundi's mandatory two-year public service requirement. However, the ethnic distribution is dominated by Tutsis: 892 out of 1086 (82%) FAB soldiers in our sample are Tutsi. Tutsi identity is “high status” relative to Hutu identity in this context. The literatures on contact and hierarchy maintenance each suggest that it is for high status groups that prejudice-reduction or resentment effects, respectively, ought to be most pronounced.
It is useful to consider the attributes of these soldiers relative to the general population to understand the scope conditions of this natural experiment. Entrance into the rank and file, both in peacetime and during the war, was obtained as part of recruitment calls that were issued at least once a year—and sometimes more frequently during periods of more intense fighting during the war. To gain admission, one needed to pass an exam that included written components. Given the level of illiteracy in the country, this meant that even the rank-and-file excluded the ultrapoor. At the same time, because of the relative hardship of military life, few in the upper socioeconomic strata would likely join the army, meaning that most members were drawn from a middle socioeconomic segment.
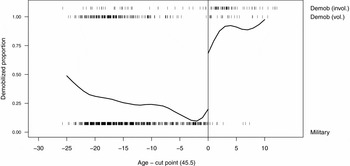
Figure 2 shows survey respondents by military/demobilization status and distance from the age eligibility cut point, set at 45.5 years of age to divide those greater than 45 years of age from those at or below 45 years. For this natural experiment, the “treatment” is participation in the integrated military and the “control” condition is being demobilized and thus not serving in the integrated military. I appreciate that this makes for an imperfect comparison, and I address strategies for isolating the effects of exposure to integration below. At the bottom of Figure 2, I display a jittered rug plot of the age distribution of ex-FAB respondents who were serving in the integrated military. At the top of Figure 2 is a jittered rug plot of the age distribution of ex-FAB respondents who were demobilized, broken down into those who voluntarily demobilized (“Demob (vol.)”) versus those who were involuntarily demobilized (“Demob (invol.)”). Also plotted in Figure 2 are curves that trace out the proportion of sample members that were demobilized by age.Footnote 9 We see that the demobilized proportion drops smoothly until the point marked 0, where it then shoots up discontinuously. A linear regression estimated within a 5-year window on either side of the cut point estimates a jump of 0.58 (robust s.e., 0.11) in the probability of being in “treatment” versus “control.” This jump at the point marked zero provides the basis for identifying causal effects of being in the integrated military versus being demobilized. It is evident from the graph that no other such jumps exist in the demobilized proportion over the range of the age variable. The fact that the jump is not from 0 to 1 indicates “fuzziness” around the cut point owing to imperfect application of the age requirement. This is due to simple procedural issues in the rollout of the integration process, described in the Online Appendix.
Demobilization Rates by Age (Centered at Eligibility Cut point of 45.5 Years Old)
Note: Proportion of FAB members demobilized by age, centered at the retirement cut point of 45.5 years of age. The black curves show results from local linear regression smoothers with a 5-year bandwidth fit to the data on either side of the age cut point (demarcated by the black vertical line). The jittered rug plot at the bottom shows the age distribution of ex-FAB members serving in the integrated military. The jittered rug plots at the top show the age distribution of involuntarily demobilized and voluntarily demobilized ex-FAB members.

A potential concern is that anyone could either volunteer to demobilize or be selected for demobilization due to judgments of being “unfit to serve.” In Figure 2, we see that the rate of demobilization decreases smoothly in age until the cut point, where it jumps sharply. The vast majority of younger demobilized soldiers chose to exit the military voluntarily. The opposite is true for older soldiers. The likely reason is that voluntary demobilization would have been more attractive for younger combatants, who had more chances for starting a life outside the military. Voluntary demobilization would become less appealing as one grows older, with only forced retirement being the way to get an older person out. This is apparent on the graph. The ratio of voluntarily demobilized approaches zero as we approach the cut point from the left. On the other side of the cut point, the proportion of voluntarily demobilized increases a bit. Based on interviews with demobilization program staff, I understand that this was due to the temporal coarseness with which demobilization waves were carried out. The national demobilization program made opportunities to demobilize available at certain discrete moments, based on practical reasons. Soldiers who had not yet been forcibly retired but were approaching the age for this to happen could elect to demobilize during these opportunities, appreciating that they would still qualify for pension benefits. Because of the sparseness of the number of demobilized to the left of the cut point, there is no way to tell whether the rate of voluntary demobilization to the right of the cut point is unusual. But because they represent a minority of cases (about 24% when looking within the 5-year bin above the cut point) and because there is a good explanation for it, there does not seem to be reason for concern about sorting on this basis around the cut point.Footnote 10
The natural experiment yields a “fuzzy” regression discontinuity design (Hahn, Todd, and Van der Klaauw Reference Hahn, Todd and Van der Klaauw2001; Imbens and Lemieux Reference Imbens and Lemieux2008). A fuzzy regression discontinuity design is a generalization of the “sharp” regression discontinuity design, which is applicable when a cutoff deterministically establishes what units are in or out of treatment.Footnote 11 As with the sharp design, the logic is that the arbitrary nature of the cut point's location means that units just to its left are likely to be similar to units just to its right in all ways except for treatment exposure likelihood and post-treatment outcomes, creating a “local” quasi-experiment. Given the discontinuous jump in the treatment assignment probability, we can identify the effect of the treatment for people defined by the value of the forcing variable at the cut point so long as two assumptions hold. First, expected values of “potential outcomes” under treatment and control are smooth around the cut point. Second, in the immediate vicinity of the cut point, treatment status is unconfounded relative to the outcomes of interest, conditional on the forcing variable. When these conditions hold, we can use an instrumental variable strategy to estimate the average treatment effect for individuals defined by the value of the forcing variable at the cut point. The excluded instrument is an indicator variable for whether the person is above or below the cut point. The treatment, in our case participation in the integrated military, is an endogenous regressor. Treatment effects can then be estimated with two-stage least squares, with robust standard errors providing the appropriate basis for inference (Imbens and Lemieux Reference Imbens and Lemieux2008).
Given the identifying assumptions, the analyst must decide on a way to model the smooth relationship between the forcing variable and outcomes and must also decide on the size of the window within which to fit the model to measure effects. The two decisions are crucial in managing the bias-variance tradeoff in regression discontinuity designs. The larger the window, the more one incorporates information about units further away from the cut point. This is undesirable, because the local quasi-experiment induced by the discontinuity only pertains to individuals in vicinity of the cut point. To the extent that inclusion of observations away from the cut point pulls the regression line away from the outcomes of individuals near the cut point, we introduce bias. This is a salient concern in the present context, as we see that the composition of the population of soldiers changes quite appreciably as we move further away from the cut point. The high rates of voluntary demobilization among younger soldiers implies that it is indicative of a form of sample selection that may make them unsuitable for the present analysis. It would be better to limit to the greatest extent our reliance on these units. At the same time, if we leave ourselves with too few observations, our estimates will be too imprecise to yield informative conclusions.
Imbens and Kalyanaraman (Reference Imbens and Kalyanaraman2009) have proposed a data-driven method to select an asymptotically “optimal” bandwidth and local regression estimator. This technique minimizes the expected prediction error at the cut point and exhibits desirable asymptotic convergence properties. An alternative approach is to fit high-order polynomial regressions in a wide window, reducing the order of the polynomial on the basis of statistical significance tests on higher-order coefficients. Green et al. (Reference Green, Leong, Kern, Gerber and Larimer2009) studied the performance of these methods in recovering an experimental benchmark. They find that local linear regression with optimal bandwidth selection, linear regression within a small substantively chosen window, and the polynomial specification search strategy in larger windows all performed rather well. Below, I estimate effects using each of these strategies: (i) the Imbens-Kalyanaraman asymptotically optimal bandwidth;Footnote 12 (ii) a bandwidth of 5 years on either side of the cut point, on the basis that this bandwidth excludes younger soldiers who voluntarily demobilized while being tight enough to invoke local linearity and providing a more ample sample size than the Imbens-Kalyanaraman bandwidth; and (iii) an wider bandwidth of 10 years with the polynomial specification search strategy studied in Green et al. (Reference Green, Leong, Kern, Gerber and Larimer2009).
Regression discontinuity designs are heralded for their high internal validity relative to other observational study methods. The discontinuity ensures that exposure to integration was not due to self-selection. This is hugely important. Self-selection into or out of the quota-integrated army would likely be a large source bias in a simple comparison of those exposed and not exposed to integration. Presumably, those who are more prejudiced or for whom ethnicity is of high salience would choose not to integrate. The simple comparison would overstate the effect of exposure to integration. A limitation is that effects are identified only for those units defined by the value of the forcing variable at the cut point. For the purposes of this study, this would mean for former-FAB soldiers aged between 45 and 46 years of age. While this is a limitation, I think it also provides estimates for an especially interesting subgroup in the context of Burundian politics. It is these individuals who, because of their age and experience, provide important role models to their neighbors and peers.
OUTCOMES MEASUREMENT
I use the natural experiment to study effects on two outcomes that are central to theorizing about the effects of quota-based integration: prejudicial behavior and ethnic salience. I measure effects on prejudice by studying how coethnicity of a respondent's enumerator affects willingness to respond to politically or ethnically sensitive questions. I measure effects on ethnic salience using responses to a battery of (nonsensitive) questions about ethnocentrism.
I use nonresponsiveness to sensitive questions as a strategy for measuring prejudice, producing an unobtrusive and incentive compatible measure (Paluck and Green Reference Paluck and Green2009b). I interpret a survey respondent's decision to answer a survey question as an expression of cooperation with the interviewer. As Tourangeau and Yan (Reference Tourangeau and Yan2007) find in a review of surveys on sensitive topics, willingness to respond to sensitive questions is an expression of trust and comfort with the enumerator. Prejudice then refers to the lower trust and comfort, and thus cooperation, with non-coethnics than with coethnics. In the context of a survey interview, this means a lower willingness to respond to sensitive questions with non-co-ethnics than with co-ethnics.Footnote 13
To construct the measure for each respondent, I first record instances of item nonresponse on a set of 23 questions that were identified ex ante by myself and the research team as ethnically sensitive (details are given in the Online Appendix). I also take responses from three questions that were posed to the enumerator about the responsiveness of the respondent. These 26 questions were then used to construct a “nonresponse index” based on a factor score from an item response model.Footnote 14 To assess prejudice using the nonresponse score, one needs to study whether nonresponse values are higher depending on whether one is interviewed by a co-ethnic or not. The survey protocol randomly assigned enumerators of different ethnicities to respondents.Footnote 15 One may estimate effects on prejudice as the difference between the coethnicity effects among integrated soldiers and nonintegrated soldiers. Thus the prejudice effect is a “difference in differences.” I apply a weighting correction to account for the fact that respondents do not have equal probability of being assigned a co-ethnic interviewer.Footnote 16
Putting all of this together yields the following model for estimating effects of integration on prejudice:
 \begin{eqnarray*}
&&\text{Non-response index}_i = \beta _0 + \beta _1\, \text{integrated}_i\\
&&\quad +\, \beta _2\, \text{non-coethnic}_i + \beta _3\, \text{integrated}_i*\text{non-coethnic}_i \\
&&\quad +\, \beta _4 (\text{age}_i-45.5) + \beta _5\, \text{below cutpoint}*(\text{age}_i-45.5)\\
&&\quad +\, \phi\, \text{higher order terms}_i + \varepsilon _i \nonumber,
\end{eqnarray*}
Three potential concerns need to be addressed about the validity of the measure. First, it may understate the true amount of prejudice. It relies on respondents ability to discern interviewers’ ethnicity. Despite the myths, it is actually quite difficult to discern ethnicity based on appearance in Burundi, although it is commonly acknowledged among Burundians that one's ethnicity is typically revealed by comportment and speech over the course of an interaction.Footnote 17 Erroneous judgments by the respondent as to the enumerator's ethnicity will attenuate estimates. I accept this tradeoff for the sake of improving the construct validity of the measure over survey questions on prejudice, which are known to yield badly biased results (Paluck and Green Reference Paluck and Green2009b; Tourangeau and Yan Reference Tourangeau and Yan2007).
Second, we must be sure that the differing interview contexts for integrated and demobilized soldiers do not affect response behavior in a manner that invalidates the measure. For example, we may worry that integrated soldiers, operating in an institutionalized military context, felt compelled to respond despite any disinclination due to prejudice, while demobilized soldiers did not feel such compulsion. In this case, the contextual differences may produce an appearance of differences in prejudice, when no such thing exists. The survey protocol helps to guard against this possibility. For interviews with serving soldiers, commanding officers were informed that soldiers taking the surveys had the right to refuse to answer any questions or to request that a question be skipped. In fact, this was often a condition raised by commanding officers for their willingness to cooperate; such a condition for cooperation did not pose a problem because it was part of the protocol anyway. Before the interviews, each respondent was read an informed-consent script that indicated clearly that the respondent could refuse to answer or request to skip any questions. During the interview, enumerators gave occasional reminders before sensitive questions, indicating that “you are not obliged to answer. Just say ‘please go to the next question’.” Anticipating some of the results below, when we view resulting response patterns, we see that baseline levels of nonresponse (that is, nonresponse under the co-ethnic interviewer conditions) are almost identical for integrated and demobilized soldiers (between 12 and 19 percent, depending on the width of the bandwidth that one applies; see Tables 6 and 7 in the Online Appendix). The same is true for nonresponse to nonsensitive questions, which is between 10 and 13 percent for both integrated and demobilized within the 5-year bandwidth (Table 4 below and Table 6 in the Online Appendix). While such evidence is circumstantial, it provides some reassurance that perceptions about nonresponse were similar across the two contexts.
Third, the construct validity of the measure requires that nonresponse to sensitive questions is driven mostly by animosity or lack of trust. An alternative possibility is that nonresponse to such questions is driven by respect, in a manner such that the respondent seeks to save the enumerator from embarrassment or guilt. In either case, the measure picks up on differential comfort and treatment conditional on co-ethnicity, but with different implications for the valences of underlying feelings. The more negative interpretation discussed above is based on an assumption that interethnic animosity tends to predominate over accommodating dispositions in the population of middle-aged soldiers under study.
To estimate effects on ethnic salience, I use a small battery of questions motivated by research on “ethnocentrism.” Ethnocentrism involves not just co-identification, but also the tendency of individuals to view their own ethnic identity as requiring them to work in the interest of their co-ethnics (Brewer and Campbell Reference Brewer and Campbell1976; Levine and Campbell Reference Levine and Campbell1972). A combination of ethnocentrism and scarcity may result in individuals perceiving their ethnic identity as important, relative to other possible modes of self-identification, not only as a means of describing oneself, but also as a likely determinant of one's life prospects and an important marker on which to condition cooperation (Akerlof and Kranton Reference Akerlof and Kranton2000; Brewer Reference Brewer1999; Chandra Reference Chandra2006; Eifert, Miguel, and Posner Reference Eifert, Miguel and Posner2010; Fearon Reference Fearon2003; Green and Seher Reference Green and Seher2003; Posner Reference Posner2004). Based on this logic, I use the following yes-or-no survey questions to construct an ethnic salience index:
-
1. “According to me is it necessary to support ideas of other [respondent's ethnic group] even if I do not fully agree with them.”
-
2. “The wellbeing of [respondent's ethnic group] people in Burundi has more to do with politics than their own hard work.”
-
3. “Things that happen to other [respondent's ethnic group] people in Burundi has an impact on my life.”
“Yes” responses were coded as 1 and “no” responses as 0. I used the responses to construct a factor score, also based on an item response model.Footnote 18 Higher scores on the factor correspond to higher perceptions of ethnic salience.
The model that I estimate in this case is given by
 \begin{eqnarray*}
&&\text{Ethnic salience index}_i = \alpha _0 + \alpha _1\, \text{integrated}_i \\
&&\quad+\, \alpha _2(\text{age}_i-45.5) + \alpha _3\, \text{below cutpoint}*(\text{age}_i-45.5) \\
&&\quad +\, \phi\, \text{higher order terms}_i + \epsilon _i,
\end{eqnarray*}
MICRO-LEVEL RESULTS
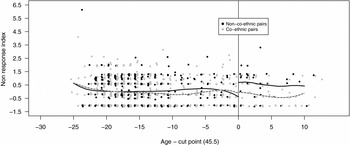
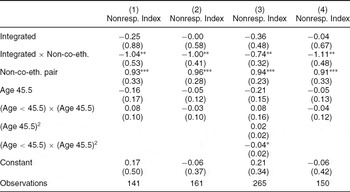
Figure 3 illustrates the results of the analysis of effects on prejudice, which are quantified in Table 1. As both the graph and table show clearly, levels of nonresponse are sensitive to the co-ethnicity condition only among those who were not integrated. For those individuals, the effect of having a non-co-ethnic interviewer is about a one standard deviation increase in the level of nonresponsiveness relative to having a coethnic interviewer. This estimate does not vary much over the different bandwidths. Note that the level of nonresponse with co-ethnics is almost identical for both integrated and nonintegrated subjects, allowing us to rule out a “military institutional effect” that would cause nonresponsiveness to be globally lower among integrated subjects. The availability of this robustness check is a benefit of the difference-in-differences measurement strategy. The last column shows estimates using the 5-year bandwidth, restricting the sample to only Tutsi respondents. Tutsis are the “high status” group in this context, and past research suggests that prejudice reduction effects of contact tend to be stronger among high status groups (Pettigrew and Tropp Reference Pettigrew and Tropp2006). In this case, we find that the results are essentially unchanged. This is unsurprising, as Tutsi respondents constitute the vast majority of the sample near the cut point (150 out of the 161 respondent in the 5-year bandwidth). Therefore data do not provide a reliable test of whether effects differ by status. Nonetheless, taken together, these results have us reject the hypothesis implied by the hierarchy maintenance literature in favor of the implications of the contact hypothesis. The Online Appendix contains a series of other robustness checks, including estimates using the raw nonresponse rates, triangular kernel estimates, and enumerator fixed effects. The conclusions remain unchanged.
Effects on Prejudice
Note: The figure plots respondents’ nonresponse index scores over their age, with age centered at the 45.5 cut point. The gray dots are for respondents that had co-ethnic enumerators, and the black dots are for respondents with non-co-ethnic enumerators. The gray and black curves are from local linear regression smoother fits (5-year bandwidth) to the co-ethnic and non-co-ethnic points, respectively. The local linear regression smoothers are fit on either side of the cut point, demarcated by the vertical black line.

Effects on Prejudice

Notes: Standard errors in parentheses.
*p < 0.10, **p < 0.05, ***p < 0.01.
Weighted two-stage least-squares estimates with standard error estimates that account for clustering by interview location/barrack. Model (1) uses an Imbens-Kalyanaraman optimal bandwidth of 4 years, and models (2) and (3) use 5-year and 10-year bandwidths, respectively. Model (4) uses the 5-year bandwidth and restricts the sample to Tutsi respondents.
While the estimates of this effect may be robust, the question remains about whether the interpretation is robust. Are there other differences in the experiences of integrated and nonintegrated soldiers that may in turn affect expressed prejudice? Current theories of group threat and prejudice (Brewer Reference Brewer1999) suggest that if there were adverse shocks associated with demobilization—e.g., a serious fall in material well-being or subjective perceptions of one's well-being—then the estimates based on the regression discontinuity alone would overstate the effect of integration on reducing prejudice. The question is whether these other differences are of sufficient magnitude to overturn the “optimistic” interpretation of the findings. The evidence suggests this would be unwarranted, although a definitive test is unavailable. As Green, Ha, and Bullock (Reference Green, Ha and Bullock2010) have demonstrated, a cross section with a single instance of quasi-random assignment is insufficient to sort out the causal ordering and dependency relationships necessary to assess whether one or another causal pathway is active.Footnote 19 The Online Appendix shows results from some indirect tests using data on perceptions of changes in economic welfare as well as income, based on the logic of group threat. I find no evidence of a significant effect on either, although the point estimate for income is not centered on zero.Footnote 20 If one controls for these economic outcomes in the regressions presented in Table 14 in the Online Appendix, the estimated effects of integration are qualitatively similar, although smaller in magnitude and noisier. Such a test is problematic, as there is no way to rule out a causal pathway whereby integration affected prejudice which in turn affected economic outcomes. Thus one is led to conclude that if anything, integration would seem to have reduced prejudice, although our best estimate of this effect may slightly overstate things given possible coincidental effects on economic outcomes.
Another way to investigate the robustness of the interpretation is to assess the extent to which these results are replicated when we use other ways of measuring prejudice. A common approach to measuring prejudice in surveys is to ask about support for policies that are likely to benefit out groups, such as equal opportunity programs, as attitudes toward such policies are often correlated with prejudice.Footnote 21 Among the set of sensitive questions, one did touch on this issue. It asked,
Which one of the following statements do you support? (1) The government should ensure equal access to higher education as well to government jobs for all ethnic groups according to the proportions of the populations in the country or (2) the government should not consider ethnicity when recruiting for jobs or higher education institutions?
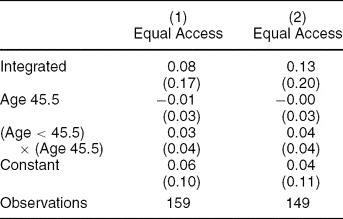
As it turns out, the rate of nonresponse on this particular question was actually quite low, only about 1% within the 5-year bandwidth (see Online Appendix section D). On the other hand, the usefulness of this measurement strategy is severely hampered by the low amount of variation in responses: almost 90% of respondents overall chose the second (“government should not consider. . .”) option, with this percentage rising to 93% within the 5-year bandwidth (see Table 6 in the Online Appendix). Nonetheless, if a prejudice-reduction effect is indeed present, we should see that reflected in higher levels of support for equal opportunity among those in the integrated military. To test this, I coded responses to the equal opportunity question such that those giving response (1) were assigned an outcome value of 1 (implying support) and those giving response (2) were assigned an outcome value of 0. Table 2 shows results using this alternative measure of prejudice. The model in the first column estimates the effect of exposure to the integrated military within the 5-year bandwidth, and the second column shows results when we restrict the sample to Tutsi respondents. The point estimates are consistent with a prejudice-reduction effect: exposure to the integrated military is associated with higher support and the effects are larger when we focus on Tutsi respondents. However, the effects are not statistically significant. On their own, these results would provide poor support for claims of a prejudice-reduction effect. But in combination with the results using the preferred behavioral measure, they lend more confidence to the idea that the effects of integration, if anything, are more to reduce prejudice than to exacerbate it.
Effects on Support for Government Ensuring Equal Access for Ethnic Groups

Notes: Standard errors in parentheses.
*p < 0.10, ** p < 0.05, *** p < 0.01.
Two-stage least-squares estimates with standard error estimates that account for clustering by interview location/barrack. All models use a 5-year bandwidth. Model (2) restricts the sample to Tutsi respondents.
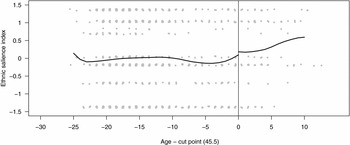
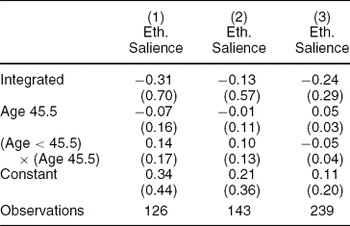
Figure 4 illustrates results for the analysis of effects on ethnic salience, which are quantified in Table 3. Ethnic salience clearly rises in age, but there is no evidence of a significant jump as one passes over the cut point that effectively divides integrated soldiers from nonintegrated soldiers. The estimates of the effects have p values that exceed 0.42 in which case there is no evidence of any substantial effect whatsoever. Neither the optimistic nor pessimistic accounts discussed above find evidence. If anything, however, the results suggest that the effects of integration are benign with respect to ethnic salience. Robustness checks in the Online Appendix, which account for co-ethnicity of the enumerator, enumerator fixed effects, and intermediate economic outcomes, do not alter these conclusions.
Effects on Expressions of Ethnic Salience
Note: The figure plots respondents’ ethnic salience index scores over their age, with age centered at the 45.5 cut point. The black curve is from local linear regression smoother fits (5-year bandwidth) on either side of the cut point, demarcated by the vertical black line.

Effects on Ethnic Salience

Notes: Standard errors in parentheses.
*p < 0.10, ** p < 0.05, *** p < 0.01.
Two-stage least-squares estimates with standard error estimates that account for clustering by interview location/barrack. Model (1) uses an Imbens-Kalyanaraman optimal bandwidth of 4 years, and models (2) and (3) use 5-year and 10-year bandwidths, respectively.
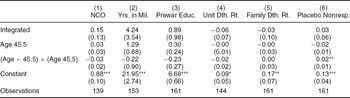
As a further robustness check, I conduct “placebo” tests with variables that could not possibly have been causally affected by treatment (Imbens and Lemieux Reference Imbens and Lemieux2008). One wants to do this on pretreatment variables that have strong potential to confound were they to exhibit discontinuities near the cutoff. I located five such variables in the survey data:
-
Noncommissioned officer status. Our data consist of rank-and-file and NCOs. We might imagine that NCOs, being of higher rank, would be more likely to react with resentment to the integration of “irregular” rebel forces into the new military.
-
Years in the military. A similar argument as above may be said for those with more time in the military.
-
Years of education, prewar. Years of education may be associated with a more tolerant world view, on the basis that ignorance and intolerance go together. Alternatively, prewar education levels are a reliable measure of socioeconomic status prior to integration. It may be that higher socioeconomic status is associated with less tolerance in postwar Burundi, as it is those who were more privileged before the war that face a greater “threat” from the redistributive changes brought about as a result of the war.
-
Unit death rate. Those from units that suffered higher death rates may be more ethnically intolerant, as violence during the war was ethnically colored.
-
Family death rate. The same argument as above may apply for those whose families suffer higher rates of wartime mortality.
In addition, I use the rate of item nonresponse for nonsensitive questions in the survey as a further placebo test on whether it was the interaction of coethnicity and question-related sensitivity that gave rise to the patterns in Figure 3 and Table 1. This is labeled as “Placebo nonresp.” in Table 4.
Placebo Tests

Standard errors in parentheses.
*p < 0.10, ** p < 0.05, *** p < 0.01.
Notes: Two-stage least-squares estimates with standard error estimates that account for clustering by interview location/barrack. All models are fit using the 5-year bandwidth.
Table 4 shows the results of the placebo tests. Estimates are shown for the preferred window (5-year) from the analysis above, based on TSLS regressions using the same specification as used in the analysis of ethnic salience scores. For none of the variables do we find compelling evidence of a confounding discontinuity.
The micro-level evidence buttress the interpretation drawn above from the macro-level evidence: quota-based ethnic integration carries some promise to alleviate ethnic tensions and produce cohesive institutions. There is no indication at the micro level that integration exacerbated prejudices or intensified ethnic salience among this crucial segment of Burundian society.
DISCUSSION AND CONCLUSION
It is incumbent upon political scientists to study policies that might be used to transcend ethnic conflict. Among the policy options, ethnic quotas and quota-based ethnic integration of state institutions are common features of transitional agreements. Current theory points in two opposite directions on the likely effects. Theories based on the contact hypothesis are optimistic about the how integration may reduce conflict, while theories based on hierarchy maintenance are pessimistic. Using these theories as a guide, I examine the consequences of quota-based integration in Burundi's military after a brutal and ethnically charged civil war. The evidence shows that at the macro level, the new Burundian military operates as a deeply integrated and cohesive institution. This is indicative of the possibility of quota-based integration in difficult settings such as postwar Burundi. At the micro level, evidence from a natural experiment suggests that this cohesion may be undergirded by the fact that integration itself reduced prejudice and caused no apparent increase in ethnic salience among soldiers. This is indicative of the promise of quota-based integration as a strategy for addressing ethnic conflict in this difficult setting.
A question that emerges is whether the results observed in this case study have relevance to other cases. Rwanda, for example, has pursued a “top-down” strategy of assimilating former Hutu fighters into a national force that has banned ethnic references (Burgess Reference Burgess2012), while Bosnia's three ethnic militaries have not been integrated but rather “frozen” into three pillars (Gaub Reference Gaub2011, 93–111). Are we to infer that were Rwanda or Bosnia, say, to pursue quota-based ethnic integration in the manner of the Burundian military, good things should follow?Footnote 22 Or should the mere fact that quota-based integration was not pursued in these latter cases make us skeptical? It is not clear that Burundi's integration process is endogenous to a context that immediately limits the generality of these findings. For certain, we can say that it is not levels of violence or past interethnic animosity per se that distinguishes Burundi from these other cases. In addition, as discussed in detail in Samii (Reference Samii2012a), the push for quota-based integration did not come simply from Burundian policy-makers’ consideration of the domestic situation in all its peculiarities, but also from strong, exogenous pressure from South African policy makers who brought their own country's model of quota-based integration to bear in their pivotal mediation role in Burundi's peace process.
What are the implications for research on integration and contact? In the social psychology literature, Dixon, Durrheim, and Tredoux (Reference Dixon, Durrheim and Tredoux2005) have launched a prominent critique, suggesting that research on integration and contact needs a “reality check.” This study stands up well to certain aspects of their critique, however. For example, Dixon, Durrheim, and Tredoux (Reference Dixon, Durrheim and Tredoux2005) suggest that many studies of contact focus on individual-level outcomes in small-scale, accommodating, and otherwise “rarefied” situations; positive findings in such research thus provide little reason to believe that a formula has been found for addressing hard cases of intergroup hostility at the societal level. This study is less vulnerable to these particular concerns. A virtue of the prejudice reduction measurement strategy is that it allows us to study how contact translates into generalized prejudice reduction. In addition, there is little reason to believe that integration of groups of soldiers who fought determinedly against each other provides an “easy” context. Third, successful integration of a salient national institution like the military, while being “rarefied” in certain respects, may have important societal demonstration effects as a public “reconciliation event” (Gaub Reference Gaub2011, 4–5; Long and Brecke Reference Long and Brecke2003).Footnote 23 Even Krebs (Reference Krebs2004), who takes a mostly pessimistic view on the role of military integration for reducing intergroup conflict in society at large, acknowledges that if military members have influence in politics (as they do in places like Burundi), then socialization within the military may shape politics and therefore affect society more generally. Finally, reducing prejudice among military personnel may help in ensuring that military institutions fulfill an unbiased, protective role when responding to internal security problems as opposed to resorting to ethnic favoritism (Horowitz Reference Horowitz1985, chaps. 11,12). For these reasons, the findings here do indeed have important implications for societal level intergroup conflict.
Nevertheless, other aspects of Dixon, Durrheim, and Tredoux (Reference Dixon, Durrheim and Tredoux2005)’s critique are not well addressed by the design of this study. For example, it may be true that even when integration is attempted within an institution, there will be a “tendency for informal systems of preferential segregation to re-emerge” at the micro level (p. 704). To what extent are patterns of segregation and hierarchy re-created, perhaps in subtle but meaningful ways, despite attempts at integration, and what consequences does this have for whether integration can be genuinely transformative? Institutionally, the 2003 agreement reduces the scope for such segmentation, because it dictates that the integrated military obey a principle of ethnic balance at all officer ranks. As Figure 1 indicates, the mixed composition of units combined with the officer level quotas implies that Tutsis sometimes come under Hutu command and sometimes do not (and vice versa). Also, the context of this study is particular in that the historically disadvantaged group (the Hutu) controls the government.Footnote 24 But the possibility remains that informal hierarchies may undermine the ethnic equalization that has been prescribed institutionally. To address this question satisfactorily, one would want to spend time with integrated units and discreetly observe interactions. Tredoux and Dixon (Reference Tredoux and Dixon2009) provide an interesting model for such fine-grained research. A final aspect of the current critique of contact and integration research is that contact and integration may generate false hopes among low status or historically disadvantaged groups (Dixon et al. Reference Dixon, Tropp, Durrheim and Tredoux2010, Reference Dixon, Levine, Reicher and Durrheim2012; Saguy et al. Reference Saguy, Tausch, Dovidio and Pratto2009). Because the vast majority of the subjects in the micro-level quasi-experiment were Tutsis, and therefore from the “high status” group, this study cannot provide much traction on that issue. Future studies should do so.
The findings in this study come as a call for more research on how quota-based integration may be used to address legacies of exclusion and ethnic conflict. Do the sorts of effects recognized here persist beyond the confines of the military? To what extent do the “local” effects among those directly exposed to integration reverberate societally? To what extent are the varying outcomes of integration due to process and strategy versus hard-to-change structural conditions (Burgess Reference Burgess2012)? The data and natural experiment in this article are far from perfect, and these imperfections shed light on what might be fruitful in designing further research. Institutional integration processes often unfold in stages. If such a process can be designed such that these units within an institution are subject to integration in stages in a more or less random manner, then one may be able to assess the effects of such integration more cleanly. If such a research strategy were to incorporate alternative policies, such as ethnically blind recruitment, one could could get a sense of comparative effectiveness as well.




Comments
No Comments have been published for this article.