1 Introduction
Software project managers can greatly benefit from using mechanisms that not only capture and represent software project management knowledge but also cater to its collaborative exchange. Software project management antipatterns suggest commonly occurring solutions (Brown et al., Reference Brown, Malveau, “Skip” McCormick and Mowbray1998) to problems regarding dysfunctional behaviour of managers or pervasive management practices that inhibit software project success (Laplante & Colin, Reference Laplante and Colin2006). These mechanisms can manage all aspects of a software project more effectively by bringing insight into the causes, symptoms and consequences, and by providing successful repeatable solutions (Brown et al., Reference Brown, “Skip” McCormick and Thomas2000). The readers that are not familiar with antipatterns can use Laplante and Colin (Reference Laplante and Colin2006) and Brown et al. (Reference Brown, “Skip” McCormick and Thomas2000) for an introduction to the topic.
Software project management antipattern catalogues (Brown et al., Reference Brown, Malveau, “Skip” McCormick and Mowbray1998, Reference Brown, “Skip” McCormick and Thomas2000; Laplante & Colin, Reference Laplante and Colin2006) have been documented using informal templates and unofficial structures that attempt to make antipatterns easy to remember. Such structures do not readily support knowledge sharing and reuse because they can only be used among people. Furthermore, the amount of defined antipatterns and the amount of printed documentation is increasing to the extent that it becomes difficult to be effectively used. The different templates that can be used to document a software project management antipattern, can cause further confusion to software project managers. As a result, software project management using antipatterns has not become a common practice in the practitioners’ community. Antipattern ontologies (Settas & Stamelos, Reference Settas and Stamelos2007a) can encode important software project management knowledge into a computer understandable form that introduces antipatterns to the Semantic Web scenario and allows the sharing and reuse of this knowledge by software tools. This can be seen as the solution to heterogeneous antipattern data on the Web. However, ontologies can introduce heterogeneity themselves because the same entity can be described with different names or in different ways (Euzenat & Valtchev, Reference Euzenat and Valtchev2004). Therefore, for software project management antipatterns to become a widespread practice, not only better-structured software project management antipattern representations are required, but it is also important to address the issue of identifying similar antipattern ontologies.
In this paper, it is investigated how the technology of social networks can benefit antipattern ontologies by incorporating links between actors and concepts in the model of ontologies. Social Network Analysis (SNA) techniques are used in this case in order to assist software project managers by extracting relationships from one network of the three-layered semantic social model to another. For this purpose, we introduce a three-layered antipattern semantic social network model which involves the social network, the ontology network and the concept network (Jung & Euzenat, Reference Jung and Euzenat2007; Mika, Reference Mika2007a). By using similarity measures of SNA in the concept layer of the model, we can infer new links between antipattern ontologies. Since ontologies can be considered as (labelled, directed) graphs, graph analysis techniques and particularly SNA is a suitable answer for this need (Hoser et al., Reference Hoser, Hotho, Jaschke, Schmitz and Stumme2006). However, uncertainty concerns every aspect of ontologies and is one of the most important criteria that need to be taken into account in the selection of an appropriate knowledge representation (Taniar & Rahayu, Reference Taniar and Rahayu2006). Therefore, it is important to represent and reason about the uncertainty regarding the identified links between antipattern ontologies.
Furthermore, data collection on antipattern ontologies is only based on the managers’ own experience (i.e. knowledge regarding other related antipatterns), hence contains many sources of uncertainty. This may not ensure that the resulting antipattern semantic social network is complete and contains the required data. Knowledge of these sources of uncertainty, paired with the creation of analysis techniques that can utilize this uncertainty information, will improve the validity of SNA results (Koelle et al., Reference Koelle, Pfautz, Farry, Cox, Catto and Campolongo2006). Bayesian Networks (BNs) (Jensen, Reference Jensen2001) provide a natural, logical and probabilistic framework to quantify the uncertainty of the data collected using the proposed framework. Thus, this paper also aims to explore the capabilities of enhancing the antipattern ontology using SNA and BNs.
The benefits of applying semantic social networks to antipattern ontologies are illustrated using an example community of software project management antipattern ontologies. The dataset was collected using existing antipatterns which have been documented mainly in books (Brown et al., Reference Brown, Malveau, “Skip” McCormick and Mowbray1998, Reference Brown, “Skip” McCormick and Thomas2000; Laplante & Colin, Reference Laplante and Colin2006), personal correspondence (McCormick, Reference McCormick1999) and a small number of software project management blogs. The proposed framework will ultimately add more value to the ontological representation of software project management antipatterns, and will provide managers with a new toolset that can be used to identify relationships between antipattern ontologies. This paper is organized as follows: Section 2 describes the background and work related to our research. Section 3 describes the software project management antipattern ontology. Section 4 describes the semantic social network including data collection and SNA. Section 5 describes the use of BNs in the antipattern ontology and how BNs are used to augment SNA. Finally, in Section 6, the findings are summarized, future work is proposed and conclusions are drawn.
2 Backgound and related work
2.1 Background
According to Mendes and Abran (Reference Mendes and Abran2005), the development of an ontology allows researchers to share and reuse knowledge accumulated until now in a specific field (i.e. software project management antipatterns). In this paper, new means for automatic interpretation of this knowledge using information systems or intelligent software agents is provided. However, there is a growing view (Jung & Euzenat, Reference Jung and Euzenat2007; Mika, Reference Mika2007a) that creating the Semantic Web is a social process. Only the users of the Semantic Web have the necessary associative and interpretive capability for creating and maintaining ontologies. According to Mika (Reference Mika2007a), the meaning and maintainability of conceptual structures can be improved by incorporating links between actors and concepts in a model of ontologies. Such a top-down interlinked network that consists of a social, ontology and concept network is defined as a semantic social network (Jung & Euzenat, Reference Jung and Euzenat2007; Mika, Reference Mika2007a). In this paper, the following semantic social network structure is used (Jung & Euzenat, Reference Jung and Euzenat2007):
• Social Network, relating people on the basis of common interest;
• Ontology Network, relating ontologies based on relationships or similarity;
• Concept Network, relating ontology concepts based on relationships or similarity;
The huge amount of social network data that is available gives researchers an unprecedented level of detail in SNA (Sowe et al., Reference Sowe, Stamelos and Angelis2006), along with the potential for gaining new understanding, making useful predictions, and decision making (Mika, Reference Mika2007b). However, the variety of ways to collect data for SNA reflects the inherent difficulty in capturing reliable and consistent information about human social relationships. The uncertainty of this information limits the applicability of traditional methods of SNA (Koelle et al., Reference Koelle, Pfautz, Farry, Cox, Catto and Campolongo2006). Furthermore, the perception of a social network by each person has a subjective bias. Koelle et al. (Reference Koelle, Pfautz, Farry, Cox, Catto and Campolongo2006) have mentioned numerous studies which show that individuals can identify their social networks with only a moderate level of accuracy, and their perception of the social network will change significantly over time. Finally, there is also the possibility of measurement errors, and the possibility that individuals may not be completely truthful (Degenne & Forse, Reference Degenne and Forse1999).
Bayesian Networks are directed network graphs that consist of a set of variables and a set of directed links between variables. These causal networks provide the means to structure a situation for reasoning under certainty and can represent causal relations between different events. BNs have been proposed as an appropriate formalism that can be used to enhance SNA (Koelle et al., Reference Koelle, Pfautz, Farry, Cox, Catto and Campolongo2006). In this paper, the intended users of such a framework are software project managers who wish to infer new relationships between antipattern ontologies, using SNA results. Applying BNs will quantify this uncertainty and provide new capabilities to discover new links and nodes in the network that could not be discovered otherwise (Koelle et al., Reference Koelle, Pfautz, Farry, Cox, Catto and Campolongo2006).
2.2 Related work
Ontology has recently been proposed as an appropriate formalism that can define the similarity between two instances (Mika, Reference Mika2007a). Ontology Web Language (OWL) can be used to identify resources and to represent their (in)equality using the owl:sameAs and owl:differentFrom properties. However, these are only the basic building blocks for defining equality and only aim to capture knowledge about the identity of resources that can lead to conclude the (in)equality of resources (Mika, Reference Mika2007b). Following Jung’s framework (2007), in this paper, the similarity on the concept layer shall be used to indicate similarity at the ontology level. This framework provided principles for extracting similarity between concepts and propagating this similarity to a distance and ontology relation between ontologies. In Jung and Euzenat (Reference Jung and Euzenat2007), after establishing distance at the concept level of a semantic social network, a new distance at the ontology level is computed. Semantic network analysis was used in order to help people find peers with similar interests and can also be used to choose to match the closest ontologies with regard to distance. The proposed equations can establish the distance between two sets of classes by finding a maximal matching, maximizing the summed similarity between the classes. The authors follow Euzenat and Valtchev’s (Reference Euzenat and Valtchev2004) methodology, who addressed the issue of ontology alignment in OWL using a method designed, for instance, for similarities in object-based languages. However, this similarity measure is not semantically justified and does not cover all syntactic constructions of OWL-Lite (Euzenat & Valtchev, Reference Euzenat and Valtchev2004). Instead of using such distance measures between ontology concepts, our approach is based on SNA similarity results at the concept level and the use of BNs to handle meta-information with a level of uncertainty into account in order to augment SNA and search in the social network.
Software design patterns have been recently represented using ontologies (Rosengard & Marian, Reference Rosengard and Marian2004; Girardi & Lindoso, Reference Girardi and Lindoso2006). Dietrich and Jones (Reference Dietrich and Jones2007) recently presented an approach that uses social networking and Semantic Web technology to share knowledge within the software engineering community. The authors proposed the use of existing Web 2.0 services, such as social bookmarking and blogs, as the infrastructure for sharing knowledge artefacts. The presented WebOfPatterns open source project is an Eclipse based plugin. This tool can be used to discover design pattern definitions in social networks, define and publish design patterns, rate design patterns, establish the trustworthiness of patterns found, and finally X-ray Java projects for instances of discovered patterns (Dietrich & Jones, Reference Dietrich and Jones2007). However, due to the fundamental differences between design patterns and software project management antipatterns, the use of this existing framework that is based on software design patterns is inhibited. Furthermore, software project management knowledge that can be encoded in antipatterns is tacit knowledge based on experience and cannot be detected in software code using a code scanner.
Semantic Web technology and intelligent systems have been recently joined together to provide the architecture of web-based intelligent system that uses antipattern ontologies. The Software Project Management Antipattern Intelligent System (PROMAISE) (Settas & Stamelos, Reference Settas and Stamelos2007b) can bring the software project managers’ attention to focus on antipatterns that are specifically suitable to a specific software project. Hence, a software project manager who wishes to use antipatterns will not require any expertise to determine which antipattern is most suitable at a given moment. PROMAISE serves as a framework to allow for an antipattern knowledge base to be created and updated dynamically using OWL antipattern ontologies. However, this approach relies on software project managers for the creation of instances of the antipattern ontology using OWL. It is therefore very important to provide software project managers with a methodology that will assist software project managers in identifying similar related antipatterns. Section 4 describes how an antipattern semantic social network can be used in order to address these issues.
3 The software project management antipattern ontology
Various formalisms can be used to express ontologies, such as the Knowledge Interchange Format and knowledge representation languages. However, a generally accepted notation for representing ontologies has not been proposed yet. The Unified Modelling Language notation (UML) has been successfully used for a wide range of ontology-related tasks, for a variety of agent infrastructures and knowledge-base implementations, and finally as a graphical front-end for an ontology representation language (e.g. DAML) (Kogut et al., Reference Kogut, Cranefield, Hart, Dutra, Baclawski, Kokar and Smith2002). UML was chosen to represent the antipattern ontology for several reasons. UML uses modelling primitives specific to objects and their role in object-oriented systems. However, if these constructs of the languages and the differences in scope are ignored, there is still a significant overlap in the expressiveness of object-oriented models of a domain and ontological models. Furthermore, several software tools have been developed that enable the representation of ontological knowledge using UML (Kogut et al., Reference Kogut, Cranefield, Hart, Dutra, Baclawski, Kokar and Smith2002). Finally, an eXtensible Stylesheet Language Transformation (XLST) based approach can be used on UML models in order to generate OWL (Gasevic et al., Reference Gasevic, Djuric, Devedzic and Damjanovic2004). Such tools are deployed because practitioners are already familiar with UML and there is often no need to learn how to use specific ontology tools (Gasevic et al., Reference Gasevic, Djuric, Devedzic and Damjanovic2004).
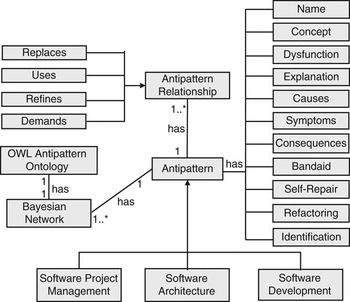
In the design of the antipattern ontology (Figure 1), UML notation was used to describe the different relationships that an antipattern might have according to the specification of the antipattern ontology (Settas & Stamelos, Reference Settas and Stamelos2007a). In the construction of an ontology, existing ontologies must be integrated. As a result, following the recent specification of the design pattern ontology (Girardi & Lindoso, Reference Girardi and Lindoso2006), the antipattern ontology has been specified using the notion of antipattern relationships. In the specification of the antipattern ontology, antipatterns and their relationships must be included (Girardi & Lindoso, Reference Girardi and Lindoso2006). These are expressed according to a formalism which was originally proposed for software systems (Conte et al., Reference Conte, Fredj, Hassine, Giraudin and Rieu2002):
The Generic Antipattern Ontology Unified Modelling Language Diagram, adopted from Settas and Stamelos (Reference Settas and Stamelos2007a)

• If the refactored solution of an antipattern A1 uses an antipattern A2, then A1 uses A2.
• If the explanation of an antipattern A1 is a specialization of an antipattern A2, then A1 refines A2.
• If the application of an antipattern A2 is demanded in the application of antipattern A1, then A1 demands A2.
• If an antipattern A1 and an antipattern A2 provide different refactored solutions for the same problem then, antipattern A1 replaces A2.
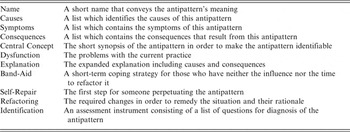
The antipattern ontology (Figure 1) takes into account the three different kinds of antipatterns, which, according to Brown et al. (Reference Brown, Malveau, “Skip” McCormick and Mowbray1998), are software development, software architecture and software project management antipatterns. For the specification of the software project management antipattern ontology, attributes from Laplante and Colin’s (Reference Laplante and Colin2006) template (see Table 1) were used in conjunction with the symptoms, causes and consequences of an antipattern.
Antipattern attributes for the specification of the antipattern ontology

In this paper, the proposed framework uses the causes, symptoms and consequences ontology concepts at the concept level of the semantic social network. This data will be processed using SNA that will be presented in the following section. The use of BNs in the antipattern ontology, the correspondence of a BN model to OWL and the use of BNs to enhance SNA are described in Section 5.
4 Towards a semantic social network of software project management antipatterns
4.1 Data collection
Data collection in SNA aims to collect relational data in a reliable manner and is typically carried out using questionnaires or observation techniques that aim to ensure the validity and completeness of the network data (Mika, Reference Mika2007b). Records of social interaction (i.e. publication databases, meeting notes, newspaper articles, documents and databases of different sorts) can also be used to build a model of social networks. However, the software project management antipattern community still remains undefined and there are no records of social interaction. Furthermore, software project managers might not want to describe explicit relationships with other managers and might not be aware of implicit relationships. Due to the problems that exist with antipattern documentation, only a small number of software project management antipatterns exist on the Internet at the moment. Hence, creating a semantic social network by relying solely on Internet resources (i.e. social bookmarking, blogs) is not feasible. According to Mika (Reference Mika2007b), what is not on the Web cannot be extracted from the Web, which means that there are a number of social settings that can only be studied using offline methods. Therefore, secondary sources such as documents (Jung & Euzenat, Reference Jung and Euzenat2007) can be used in order to populate the antipattern ontology social network with data. For the purposes of this paper, data on 16 antipatterns were collected. In all, 13 antipatterns were collected from software project management antipattern books (Brown et al., Reference Brown, Malveau, “Skip” McCormick and Mowbray1998, Reference Brown, “Skip” McCormick and Thomas2000; Laplante & Colin, Reference Laplante and Colin2006), private correspondence (McCormick, Reference McCormick1999) and three antipatterns were collected from three software project management blogsFootnote 1,Footnote 2,Footnote 3.
Software project management antipatterns can be related to each other according to their causes, symptoms and consequences (McCormick, Reference McCormick1999). For this reason, in this paper, four sets of data for analysis at the ontology level were used.
• General. The General model does not take into account causes, symptoms or consequences individually. The General antipattern model considers two antipattern ontologies to be connected if there is a connection through either their causes, symptoms or consequences.
• Causes. The Causes antipattern model considers two antipattern ontologies to be connected if there is a connection through their causes.
• Symptoms. The Symptoms antipattern model considers two antipattern ontologies to be connected if there is a connection through their symptoms.
• Consequences. The Consequences antipattern model considers two antipattern ontologies to be connected if there is a connection through their consequences.
4.2 Social network analysis
Social Network Analysis studies the social relations among a set of actors (software project managers, antipatterns, etc.) and focuses on applying analytic techniques to the relationships between individuals and groups (Wasserman & Faust, Reference Wasserman and Faust1994). Social networks are usually represented as graphs, depicting relationships or connections that exist between the entities being studied. The interpretation is done by mapping and measuring of relationships and information flow between the entities. SNA provides both a visual and a mathematical means to analyze the relationships that may exist (Hanneman & Riddle, Reference Hanneman and Riddle2005). This aims to investigate how those relationships can be used to infer additional information about the individuals and groups (Degenne & Forse, Reference Degenne and Forse1999).
After reviewing the relevant literature (Carrington et al., Reference Carrington, Scott and Wasserman2005) regarding the most appropriate software for carrying out SNA, UCINET 6Footnote 4 was selected. This choice was made on the basis of being the best known and most frequently used software for SNA. Furthermore, UCINET is offered in a 30-day evaluation without registration. UCINET has been criticized for having meagre visualization aspects (Carrington et al., Reference Carrington, Scott and Wasserman2005) but the export possibilities to NetDraw can be used to overcome these limitations.
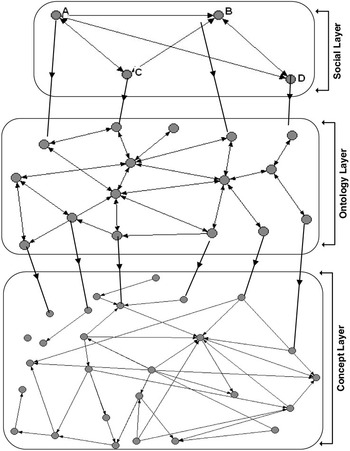
In this section, we shall introduce the key concepts of SNA and discuss how we built and constructed the three layers of the antipattern semantic social network; consisting of Antipattern authors-by-Antipattern authors (social layer), Antipattern ontologies-by-Antipattern ontologies (ontology layer), and a Concepts-by-Concepts network layer (concept layer). Figure 2 illustrates the three different layers of the antipattern semantic social network. Each layer was created with UCINET and NetDraw (Borgatti et al., Reference Borgatti, Everett and Freeman2002). The following sections describe how each layer was created.
Example of links in the antipattern ontology semantic social network, adopted from Jung and Euzenat (Reference Jung and Euzenat2007)

4.3 Building antipattern ontology affiliation networks
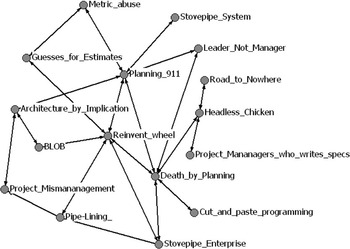
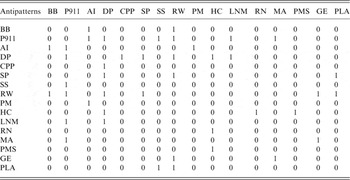
While the relationship between antipatterns, their causes, consequences, and symptoms can be observed from numerical data, social networks visualization techniques serve as a vital tool in identifying how the antipattern ontologies are affiliated. Affiliation networks are special types of social networks. They describe the associations of actors and events or between causes and consequences (Wasserman & Faust, 1994). In an affiliation network, a link exists between two actors (i.e. antipattern ontologies) if they belong to the same event or have something in common. Such affiliations can be in any of the following forms: Antipattern authors-by-antipattern authors, antipattern ontologies-by-antipattern ontologies or concepts-by-concepts networks. Building the antipattern ontology affiliation network proceeded in two stages. In the first stage, information on antipatterns was used to generate antipattern ontology-by-antipattern ontology data matrix P. An excerpt of the data matrix is shown in Figure 3. The adjacency matrix describes the affiliation of an antipattern ontology with another antipattern ontology. This is analogous to a person belonging to a group (‘persons × groups’) or persons attending an event (‘persons × events’) (Sowe et al., Reference Sowe, Stamelos and Angelis2006).
A bipartite graph showing the general model of antipattern ontologies as nodes

In the adjacency matrix (Table 2), each cell Pij indicates that antipattern ontology ith is affiliated with another antipattern ontology jth in the network but no antipattern ontology is affiliated to itself. The affiliation or commonality between the antipattern ontologies can be any one or more of the following:
Adjacency matrix for the general antipattern ontology network

BB = BLOB; P911 = Planning 911; AI = Architecture by Implication; DP = Death by Planning; CPP = Cut and Paste Programming; SP = Stovepipe Enterprise; SS = Stovepipe System; RW = Reinvent wheel; PM = Project Mismananagement; HC = Headless Chicken; LNM = Leader Not Manager; RN = Road to Nowhere; MA = Metric abuse; PMS = Project Managers who writes specs; GE = Guesses for Estimates; PLA = The Pipe-Lining Antipattern.
1. The antipatterns are caused by the same software project management practice.
2. The antipatterns have the same symptoms in a software project.
3. The antipatterns have the same consequences that result from applying an antipattern.
The data was used to generate a UCINET DL file type. The second stage involves the visualization of the network. Since this network analysis focuses on some form of social relations, the data were constructed so that there exist a dyadic or 1-mode data set (Borgatti et al., Reference Borgatti, Everett and Freeman2002). For each data set, NetDraw, a component of UCINET, was used to visualize how the nodes or antipatterns are linked. Figure 3 illustrates a social network created with UCINET and NetDraw (Borgatti et al., Reference Borgatti, Everett and Freeman2002) showing the relationships between antipattern ontologies using the collected data (Table 2).
4.4 Social networks analysis measures
SNA visualizations are only useful to the extent that they are combined with some quantitative and qualitative measures to help explain the relationships that exist between the entities being studied. SNA researchers use various measures to explain the behaviour of networks.
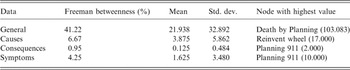
• Betweenness: Betweenness is the degree an antipattern ontology lies between other ontologies in the network. It is the extent to which an antipattern ontology is directly connected only to those other ontologies that are not directly connected to each other. This kind of antipattern ontology is a hub and it provides a crucial link that joins all the antipatterns in the ontology network. An antipattern with high betweenness indicates that it plays a role in many other antipatterns. According to Freeman (Reference Freeman1979), betweenness centrality measures information control and can be defined as:

where p is the path between nodes e and e′ in the antipattern graph (AG) with edges (e′, e′′). And sp i (e, e′) is the set of shortest paths between e and e′.
The calculated betweenness and normalized betweenness centrality of each vertex gives the overall network betweenness centralization. This network centralization index measures (actor-by-centrality) are shown in Table 3.
Betweenness centrality measures

The Planning 911 antipattern ontology has the highest betweenness centrality in both the consequences and symptoms networks, and thus plays a greater role in almost all the ontologies. Such is its central role that it has the second highest (80.167) actor-by-centrality in the general antipattern ontology network.
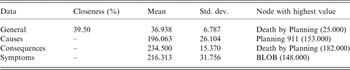
• Centrality Closeness: This measure refers to the degree an antipattern ontology is near to all other antipatterns ontologies (or its closeness to other antipatterns) in a network (directly or indirectly). It is the ability to access information or influence by being close to other antipattern ontologies in the network. Thus, closeness is the inverse of the sum of the shortest distances between each antipattern and every other antipattern in the network. In the case of antipattern ontologies, the central antipatterns are the ones that are extensively interdependent with other antipattern ontologies. This is shown by the number and strength of dependencies of the antipatterns. Hubs or influential antipatterns, which are more likely to be in the centre of the network, often have a larger closeness centrality score. Closeness is defined as (Wasserman & Faust, Reference Wasserman and Faust1994):
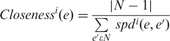
where N is a set of nodes in AG and spd i is the shortest distance between nodes e and e′.
The actor-by-centrality closeness network centralization of the latter three antipattern models are not computed since these networks form unconnected graphs (see Table 4).
• Cohesion and Cliques: Cohesion exists between two or more antipatterns in a network when they have a tight bond and strongly influence each other. A clique forms when every antipattern is directly tied to every other antipattern around a particular cause, consequence, or symptom. The number of cliques found in each antipattern are:
Table 4Closeness centrality measures

– General model: four cliques;
1. : Planning_911 Death_by_Planning Reinvent_wheel
2. : Planning_911 Death_by_Planning Leader_Not_Manager
3. : Death_by_Planning Stovepipe_Enterprise Reinvent_wheel
4. : Stovepipe_Enterprise Reinvent_wheel Pipe-Lining_Antipattern
– Causes model: one clique
1. : Stovepipe_Enterprise Reinvent_wheel Pipe-Lining_Antipattern
– The Consequences and Symptoms models have no cliques
• Clustering Coefficient: The clustering coefficient is a measure of the likelihood that two associates of a node are associates themselves. That is, if two ontologies have a high clustering coefficient, there is high chance that they are closely related and the presence or implementation of anyone of them will highly influence the other. Thus, a higher clustering coefficient may indicate the presence of a clique. Therefore, the general antipatterns social network with four cliques will have a high clustering coefficient than the causes antipattern social network. For a vertex (v) in an antipattern network graph (AG), the clustering coefficient (C_Antipattern) is given by:


where Kv is the number of antipatterns neighbours of v, and E(v) is the number of non-weighted edges between them. The clustering coefficient helps to identify hot spots of ontologies which is crucial for project management. When this parameter is high for an individual antipattern ontology, the implementation of that ontology adversely affects other neighbouring ontologies. Somehow, such patterns foster connections among its neighbourhood. This is also a measure of the degree of cohesiveness in the various antipatterns networks. As such, we do not expect any C_Antipattern values in the latter two antipattern social networks as shown in Table 5.
Clustering coefficient measures

NA = not applicable.
• Density: The density of a network is the degree to which the network is filled with ties. It is the proportion of possible ties between a set of nodes or ontologies that actually do exist in the network. The density of an antipattern ontology can be expressed as:

The Density (matrix average) for each of the antipattern ontology-by-antipattern ontology models is given in Table 6. The density is highest with the antipattern with most number of cliques, and highest clustering coefficient.
Block/average density measures

4.5 Social network analysis measures for the concept layer
The third layer in the three-layered ontology, the concept layer, was built in a similar manner to the preceding antipattern networks. This section describes the SNA measures applied at this layer. In an antipattern ontology concept affiliation network, what link the antipatterns are the concepts they have in common. In this paper, these are considered to be the causes, symptoms and consequences of an antipattern. SNA measures described in the preceding layer were used in the concept layer (Table 7).
Social network analysis measures for the Concept layer

*The antipattern Concept layer network is not connected. Technically, closeness centrality cannot be computed, as there are infinite distances. The concepts in the network with the highest inCloseness and outCloseness are Delivery_Delays (6.878) and Vision_but_no_Plan (8.000).
The nine cliques in the antipattern Concept layer network are:
1. : Control_lessens Delivery_Delays Focus_on_Cost
2. : Delivery_Delays Focus_on_Cost Vision_but_no_Plan
3. : Delivery_Delays Focus_on_Cost Analysts_are_ahead_but_testers_behind
4. : Loss_of_key_staff Focus_on_Cost Vision_but_no_Plan
5. : Glass_Case_Plan Control_lessens Focus_on_Cost
6. : Focus_on_Cost Poor_management_of_risks_and_costs Excessive_maintenance_costs
7. : Focus_on_Cost Poor_management_of_risks_and_costs Vision_but_no_Plan
8. : Inaccurate_Schedule Insufficient_Architecture Vision_but_no_Plan
9. : Insufficient_Architecture Design_Flail Unstable_architecture
These SNA measures can describe each layer of a semantic social network very accurately. However, similarity can only be quantified using specific measures that are presented in the following section.
4.5.1 Similarity at the concept level
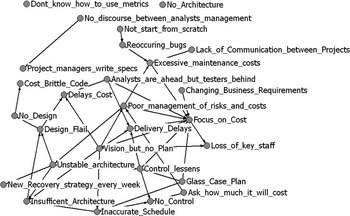
Using UCINET, similarity at the concept level can be measured as the similarity of concepts based on their relations to other concepts. UCINET not only offers a selection of similarity measures, but also offers tools that are commonly used for visualizing similarity (Hanneman & Riddle, Reference Hanneman and Riddle2005). These tools (i.e. Multi-dimensional scaling and hierarchical cluster analysis) can be used to visualize the patterns of similarity and dissimilarity/distance among actors. Therefore, using UCINET software project managers can easily create a social network of antipattern concepts and use this data to calculate similarity at the concept level. Figure 4 illustrates the antipattern ontology concept network information. By looking at the social network, a software project manager can make observations regarding concepts that appear structurally similar in that they seem to have reciprocal ties with each other and almost everyone else (Hanneman & Riddle, Reference Hanneman and Riddle2005). However, a more precise approach that asseses equivalence requires the use of SNA similarity measures.
A bipartite graph showing antipattern ontology concepts as nodes

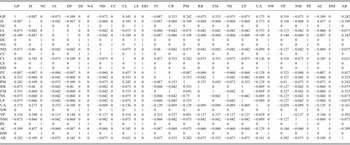
Pearson’s correlation coefficient can provide information about the strength and direction of an association, rather than the simple presence or absence thereof. Pearson correlations can be used in binary data to summarize pairwise structural equivalence because the statistic is widely used in social statistics. The range of this measure is from −1.00 to +1.00 (Hanneman & Riddle, Reference Hanneman and Riddle2005). The −1.00 value indicates that two concepts have exactly the opposite ties to each other. Zero indicates that knowing one concept’s tie to a third party does not help at all in guessing what the other concept’s tie to the third party might be. Finally, the value +1.00 shows that the two concepts always have exactly the same tie to other actors, which indicates perfect structural equivalence. In this paper, correlations were calculated using UCINET. Table 8 illustrates the results of applying this algorithm at the concept level network.
Pearson’s correlation coefficient similarity results

GP = Glass_Case_Plan; IS = Inaccurate_Schedule; NC = No_Control; IA = Insufficient_Architecture; DF = Design_Flail; DC = Delays_Cost; NA = No_Architecture; ND = No_Design; CC = Cost_Brittle_Code; CL = Control_lessens; LS = Loss_of_key_staff; DD = Delivery_Delays; FC = Focus_on_Cost; CR = Changing_Business_Requirements; PM = Poor_management_of_risks_and_costs; RB = Reoccuring_bugs; EM = Excessive_maintenance_costs; NS = Not_start_from_scratch; LP = Lack_of_Communication_between_Projects; UA = Unstable_architecture; NW = New_Recovery_strategy_every_week; VP = Vision_but_no_Plan; NM = No_discourse_between_analysts_management; PS = Project_managers_write_specs; AC = Ask_how_much_it_will_cost; DM = Dont_know_how_to_use_metrics; AB = Analysts_are_ahead_but_testers_behind.
Hanneman and Riddle (Reference Hanneman and Riddle2005) proposed that it is useful to examine node similarities to try to locate groupings of actors who are similar. By examining the results, interesting observations can be made regarding the patterns of ties between concepts. For example, out of the 27 concepts (see Table 8), five concepts (‘No Control’, ‘Delays Cost’, ‘No Architecture’, ‘Loss of key staff’ and ‘Cost Brittle Code’) have identical patterns of ties. Furthermore, there is a moderate tendency for concept ‘No Design’ to have ties to concepts that the group of five identical patterns do not, and vice versa.
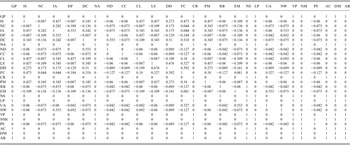
Pearson’s correlation coefficient identified the group of five similar concepts by providing information regarding the patterns of ties of concepts in the network. However, the existence of a relatively high number of zero values (Table 8) indicates that the results obtained by this measure cannot be used on their own in order to determine concept similarity. Furthermore, this measure cannot measure the similarity of two tie profiles (Hanneman & Riddle, Reference Hanneman and Riddle2005). This can be measured by counting the number of times that actor A’s tie to alter is the same as actor B’s tie to alter, and express this as a percentage of the possible total (Hanneman & Riddle, Reference Hanneman and Riddle2005). Table 9 illustrates the results of applying this algorithm at the concept level network. Using matches, software project managers can identify similarity in a way that is easy to interpret.
Proportion of matches—results for the columns (information receiving) relation of the concepts

GP = Glass_Case_Plan; IS = Inaccurate_Schedule; NC = No_Control; IA = Insufficient_Architecture; DF = Design_Flail; DC = Delays_Cost; NA = No_Architecture; ND = No_Design; CC = Cost_Brittle_Code; CL = Control_lessens; LS = Loss_of_key_staff; DD = Delivery_Delays; FC = Focus_on_Cost; CR = Changing_Business_Requirements; PM = Poor_management_of_risks_and_costs; RB = Reoccuring_bugs; EM = Excessive_maintenance_costs; NS = Not_start_from_scratch; LP = Lack_of_Communication_between_Projects; UA = Unstable_architecture; NW = New_Recovery_strategy_every_week; VP = Vision_but_no_Plan; NM = No_discourse_between_analysts_management; PS = Project_managers_write_specs; AC = Ask_how_much_it_will_cost; DM = Dont_know_how_to_use_metrics; AB = Analysts_are_ahead_but_testers_behind.
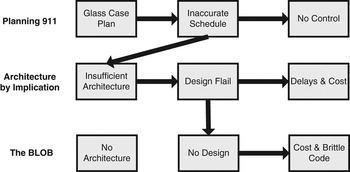
For example, the value 0.457 that appears in the cell ‘Inaccurate Schedule’ and ‘Insufficient Architecture’ indicates that, in comparing these two concepts to each other, they have the same tie (present or absent) to other concepts 45.7% of the time. According to Hanneman and Riddle (Reference Hanneman and Riddle2005), this measure is particularly useful with multi-category nominal measures of ties and it also provides efficient scaling for binary data, which are used in this paper. By examining the group of five concepts that indicated identical patterns of ties using Pearson’s correlation coefficient, the concept ‘No Architecture’ appears to be connected to other ties in quite fewer cases, therefore it can be discarded from the identified group of similar nodes. The dissimilarity of the ‘No Architecture’ node can be verified from the original dataset (Figure 5).
Example of dataset used for social network analysis, illustrating relationships between antipatterns through their concepts (McCormick, Reference McCormick1999)

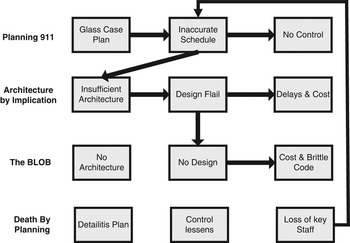
By examining the proportion of matches for each of the five concepts (‘No Control’, ‘Delays Cost’, ‘No Architecture’, ‘Loss of key staff’, ‘Cost Brittle Code’), (See Table 9) the highest proportion of matches indicate how two concepts are linked at the ontology level. For example, the similarity of the ‘Loss of key staff’ concept and ‘Inaccurate Schedule’ concept can be propagated at the ontology level by observing the highest proportion of matches. In this case, the result is 0.457, which implies that ‘Loss of key staff’ can be linked with ‘Inaccurate Schedule’ because they have the same tie to other concepts 45.7% of the time. Figure 6 illustrates the new link between the identified similar concepts. This indicates that ‘Death by Planning’ and ‘Planning 911’ antipatterns (Brown et al., Reference Brown, Malveau, “Skip” McCormick and Mowbray1998) are similar at the ontology level.
Relating similar antipattern ontology concepts in light of social network analysis similarity results

The following section describes how BNs can be used to address the uncertainty of the data collection process and augment the SNA results.
5 Using Bayesian networks in the antipattern ontology
5.1 Bayesian networks
Bayesian networks are causal networks that consist of a set of variables and a set of directed links between variables and provide the means to structure a situation for reasoning under certainty (Jensen, Reference Jensen2001). Each variable has a finite set of mutually exclusive states. Furthermore, to each variable A with influencing variables (parents) B 1,……, Bn, the potential table Pr(A|B 1,……, Bn) is attached. These directed network graphs represent causal relations between different events. The directions of the graph indicate the direction of the impact. Causal networks can be used to follow how a change of certainty in one variable may change the certainty for other variables. Formally, the relation between the two nodes is based on Bayes’ rule (Equation (3)).
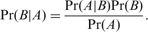
Furthermore, BNs are able to reflect dynamic changes in a software system by means of Bayesian belief updating, which can be carried out automatically by software tools. To use BNs, one should first specify prior belief values for network variables. Ideally, prior belief values are determined by collecting empirical, statistical data. However, Bayesian belief values can also be elicited from a domain expert who subjectively assesses them. Subsequent changes to belief values in the network are caused by new evidence, through Bayesian updating. There are numerous commercial tools that enable users to build BN models and run the program calculations. For the purposes of the BN models, that is, for their graphical representations and various probability calculations, the Genie 2.0Footnote 5 software tool was employed.
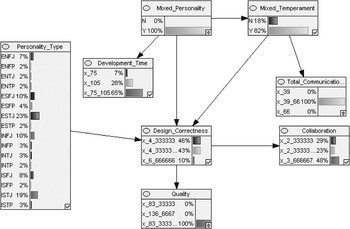
Bayesian Networks have been proposed as an appropriate formalism that can be used to model software project management antipatterns (Settas et al., Reference Settas, Bibi, Sfetsos, Stamelos and Gerogiannis2006). Bayesian modeling is particularly useful and well suited to the domain of antipatterns by providing a solid graphical representation of the probabilistic relationships among the set of antipattern variables. This formalism can serve as the underlying reasoning engine to support software project management antipatterns and to develop a precise mathematical model that can be used by software project managers to illustrate the effects of uncertainty on a software project management antipattern. The proposed antipattern BN model can be used in situations where there is scarce statistical data. As a result, project managers can use their expert judgment to model an antipattern. This formalism provided a framework for software project managers, who would like to model the cause–effect relationships that underlie an antipattern, taking into account the inherent uncertainty of a software project. As a result, software project managers can explore the effects of applying the refactored solution of an antipattern on resolving the uncertainty of a software project. Figure 7 is an example of a software project management BN model illustrating cause and effect relationships between BN nodes that are populated using probability values from an experiment (Settas et al., Reference Settas, Bibi, Sfetsos, Stamelos and Gerogiannis2006).
Example of a software project management antipattern Bayesian network model (Settas et al., Reference Settas, Bibi, Sfetsos, Stamelos and Gerogiannis2006)

5.2 Handling ontology uncertainty using Bayesian networks
One of the most widely used standards that have emerged for Web ontologies is OWL (Taniar & Rahayu, Reference Taniar and Rahayu2006). However, the current definition of OWL does not take uncertainty of knowledge into account (Pan et al., 2005; Taniar & Rahayu, Reference Taniar and Rahayu2006). It has been proposed that in cases where OWL is inefficient in capturing uncertainty, special means should be used (Taniar & Rahayu, Reference Taniar and Rahayu2006). BayesOWL (Pan. emph et al., 2005) is a framework which extends and supplements OWL for representing and reasoning with uncertainty based on BNs. This framework (Pan. emph et al., 2005) provided a set of rules and procedures that directly translate an OWL ontology into a BN structure. Additionally, it provided a method that utilizes available probability constraints about classes and interclass relations in constructing the conditional probability tables (CPTs) of the BN.
With the introduction of antipatterns to the Semantic Web, BNs were used in the antipattern ontology in order to quantify ontology uncertainty (Settas & Stamelos, Reference Settas and Stamelos2007a). By including the BN model of an antipattern in the antipattern ontology, each antipattern is associated with at least one corresponding BN model. The antipattern ontology addresses the relationship between the concepts of antipatterns, antipattern BN models and the OWL ontology that corresponds to an antipattern BN model. This relationship indicates that an antipattern can be modelled with one or more BN models. However, each specific antipattern BN model only corresponds to a single OWL ontology.
Besides the power of probabilistic reasoning provided by BN itself, BNs are used in the antipattern ontology because of the structural similarity between the DAG (directed acyclic graph) of a BN and the Resource Description Framework graph of OWL ontology: both of them are directed graphs, and direct correspondence exists between many nodes and arcs in the two graphs (Ding et al., Reference Ding, Peng and Pan2004). According to Pan et al. (Reference Pan, Ding, Yu and Peng2005), a set of rules and procedures can be used for direct translation of an OWL ontology into a BN structure (DAG). The same set of rules can be used to translate an antipattern BN model directly into a corresponding OWL ontology (Settas & Stamelos, Reference Settas and Stamelos2007a). The general principle underlying the structural translation rules is that all nodes in BN are translated to OWL classes (Pan et al., Reference Pan, Ding, Yu and Peng2005). The arrows represent the influence relation. In case the BN model nodes do not specifically define data types, they are not implemented.
5.3 Utilizing Bayesian networks to enhance social network analysis results
Applying SNA on antipattern ontologies can be restrictive for a number of reasons. SNA assumes a well-formed social network, but collecting data on antipatterns contains many sources of uncertainty and may not ensure that the resulting social network is complete and contains the needed data. SNA algorithms can accurately compute various measures for a specific node (i.e. degree centrality). However, these algorithms do not take uncertainty or any other meta-information (i.e. the certainty of the link) into account (Koelle et al., Reference Koelle, Pfautz, Farry, Cox, Catto and Campolongo2006). SNA focuses primarily on the existence of a relationship between nodes in the network, but not on attributes of that relationship or the nodes in the relationship. Furthermore, SNA does not explicitly consider the uncertainty of attributes on those nodes or relationships. Knowledge of these sources of uncertainty, paired with the creation of analysis techniques that can utilize this uncertainty information, will improve the validity of SNA results (Koelle et al., Reference Koelle, Pfautz, Farry, Cox, Catto and Campolongo2006).
Following Koelle’s framework (2006), two types of analysis are carried out using Bayesian belief networks: augmenting social network algorithms with uncertainty, and searching the network for nodes. Antipattern ontologies or ontology concepts are referred as nodes in the following BN models. The term nodes is used because the semantic social network includes different layers of networks that can refer to both ontology and ontology concepts. BNs are applicable to all layers of this model; hence software project managers can use BNs with regards to both ontology and ontology concepts.
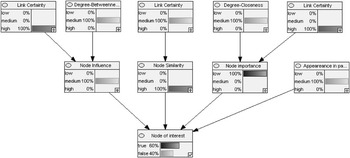
First of all, SNA algorithms can be augmented by considering meta-information in their calculations. Any resulting SNA data can be used as BN parent nodes in a BN model in order to assist software project managers in decision-making and answering questions regarding specific nodes of the social network. Furthermore, a BN model can also address the uncertainty of the data used for this calculation, taking into account the uncertainty inherent in data collection. For example, a software project manager might be interested in determining the ‘influence’ of each node in the social network. Figure 8 illustrates the BN model for ‘influence’ node, which contains one parent node that represents the degree of betweenness using the resulting SNA data and a parent node that contains the certainty of the data used for the calculation.
Example of augmenting social network analysis using a Bayesian network model

The ‘influence’ node can be either populated with values using empirical data (i.e. data regarding the influence of a concept from past software projects) and/or expert judgment. Thus, BNs can still be used in the case of missing statistical data. By setting evidence to the parent nodes and by updating the belief values of the network using BN software tools, software project managers can investigate the effects of setting evidence to one or both of the parent nodes, in the influence of a specific node in the network. Therefore, using such a framework, a software project manager can decide what action to take in order to decrease the influence of a node (i.e. use a more certain link). In light of this new knowledge regarding a specific node, software project managers can make the desired changes to a node or neighbouring nodes in the social network using software tools. SNA metrics can then be applied again in order to gather new data and reapply them to the BN model, if necessary, to view their effects on the node of interest.
Bayesian networks can also be used to search a social network, taking into account attributes and relationships that are associated with a degree of uncertainty (i.e. in data collection) and cannot be answered using a simple search (Koelle et al., Reference Koelle, Pfautz, Farry, Cox, Catto and Campolongo2006). Figure 9 illustrates an example of applying a BN model in order to search for a node of interest. This BN model can be applied to all nodes in the social network and takes into account SNA results regarding betweenness, closeness and similarity. The uncertainty of data collection is addressed using the link certainty BN nodes. Furthermore, a software project manager can combine attributes and relationships that cannot be provided by searching a social network. For example, the BN node ‘Appearance in past projects’ takes into account information regarding the occurrence of this node in past software projects. The BN model functions in the same way with the previous example (See Figure 8). By setting evidence to BN nodes and by updating the belief values of the network using BN software tools, software project managers can investigate the effects of this evidence in the influence of the BN node ‘Node of interest’. After the BN model has been applied to all nodes of the social network, the results can be sorted in order to find the antipatterns or antipattern concepts (i.e. symptoms) that have the highest values for potential to be interesting, which indicates the need of an antipattern to be addressed during a software project.
Example of searching social network nodes of interest using a Bayesian Network model

6 Conclusion
In this paper, the potential of applying tools and techniques already developed in the field of SNA research was examined in order to identify similar software project management antipattern ontologies. Relying on these instruments, a structured method for assisting software project managers was set up by extracting similarity from the ontology concept network to the ontology network based on the three layered semantic social network model. This approach requires data collection regarding documented relationships between antipatterns and antipattern concepts. This data can then be used to visualize antipattern ontologies in a meaningful way. SNA measures can then be applied in order to reach to useful conclusions regarding antipatterns (i.e. find important antipattern ontologies).
However, collecting data on antipattern ontology concepts contains many sources of uncertainty and may not ensure that the resulting social network is complete and contains needed data. Applying Bayesian Belief Networks to SNA quantified this uncertainty and provided new capabilities to the proposed framework.
For further research of the proposed framework, SNA can be applied in order to define the software project management antipattern community, find the best peer for proposing consensus (i.e. centrality on the social network) (Jung & Euzenat, Reference Jung and Euzenat2007) or the antipattern ontologies that could lead to collaboration between software project managers (i.e. centrality on the ontology layer). The social network layer can then be analyzed using SNA measures in order to relate software project managers who have contributed antipattern ontologies on the basis of common interest on antipatterns. Ultimately, this will motivate the use of antipattern ontologies in software project management.