
1. Introduction
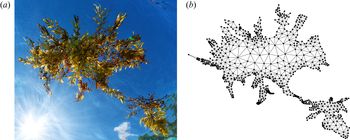
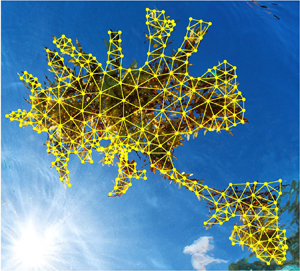
This paper is motivated by a desire to understand the mechanism that leads rafts of pelagic Sargassum – a genus of large brown seaweed (a type of alga) – to choke coastal waters and land on, most notably, the Caribbean Sea and beaches, a phenomenon that has been on the rise and is challenging scientists, coastal resource managers and administrators at local and regional levels (Langin Reference Langin2018). A raft of pelagic Sargassum is composed of flexible stems which are kept afloat by means of bladders filled with gas while it drifts under the action of ocean currents and winds (figure 1a). A mathematical model is here conceived for this physical depiction of a drifting Sargassum raft as an elastic network of buoyant, finite-size or inertial particles that evolve according to a novel motion law (Beron-Vera, Olascoaga & Miron Reference Beron-Vera, Olascoaga and Miron2019b), which has been recently shown capable of reproducing field (Olascoaga et al. Reference Olascoaga, Beron-Vera, Miron, Triñanes, Putman, Lumpkin and Goni2020) and laboratory (Miron et al. Reference Miron, Medina, Olascaoaga and Beron-Vera2020) observations. The motion law derives from the Maxey–Riley equation (Maxey & Riley Reference Maxey and Riley1983), a classical mechanics Newton's second law that constitutes the de jure fluid mechanics framework for investigating inertial dynamics (Michaelides Reference Michaelides1997). The inability of inertial particles to adapt their velocities to the carrying fluid flow leads to a dynamics that can be quite unlike that of fluid or Lagrangian (i.e. neutrally buoyant, infinitesimally small) particles (Cartwright et al. Reference Cartwright, Feudel, Károlyi, de Moura, Piro, Tél and Thiel2010). While largely overlooked in ‘particle tracking’ in oceanography, particularly Sargassum raft tracking (Putman et al. Reference Putman, Goni, Gramer, Hu, Johns, Trinanes and Wang2018; Johns et al. Reference Johns, Lumpkin, Putman, Smith, Muller-Karger, Rueda-Roa, Hu, Wang, Brooks and Gramer2020), this holds true for neutrally buoyant particles, irrespective of how small they are (Babiano et al. Reference Babiano, Cartwright, Piro and Provenzale2000; Sapsis & Haller Reference Sapsis and Haller2010). The Maxey–Riley theory for inertial particle dynamics in the ocean (Beron-Vera et al. Reference Beron-Vera, Olascoaga and Miron2019b; Miron et al. Reference Miron, Medina, Olascaoaga and Beron-Vera2020; Olascoaga et al. Reference Olascoaga, Beron-Vera, Miron, Triñanes, Putman, Lumpkin and Goni2020) accounts for the combined effects of ocean currents and winds on the motion of floating finite-size particles. Elastic interaction among such particles unveils, as we show here, a mechanism for long-range transport that may be at the core of connectivity of Sargassum between accumulation regions in the Caribbean Sea and surroundings and possibly quite remote blooming areas in the tropical North Atlantic from the coast of Africa (Ody et al. Reference Ody, Thibaut, Berline, Changeux, Andre, Chevalier, Blanfune, Blanchot, Ruitton and Stiger-Pouvreau2019) to the Amazon River mouth (Gower, Young & King Reference Gower, Young and King2013), along what has been dubbed (Wang et al. Reference Wang, Hu, Barnes, Mitchum, Lapointe and Montoya2019) the ‘Great Sargassum belt’.
(a) Floating raft of Sargassum. Credit: A. M. Brin, Blue Glass Photography. (b) Elastic network of finite-size, buoyant particles providing a minimal representation for the raft on the left.

2. The model
To construct the mathematical model, we consider a (possibly irregular) network of  $N > 1$ spherical particles (beads) connected by (massless, non-bendable) springs. The particles are assumed to have small radius, denoted by
 $a$, and to be characterized by a water-to-particle density ratio
 $\delta \ge 1$ finite, so
 $1 - \delta ^{-1}$ approximates well (Olascoaga et al. Reference Olascoaga, Beron-Vera, Miron, Triñanes, Putman, Lumpkin and Goni2020) reserve volume assuming that the air-to-particle density ratio is very small. The elastic force (per unit mass) exerted on particle
 $i$, with two-dimensional Cartesian position
 $x_i = (x^1_i,x^2_i)$, by neighbouring particles at positions
 $\{x_j : j\in \textrm {neighbour}(i)\}$, is assumed to obey Hooke's law (cf. e.g. Goldstein Reference Goldstein1981)
 \begin{equation} F_i = - \sum_{j\in \textrm{neighbour}(i)} k_{ij}(|x_{ij}| - \ell_{ij})\frac{x_{ij}}{|x_{ij}|},\end{equation}
for  $i = 1,\ldots ,N$, where
 \begin{equation} x_{ij} := x_i - x_j. \end{equation}
Here,  $k_{ij} \ge 0$ is the stiffness (per unit mass) of the spring connecting particle
 $i$ with neighbouring particle
 $j$ and
 $\ell _{ij} \ge 0$ is the length of the latter at rest. Elastic network models are commonly employed to represent biological macromolecules in the study of dynamics and function of proteins (Bahar, Atilgan & Erman Reference Bahar, Atilgan and Erman1997). Elastic chain models, a particular form of elastic network models, are used to represent polymers (Bird et al. Reference Bird, Curtiss, Armstrong and Hassager1977). A relevant recent application (Picardo et al. Reference Picardo, Vincenzi, Pal and Ray2018) is the investigation of preferential sampling of inertial chains in turbulent flow.
According to the Maxey–Riley theory for inertial ocean motion (Beron-Vera et al. Reference Beron-Vera, Olascoaga and Miron2019b; Olascoaga et al. Reference Olascoaga, Beron-Vera, Miron, Triñanes, Putman, Lumpkin and Goni2020), a particle of the elastic network, when taken in isolation, evolves according to the following second-order ordinary differential equation (appendix A)
 \begin{equation} \ddot x + \left(\,f + \frac{1}{3}R\omega \right)\dot x^\perp + \tau^{-1} \dot x = R\frac{{\operatorname{D}\!{v}}}{{\operatorname{D}\!{t}}} + R \left(\,f + \frac{1}{3}\omega \right)v^\perp + \tau^{-1}u, \end{equation}
where
 \begin{equation} u := (1-\alpha)v + \alpha v_{a}, \end{equation}
and  $\perp$ represents a
 $+\frac {1}{2}\pi$ rotation. Time-and/or-position-dependent quantities in (2.3) and (2.4) are: the (horizontal) velocity of the water,
 $v$, with
 $({{\operatorname {D}\!{}}}/{{\operatorname {D}\!{t}}})v = \partial _t v + (\boldsymbol {\nabla } v)v$ where
 $\boldsymbol {\nabla }$ is the gradient operator in
 $\mathbb {R}^2$; the water's vorticity,
 $\omega$; the air velocity,
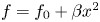
 $v_{a}$; and the Coriolis ‘parameter’,
 $f = f_0 + \beta x^2$, where
 $f_0 = 2\varOmega \sin \vartheta _0$ and
 $\beta = 2a_\odot ^{-1}\varOmega \cos \vartheta _0$ with
 $\varOmega$ and
 $a_\odot$ being Earth's angular velocity magnitude and mean radius, respectively, and
 $\vartheta _0$ being reference latitude. Quantities independent of position and time in (2.3) and (2.4) in turn are
 \begin{gather} R(\delta) : = \frac{1 - \frac{1}{2}\varPhi(\delta)}{1 - \frac{1}{6}\varPhi(\delta)} \in [0,1); \end{gather}
 \begin{gather}\tau(\delta) := \frac{1-\frac{1}{6}\varPhi(\delta)}{\left(1 + (1 - \gamma)\varPsi(\delta)\right)\delta^4} \frac{a^2\rho}{3\mu} > 0, \end{gather}
which measures the inertial response time of the medium to the particle ( $\rho$ is the assumed constant water density and
 $\mu$ the water dynamic viscosity); and
 \begin{equation} \alpha(\delta) := \frac{\gamma\varPsi(\delta)}{1 + (1 - \gamma)\varPsi(\delta)} \in [0,1), \end{equation}
which makes the convex combination (2.4) a weighted average of water and air velocities ( $\gamma \approx 1/60$ is the air-to-water viscosity ratio). Here
 \begin{equation} \varPhi(\delta) := \frac{\mathrm{i}\sqrt{3}}{2} (\varphi(\delta)^{-1} - \varphi(\delta)) - \frac{1}{2}(\varphi(\delta)^{-1} + \varphi(\delta)) + 1 \in [0,2), \end{equation}
is the fraction of emerged particle piece's height, where
 \begin{equation} \varphi(\delta) := \sqrt[3]{\mathrm{i}\sqrt{1 - (2\delta^{-1} - 1)^2} + 2\delta^{-1} - 1}, \end{equation}
and
 \begin{equation} \varPsi(\delta) := \pi^{-1}\cos^{-1}(1 - \varPhi(\delta)) - \pi^{-1}(1 - \varPhi(\delta)) {\sqrt{1 - (1 - \varPhi(\delta))^2}} \in [0,1), \end{equation}
which gives the fraction of emerged particle's projected (in the flow direction) area. The Sargassum raft drift model is obtained by adding the elastic force (2.1) to the right-hand side of the Maxey–Riley set (2.3). The result is a set of  $N$ second-order ordinary differential equations, coupled by the elastic term, viz.,
 \begin{equation} \ddot x_i + \left(f \Big \vert_i + \frac{1}{3}R\omega \Big \vert_i\right)\dot x_i^\perp +
\tau^{-1} \dot x_i = R\frac{{\operatorname{D}\!{ v\vert_i}}}{{\operatorname{D}\!{t}}} + R\left( f \Big \vert_i + \frac{1}{3}\,\omega \Big \vert_i\right) v\vert_i^\perp + \tau^{-1} u\vert_i + F_i, \end{equation}
for  $i = 1,\ldots ,N$, where
 $\vert _i$ means pertaining to particle
 $i$.
Now, as the radius ( $a$) of the elastically interacting particles is small by assumption, the inertial response time (
 $\tau \propto a^2$) is short. We write, then,
 $\tau = O(\varepsilon )$ where
 $0< \varepsilon \ll 1$ is a parameter that we use to measure smallness throughout this paper. In this case
 $\varepsilon$ can be interpreted as a Stokes number (Cartwright et al. Reference Cartwright, Feudel, Károlyi, de Moura, Piro, Tél and Thiel2010). That
 $\tau = O(\varepsilon )$ has an important consequence: (2.11) represents a singular perturbation problem involving slow,
 $x_i$, and fast,
 $v_i = \dot x_i$, variables. This readily follows by rewriting (2.11) as a system of first-order ordinary differential equations in
 $(x_i,v_i)$, i.e. a non-autonomous four-dimensional dynamical system, which reveals that while
 $x_i$ changes at
 $O(1)$ speed,
 $v_i$ does it at
 $O(\varepsilon ^{-1})$ speed. The geometric singular perturbation theory (Fenichel Reference Fenichel1979; Jones Reference Jones1995) extended to non-autonomous systems (Haller & Sapsis Reference Haller and Sapsis2008) was applied by Beron-Vera et al. (Reference Beron-Vera, Olascoaga and Miron2019b) to (2.3) to frame its slow manifold, to wit, a
 $(2+1)$-dimensional subset
 $\{(x,v_{p},t) : v_{p} = u(x,t) + u_\tau (x,t) + O(\varepsilon ^2)\}$ of the
 $(4+1)$-dimensional phase space
 $(x, v_{p}, t)$ where
 \begin{equation} u_\tau = \tau\left(R\frac{{\operatorname{D}\!{v}}}{{\operatorname{D}\!{t}}} + R \left(\,f + \frac{1}{3}\omega\right) v^\perp - \frac{{\operatorname{D}\!{u}}}{{\operatorname{D}\!{t}}} - \left(\,f + \frac{1}{3}R\omega\right) u^\perp\right), \end{equation}
with  ${{\operatorname {D}\!u\!{}}}/{{\operatorname {D}\!{t}}} = \partial _t u + (\boldsymbol {\nabla } u)u$, which normally attracts all solutions of (2.3) exponentially in time. On the slow manifold, (2.3) reduces to a first-order ordinary differential equation in
 $x$ given by
 $\dot x = v_{p} = u + u_\tau + O(\varepsilon ^2)$, which represents a non-autonomous two-dimensional dynamical system. Mathematically more tractable than the full set (2.3), this reduced set facilitated the uncovering of aspects of the inertial ocean dynamics such as the occurrence of great garbage patches in the ocean's subtropical gyres (Beron-Vera, Olascoaga & Lumpkin Reference Beron-Vera, Olascoaga and Lumpkin2016; Beron-Vera et al. Reference Beron-Vera, Olascoaga and Miron2019b) and the potential role of mesoscale eddies (vortices) as flotsam traps (Beron-Vera et al. Reference Beron-Vera, Olascoaga, Haller, Farazmand, Triñanes and Wang2015; Haller et al. Reference Haller, Hadjighasem, Farazmand and Huhn2016; Beron-Vera et al. Reference Beron-Vera, Olascoaga and Miron2019b). Because the elastic force (2.1) does not depend on velocity, the geometric singular perturbation analysis of (2.3) by Beron-Vera et al. (Reference Beron-Vera, Olascoaga and Miron2019b) applies to (2.11) with the only difference that the equations on the slow manifold are coupled by the elastic force (2.1), namely,
 \begin{equation} \dot x_i = v_i = u\vert_i + u_\tau\vert_i + \tau F_i + O(\varepsilon^2), \end{equation}
for  $i = 1,\ldots , N$. The slow manifold of (2.11) is the
 $(2N + 1)$-dimensional subset
 $\{(x_i,v_i,t) : v_i \!=\! u(x_i,t) \!+\! u_\tau (x_i,t) \!+\! \tau F_i(x_i; x_j:j\!\in\! \textrm {neighbour}(i)) \!+\! O(\varepsilon ^2), $
 $\,i \!=\! 1, \ldots , N\}$ of the
 $(4N + 1)$-dimensional phase space
 $(x_i,v_i,t), i = 1, \ldots , N$.
3. Behaviour near mesoscale eddies
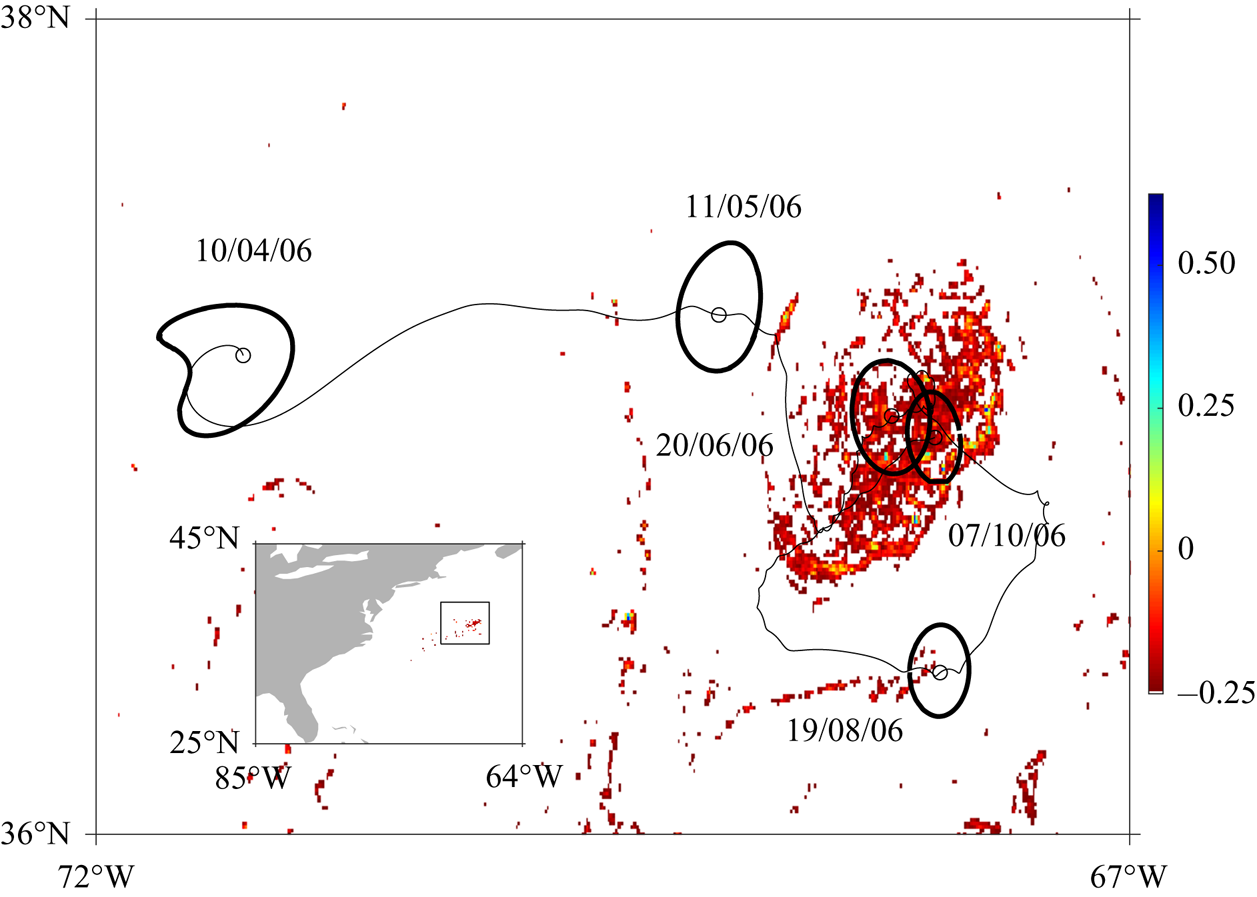
Having settled on a Maxey–Riley equation for Sargassum raft drift, we turn to evaluate its ability to represent reality. This evaluation is not meant to be exhaustive; such a type of evaluation is left for a future publication. With this in mind, we consider an actual observation of Sargassum, in the North-western Atlantic (figure 2). This figure more precisely shows, on the first week of October 2006, the satellite-derived maximum Chlorophyll index (MCI) at the ocean surface. Floating Sargassum corresponds to MCI values exceeding  $-0.25$ mW m
 $^{-2}$ sr
 $^{-1}$ nm
 $^{-1}$ (Gower, King & Goncalves Reference Gower, King and Goncalves2008; Gower et al. Reference Gower, Young and King2013). Note the spiralled shape of the high-MCI distribution filling a compact region. Overlaid on the MCI distribution are snapshots of the evolution of a coherent material vortex/eddy, as extracted from satellite altimetry measurements of sea surface height, widely used to investigate mesoscale (50–200 km) variability in the ocean (Fu et al. Reference Fu, Chelton, Le Traon and Morrow2010). Shown in heavy black is the boundary of the vortex; the (small) open circle and thin black curve indicate its centre and trajectory described, respectively. Below, we will give precise definitions for all these objects. What is important to realize at this point is that, being material, the boundary of such a vortex, which can be identified with the core of a cold Gulf Stream ring (vortex) (Talley et al. Reference Talley, Pickard, Emery and Swift2011), cannot be traversed by water. Yet it may be bypassed by inertial particles, whose motion is not tied (Haller & Sapsis Reference Haller and Sapsis2008; Beron-Vera et al. Reference Beron-Vera, Olascoaga, Haller, Farazmand, Triñanes and Wang2015) to Lagrangian coherent structures (Haller & Yuan Reference Haller and Yuan2000; Haller Reference Haller2016). However, this is not enough to explain the collection of Sargassum inside the ring. In fact, this ring is cyclonic (a water particle along the boundary circulates in the local Earth rotation's sense, which is anticlockwise in the northern hemisphere), and inertial particles tend to collect inside anticyclonic vortices while avoiding cyclonic vortices, as was formally shown by Beron-Vera et al. (Reference Beron-Vera, Olascoaga and Miron2019b) in agreement with a similar observed tendency of plastic debris in the North Atlantic subtropical gyre (Brach et al. Reference Brach, Deixonne, Bernard, Durand, Desjean, Perez, van Sebille and ter Halle2018). The relevant question is whether elastic interaction alters this paradigm.
Floating Sargassum distribution inferred from satellite spectrometry on the first week of October 2006 in the region of the North-western Atlantic indicated in the inset map. Sargassum corresponds to MCI values exceeding  $-0.25$ mW m
 $^{-2}$ sr
 $^{-1}$ nm
 $^{-1}$. MCI is inferred from the Medium Resolution Imaging Spectrometer (MERIS) aboard Envisat. Overlaid in heavy black are snapshots of the evolution of the boundary of a coherent material vortex revealed by satellite altimetry data. The small open circle represents the centre of the vortex and the black curve the corresponding trajectory.

We begin by addressing this question via direct numerical experimentation. This is done by integrating (2.3) for an elastic network of inertial particles centred at a point on the boundary of the coherent material vortex on 10 April 2006. The water velocity  $v$ is inferred using altimetry, following standard practice (e.g. Beron-Vera, Olascoaga & Goni Reference Beron-Vera, Olascoaga and Goni2008). In turn, the air velocity (
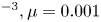
 $v_{a}$) is obtained from reanalysis (Dee et al. Reference Dee, Uppala, Simmons, Berrisford, Poli, Kobayashi, Andrae, Balmaseda, Balsamo and Bauer2011). While these velocities provide an admittedly imperfect representation of the carrying flow, they are data based and hence enable a comparison with observed behaviour. Parameters characterizing the carrying fluid system are set to mean values, namely,
 $\rho = 1025$ kg m
 $^{-3}, \rho _{a} = 1.2$ kg m
 $^{-3}, \mu = 0.001$ kg m
 $^{-1}$ s
 $^{-1}$ and
 $\mu _{a} = 1.8 \times 10^{-5}$ kg m
 $^{-1}$ s
 $^{-1}$. The initial network is chosen to be a square of 12.5 km side (it could be chosen irregular, if desired, as that one obtained from Delaunay triangulation of polygonal regions spanning the area covered by the Sargassum raft in figure 7). The network's springs are of equal length at rest,
 $\ell _{ij} = 0.5$ m. The beads, totalling
 $n = 625$, have a common radius
 $a = 0.1$ m. The buoyancies of the beads are all taken to be the same and equal to
 $\delta = 1.25$, which has been found appropriate for Sargassum (Olascoaga et al. Reference Olascoaga, Beron-Vera, Miron, Triñanes, Putman, Lumpkin and Goni2020). The resulting inertial parameters are
 $\alpha = 5.9\times 10^{-3}, R = 0.6$ and
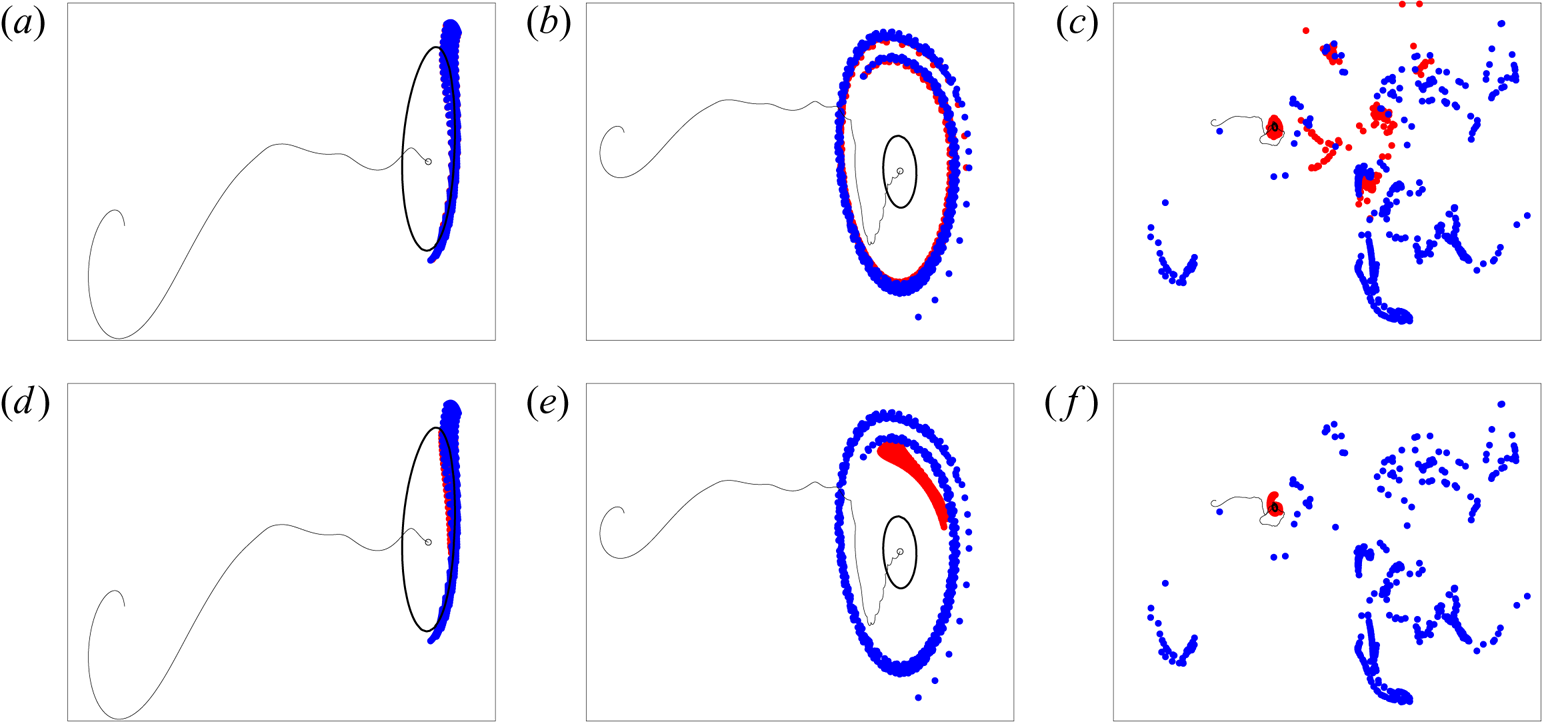
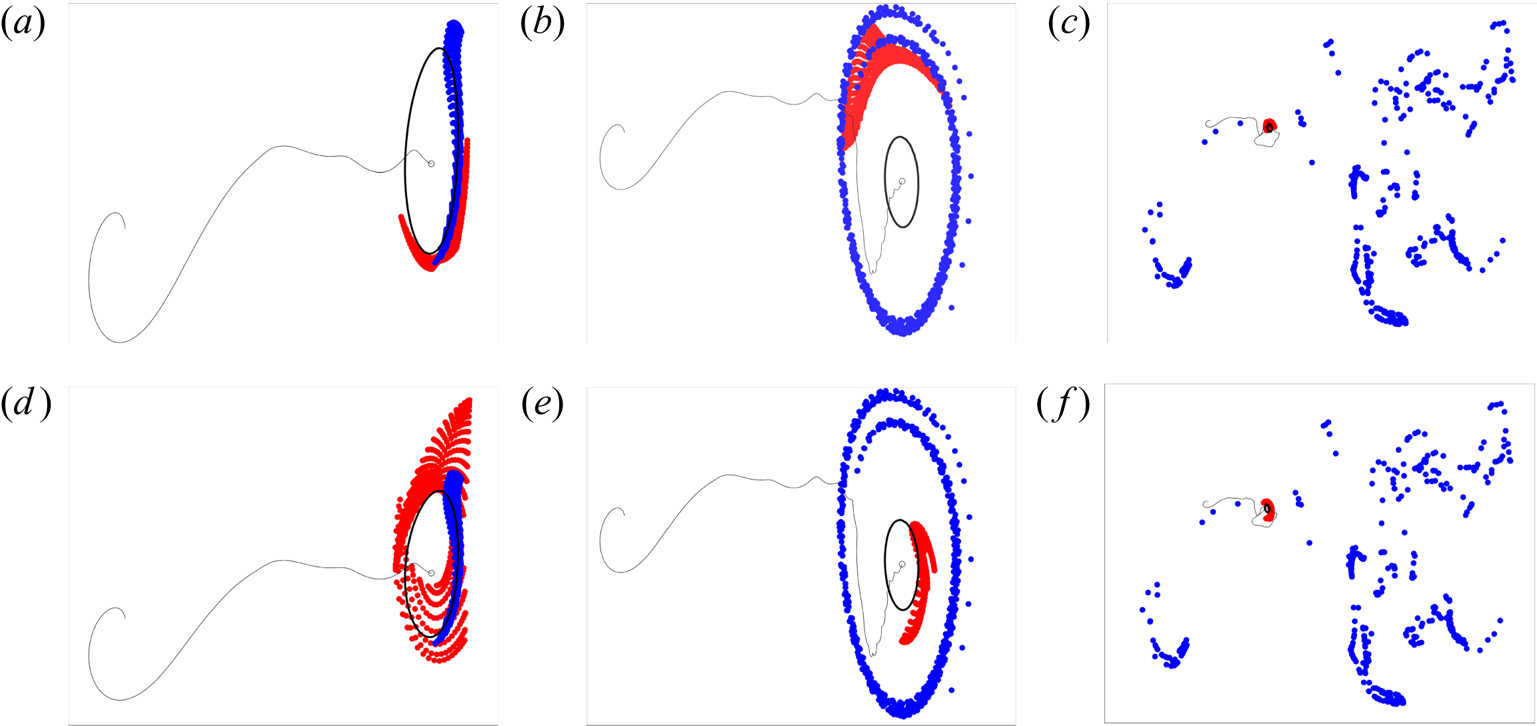
 $\tau = 4.1\times 10^{-2}$ d. Shown in red in figure 3 are snapshots (on 11 May 2006, 20 June 2006 and 7 October 2006) of the evolution of the network for two different stiffness values,
 $k_{ij} = 4.25$ d
 $^{-2}$ (a–c) and
 $k_{ij} = 425$ d
 $^{-2}$ (d–f). For reference, inertial particles, unconstrained by elastic forces, i.e. with motion obeying (2.3) or (2.11) with
 $F_i = 0$, are shown in blue, and the boundary and trajectory of the centre of the coherent material vortex are shown in black. The inertial particles, consistent with Beron-Vera et al.'s (Reference Beron-Vera, Hadjighasem, Xia, Olascoaga and Haller2019b) prediction, are repelled away from the vortex. By contrast, the elastic network of inertial particles remains close to it when
 $k_{ij} = 4.25$ d
 $^{-2}$ or, much more consistent with the observed Sargassum distribution in figure 2, collect inside the vortex when
 $k_{ij} = 425$ d
 $^{-2}$. In figure 4 we show the results of the same numerical experiments when the sense of the planet's rotation is artificially changed, mimicking conditions in the southern hemisphere. This is achieved by multiplying the Coriolis parameter (
 $\,f$) by
 $-1$. The effect of this alteration first is a change in the polarity of the vortex from cyclonic to anticyclonic. The second, more important, effect is that the inertial particles of the network, irrespective of whether they elastically interact or not, are attracted into the vortex. Next we show how analytic treatment of the reduced Maxey–Riley set (2.13) sheds light on the numerically inferred behaviour just described.
Snapshots of the evolution of elastic networks of inertial particles (red) initially lying on the boundary of the coherent material vortex of figure 2. From left to right are positions 30, 60 and 180 d after initialization on 10 April 2006. The stiffness of the network in the panels (a–c) is smaller than that in the panels (d–f). Blue dots, shown for reference, correspond to inertial particles which do not interact elastically. Overlaid in all panels are the boundary of the vortex (heavy black), centre (small open circle) and corresponding trajectory (black curve).

As in figure 3, but with the sign of the Coriolis parameter ( $\,f$) artificially set negative.

4. A formal result
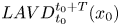
With the above goal in mind, we first make the coherent material vortex notion precise. This is done by considering the Lagrangian-averaged vorticity deviation, or LAVD, field (Haller et al. Reference Haller, Hadjighasem, Farazmand and Huhn2016)
 \begin{equation} \textit{LAVD}_{t_0}^t(x_0) := \int_{t_0}^t |\omega(F_{t_0}^{t'}(x_0),t'),t') - \bar{\omega}(t')|\,{{\textrm{d}}{t'}}, \end{equation}
where
 \begin{equation} \bar{\omega}(t) = \frac{1}{{area} U(t)}\int_{U(t)} \omega(x,t)\,\mathrm{d}^2x, \end{equation}
which is an average of the vorticity over a region of water  $U(t) = F_{t_0}^tU(t_0)$. Here,
 $F_{t_0}^t$ is the flow map that takes water particle positions
 $x_0$ at time
 $t_0$ to positions
 $x$ at time
 $t$. As defined by Haller et al. (Reference Haller, Hadjighasem, Farazmand and Huhn2016), a rotationally coherent vortex over
 $t \in [t_0, t_0 + T]$, an evolving material (water) region
 $V(t)\subset U(t), t \in [t_0, t_0 + T]$, such that its time-
 $t_0$ position is enclosed by the outermost, sufficiently convex isoline of
 ${LAVD}_{t_0}^{t_0+T}(x_0)$ around a local (non-degenerate) maximum (respectively, minimum), for
 $T > 0$ (respectively,
 $T < 0$). (To be more precise, a region
 $V(t)$ may contain several local extrema (Beron-Vera et al. Reference Beron-Vera, Hadjighasem, Xia, Olascoaga and Haller2019a), but we conveniently exclude from consideration such situations here to enable a straightforward definition of vortex centre Haller et al. Reference Haller, Hadjighasem, Farazmand and Huhn2016.) As a consequence, the elements of the boundaries of such material regions
 $V(t)$ complete the same total material rotation relative to the mean material rotation of the whole water mass in the domain
 $U(t)$ that contains them. This property of the boundaries tends (Haller et al. Reference Haller, Hadjighasem, Farazmand and Huhn2016) to restrict their filamentation to be mainly tangential under advection from
 $t_0$ to
 $t_0 + T$. Furthermore, the ensuing water-holding property of rotationally coherent eddies and related elliptic Lagrangian coherent structures (Haller & Beron-Vera Reference Haller and Beron-Vera2013, Reference Haller and Beron-Vera2014; Farazmand & Haller Reference Farazmand and Haller2016; Haller, Karrasch & Kogelbauer Reference Haller, Karrasch and Kogelbauer2018), verified numerically extensively (Haller et al. Reference Haller, Hadjighasem, Farazmand and Huhn2016; Beron-Vera et al. Reference Beron-Vera, Hadjighasem, Xia, Olascoaga and Haller2019a) and observed in controlled laboratory experiments (Tel et al. Reference Tel, Kadi, Janosi and Vincze2018; Tel, Vincze & Janosi Reference Tel, Vincze and Janosi2020) and field surveys involving in situ (buoy trajectories) and remote (satellite-inferred chlorophyll distributions) measurements (Beron-Vera et al. Reference Beron-Vera, Olascaoaga, Wang, Triñanes and Pérez-Brunius2018), can be so enduring (Wang, Olascoaga & Beron-Vera Reference Wang, Olascoaga and Beron-Vera2015, Reference Wang, Olascoaga and Beron-Vera2016) for the water-holding property to provide a very effective long-range transport mechanism in the ocean consistent with traditional oceanographic expectation (Gordon Reference Gordon1986). The material vortex in figure 2 (and also 3 and 4) is of the rotationally coherent class just described. It was obtained by applying LAVD analysis on
 $t_0 =$ 7 October 2006, a day of the week when the Sargassum raft observation in figure 2 was acquired, using
 $T = -180$ d. This turned out to be the longest backward-time integration from which a closed LAVD isoline with a stringent convexity deficiency of
 $10^{-3}$ was possible to find. It represents a rather long backward-time integration, which dates the ‘genesis’ of the rotationally coherent vortex around
 $t_0 + T =$ 10 April 2006. Figure 2 not only shows the vortex boundary on detection date (
 $t_0$), but also several advected images of it under the backward-time flow out to
 $t_0 + T$.
The second step in reaching the goal above is to assume that set (2.13), which attracts all solutions of (2.11), can be approximated by
 \begin{equation} \dot x_i = v_i = gf_0^{-1}\boldsymbol{\nabla}^\perp\eta\vert_i + \tau (g(1-\alpha-R)\boldsymbol{\nabla}\eta\vert_i + F_i), \end{equation}
 $+O(\varepsilon ^2), i = 1,\ldots , N$, which is justified as follows. First, the near surface ocean flow is in quasigeostrophic balance (Pedlosky Reference Pedlosky1987), as can be expected for mesoscale ocean flow (Fu et al. Reference Fu, Chelton, Le Traon and Morrow2010). Interpreting
 $\varepsilon$ as a Rossby number (Pedlosky Reference Pedlosky1987), this means that
 $v = gf_0^{-1}\boldsymbol {\nabla }^\perp \eta + O(\varepsilon ^2)$, where
 $g$ is gravity and
 $\eta = O(\varepsilon )$ is sea surface height,
 $\partial _t = O(\varepsilon )$ and
 $f = f_0 + O(\varepsilon )$. Second, the elastic interaction does not alter the nature of the critical and slow manifolds, which is guaranteed by making
 $F_i = O(\varepsilon )$. Third,
 $\alpha = O(\varepsilon )$, at least, consistent with it being very small (a few per cent) over a large range of buoyancy (
 $\delta$) values; cf. figure 2 of Beron-Vera et al. (Reference Beron-Vera, Olascoaga and Miron2019b). Indeed, taking
 $\delta = 1.25$ (as was found appropriate by Olascoaga et al. (Reference Olascoaga, Beron-Vera, Miron, Triñanes, Putman, Lumpkin and Goni2020) for Sargassum), recall we estimated
 $\alpha \approx 5\times 10^{-3}$. This is actually quite small, and more consistent with
 $\alpha = O(\varepsilon ^3)$ for a Rossby number that typically characterizes mesoscale flow (
 $\varepsilon = 0.1$). Note that this makes
 $\alpha v_{a} = O(\varepsilon ^3)$ for an
 $O(1)$ near surface atmospheric flow. But this would not be consistent with the quasigeostrophic ocean flow assumption. So we require, fourth, that
 $v_{a} = O(\varepsilon ^2)$, at least, i.e. the wind field over the period of interest is sufficiently weak (calm).
Now, let  ${\boldsymbol x} := (x_1^1, \ldots , x_N^1, x_1^2, \ldots , x_N^2)$ and
 ${\boldsymbol v} := (v_1^1, \ldots , v_N^1, v_1^2, \ldots , v_N^2)$. Then write (4.3) as
 \begin{equation} \dot{\boldsymbol x} = {\boldsymbol v}({\boldsymbol x},t). \end{equation}
We denote by  ${\boldsymbol F}_{t_0}^t$ the corresponding flow map, namely,
 ${\boldsymbol F}_{t_0}^t({\boldsymbol x}_0) := {\boldsymbol x}(t; {\boldsymbol x}_0, t_0)$ where
 ${\boldsymbol x}_0 = {\boldsymbol x}(t_0)$. Following Haller et al. (Reference Haller, Hadjighasem, Farazmand and Huhn2016) closely, we invoke Liouville's theorem (e.g. Arnold Reference Arnold1989) and note that a trajectory
 ${{\boldsymbol F}_{t_0}^t}({\boldsymbol x}_0)$ is overall forward attracting over
 $t\in [t_0,t_0+T], T>0$ (resp.,
 $T<0$), if
 $\det {\operatorname {\boldsymbol D}\!{{\boldsymbol F}}}_{t_0}^{t_0+T} ({\boldsymbol x}_0) < 1$ (respectively,
 $\det {\operatorname {\boldsymbol D}\!{{\boldsymbol F}}}_{t_0}^{t_0+T}({\boldsymbol x}_0) > 1$). Let us suppose now that the time-
 $t_0$ position of the network of elastically connected inertial particles is very close to the centre of a rotationally coherent vortex, given by (Haller et al. Reference Haller, Hadjighasem, Farazmand and Huhn2016)
 \begin{equation} x_0^* = \textrm{arg max}_{x_0\in V(t_0)} {LAVD}_{t_0}^{t_0+T}(x_0), \end{equation}
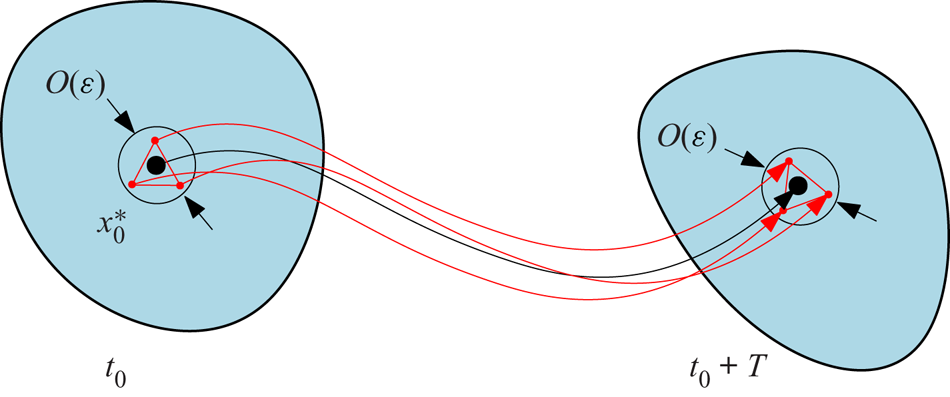
which is expected to exist in a well-defined fashion when the ocean flow is quasigeostrophic, as we have assumed here. We write the above formally as  $|x_i(t_0) - x_0^*| = O(\varepsilon ), i = 1,\ldots ,N$. Then, by smooth dependence of the solutions of (4.3) on parameters, for
 $t\in [t_0, t_0+T]$ finite, one has
 \begin{equation} x_i(t;x_i(t_0),t_0) = F_{t_0}^t(x_0^*) + O(\varepsilon), \end{equation}
for  $i = 1,\ldots ,N$, where
 $F_{t_0}^t$ is the flow map generated by the quasigeostrophic ocean velocity field
 $g\,f_0^{-1}\boldsymbol {\nabla }^\perp \eta$ (figure 5). With this in mind, we find (appendix B)
 \begin{equation} \det{\operatorname{\boldsymbol D}\!{{\boldsymbol F}}}_{t_0}^{t_0+T}({\boldsymbol x}_0) = \exp \tau(\mathcal{A}+\mathcal{B}), \end{equation}
 $+\, O(\varepsilon ^2)$, where
 \begin{equation} \mathcal{A} := gN(1 - \alpha -R){sign}_{t\in [t_0,t_0+T]}(T\nabla^2\eta(F_{t_0}^t(x_0^*),t)) \left\vert\int_{t_0}^{t_0+T} |\nabla^2\eta(F_{t_0}^t(x_0^*),t)|{{\textrm{d}}{t}}\right\vert, \end{equation}
and
 \begin{equation} \mathcal{B} : = -T\sum_{i=1}^N\sum_{j\in \textrm{neighbour}(i)}k_{ij}. \end{equation}
Noting that  $1-\alpha -R \ge 0$, it finally follows that
Theorem 4.1  $F_{t_0}^{t}(x_0^*)$ is locally forward attracting overall over
 $t\in [t_0,t_0+T]$:
(i) for all
 $k_{ij}$ when ${sign}_{t\in [t_0,t_0+T]}\nabla ^2\eta (F_{t_0}^t(x_0^*),t) < 0$; and
(ii) provided that
(4.10)when\begin{equation} |T|\sum_{i=1}^N\sum_{j\in \textrm{neighbour}(i)} k_{ij} > gN(1-\alpha-R) \left\vert\int_{t_0}^{t_0+T} |\nabla^2\eta(F_{t_0}^t(x_0^*),t)|\,{{\rm{d}}{t}}\right\vert, \end{equation}${sign}_{t\in [t_0,t_0+T]}\nabla ^2\eta (F_{t_0}^t(x_0^*),t) > 0$.




By smooth dependence of the solutions of (4.3) on parameters, an elastic network of inertial particles initially  $O(\varepsilon )$-close to the centre of
 $x_0^*$ of a rotationally coherent vortex will remain
 $O(\varepsilon )$-close to the trajectory flowing from it over a finite-time interval
 $[t_0, t_0+T]$.

Since  $\omega = g\,f_0^{-1}\nabla ^2\eta + O(\varepsilon ^2)$, the above result says that the centre of a cyclonic rotationally coherent quasigeostrophic eddy represents a finite-time attractor for elastic networks of inertial particles in the presence of calm winds if they are sufficiently stiff, while that of an anticyclonic eddy irrespective of stiffness. The minimal stiffness
 $k_{min}$ required for a cyclonic eddy centre to attract an elastic inertial network over finite time decreases with the network's size. This can be readily seen assuming that the stiffness is the same for all pairs of elastically connected particles, say,
 $k_{ij} = k$, and considering a square network with
 $N = n^2$ elements. In such a case one easily computes
 ${\sum _{i=1}^N\sum _{j\in \textrm {neighbour}(i)}} = 4n (n - 1)$ and thus
 $k_{min} = {({n}/{4(n - 1)})}(1-\alpha -R) |\,f_0T^{-1}{LAVD}_{t_0}^{t_0+T}(x_0^*)| + O(\varepsilon ^2)$, which decays to a value bounded away from 0 as
 $n\to \infty$. (In getting the last result we have relied on the fact that
 $U(t)$ in (4.2) can be taken as large as desired, e.g. area
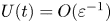 $U(t) = O(\varepsilon ^{-1})$ as we have specifically set.) Thus, as the size of the network increases, the condition on the stiffness is expected to be more easily satisfied. Similarly, this condition is easier to be fulfilled as the buoyancy of the particles approaches neutrality; indeed,
 $\lim _{\delta \to 1}k_{min} = 0$. Note, on the other hand, that
 $\lim _{n\to 1} k_{min} = \infty$. Thus, as expected, the result of Beron-Vera et al. (Reference Beron-Vera, Olascoaga and Miron2019b) for isolated inertial particles is recovered: while anticyclonic eddy centres attract finite-size particles floating at the ocean surface, cyclonic ones always repel them away. It is important to realize that statements on the existence of finite-time attractors inside rotationally coherent eddies do not say anything about basins of attraction. Yet the expectation, verified numerically above in qualitative agreement with remote-sensing data, is that mesoscale eddies will in general trap Sargassum rafts if they initially lie near their boundaries (the sensitivity analysis in appendix C provides further numerical support for this expectation).
5. Concluding remarks
The above formal result provides an explanation for the behaviour of the elastic network in figures 3 and 4. This encourages us to speculate that Sargassum rafts should behave similarly. Of course, there are additional (physical) processes in the ocean that may also play a role. For instance, downwelling associated with submesoscale (less than 10 km) motions can lead to surface convergence of flotsam. While such convergence has been recently observed (D'Asaro et al. Reference D'Asaro, Shcherbina, Klymak, Molemaker, Novelli, Guigand, Haza, Haus, Ryan and Jacobs2018), numerical simulations and theoretical arguments (McWilliams Reference McWilliams2016) suggest that this should happen at the periphery of submesoscale cyclonic vortices, where density contrast is large. Yet, consistent with this work, initial inspection of satellite images is revealing (J. Triñanes 2020, private communication) that Sargassum collection is not restricted to vortex peripheries and further that both cyclonic and anticyclonic eddies trap Sargassum.
We note too that pelagic Sargassum is reportedly (J. Sheinbaum 2020, private communication) observed to sometimes be found beneath the sea surface, which can be a result of downwellings and/or reductions of the buoyancy of the rafts as they absorb water or undergo physiological transformations. The effects of the latter can be incorporated into the minimal model of this paper, partially at least, by making  $\delta \ge 1$ a function of time, as it has been done previously (Tanga & Provenzale Reference Tanga and Provenzale1994) in the standard Maxey–Riley set. Full representation, beyond the scope at present, of possible three-dimensional aspects of the motion of Sargassum rafts will require one to consider the (vertical) buoyancy force along with a reliable representation of the three components of the ocean velocity field, coupled with an ecological model of Sargassum life cycle.
We close by noting that satellite-altimetry observations reveal a dominant tendency of mesoscale eddies of either polarity to propagate westward (Morrow, Birol & Griffin Reference Morrow, Birol and Griffin2004; Chelton, Schlax & Samelson Reference Chelton, Schlax and Samelson2011) consistent with theoretical argumentation (Nof Reference Nof1981; Cushman-Roisin, Chassignet & Tang Reference Cushman-Roisin, Chassignet and Tang1990; Graef Reference Graef1998; Ripa Reference Ripa2000). This observational evidence, along with the additional observational evidence on the long-range transport capacity of eddies (Wang et al. Reference Wang, Olascoaga and Beron-Vera2015, Reference Wang, Olascoaga and Beron-Vera2016; Beron-Vera et al. Reference Beron-Vera, Olascaoaga, Wang, Triñanes and Pérez-Brunius2018), makes the result of this paper a potentially very effective mechanism for the connectivity of Sargassum between the Caribbean Sea and remote regions in the tropical North Atlantic. Clearly, a comprehensive modelling effort is needed to verify this hypothesis. The are several parameters that will require specification, which may be obtained from a study of the architecture of Sargassum rafts or, alternatively, from observed evolution (as inferred from satellite imagery) via regression or learning (e.g. Aksamit, Sapsis & Haller Reference Aksamit, Sapsis and Haller2020).
Acknowledgements
The authors report no conflict of interest. The altimeter products are produced by SSALTO/DUCAS and distributed by AVISO with support from CNES (http://www.aviso.oceanobs). The ERA-Interim reanalysis is produced by ECMWF and is available from http://www.ecmwf.int. MERIS satellite images are provided by ESA through the G-Pod online platform (https://gpod.eo.esa.int).
Declaration of interests
The authors report no conflict of interest.
Appendix A. Review of the Maxey–Riley set (2.3)
The exact motion of inertial particles obeys the Navier–Stokes equation with moving boundaries as such particles are extended objects in the fluid with their own boundaries. This results in complicated partial differential equations which are hard to solve and analyse. Here, as well as in Beron-Vera et al. (Reference Beron-Vera, Olascoaga and Miron2019b), the interest is in the approximation, formulated in terms of an ordinary differential equation, provided by the Maxey–Riley equation (Maxey & Riley Reference Maxey and Riley1983), the de jure fluid mechanics paradigm for inertial particle dynamics.
Such an equation is a classical mechanics Newton's second law with several forcing terms that describe the motion of solid spherical particles immersed in the unsteady non-uniform flow of a homogeneous viscous fluid. Normalized by particle mass,  $m_{p} = \frac {4}{3}\pi a^3\rho _{p}$, the relevant forcing terms for the horizontal motion of a sufficiently small particle, excluding so-called Faxen corrections and the Basset–Boussinesq history or memory term, are: (i) the flow force exerted on the particle by the undisturbed fluid,
 \begin{equation} F_{flow} = \frac{m_{f}}{m_{p}}\frac{{\operatorname{D}\!{v_{f}}}}{{\operatorname{D}\!{t}}} , \end{equation}
where  $m_{f} = \frac {4}{3}\pi a^3\rho _{f}$ is the mass of the displaced fluid (of density
 $\rho _{f}$), and
 ${{{\operatorname {D}\!{v_{f}}}}/{{\operatorname {D}\!{t}}}}$ is the material derivative of the fluid velocity (
 $v_{f}$) or its total derivative taken along the trajectory of a fluid particle,
 $x = X_{f}(t)$, i.e.
 ${{{\operatorname {D}\!{v_{f}}}}/{{\operatorname {D}\!{t}}}} = {[({{{\textrm {d}}{}}}/{{{\textrm {d}}{t}}})v_{f}(x,t)]_{x=X_{f}(t)}} = \partial _t v_{f} + (\boldsymbol {\nabla } v_{f}) v_{f}$; (ii) the added mass force resulting from part of the fluid moving with the particle,
 \begin{equation} F_{mass} = \frac{\frac{1}{2}m_{f}}{m_{p}}\left(\frac{{\operatorname{D}\!{v_{f}}}}{{\operatorname{D}\!{t}}} - \dot v_{p}\right) , \end{equation}
where  $\dot v_{p}$ is the acceleration of an inertial particle with trajectory
 $x = X_{p}(t)$, i.e.
 $\dot v_{p} = {({{{\textrm {d}}{}}}/{{{\textrm {d}}{t}}})[v_{p}(x,t)]_{x=X_{p}(t)}} = \partial _t v_{p}$ where
 $v_{p} = \partial _t X_{p} = \dot x$ is the inertial particle velocity; (iii) the lift force, which arises when the particle rotates as it moves in a (horizontally) sheared flow,
 \begin{equation} F_{lift} = \frac{\frac{1}{2}m_{f}}{m_{p}}\omega_{f} (v_{f} - v_{p})^\perp, \end{equation}
where  $\omega _{f} = \partial _1 v^2_{f} - \partial _2 v^1_{f}$ is the (vertical) vorticity of the fluid; and (iv) the drag force caused by the fluid viscosity,
 \begin{equation} F_{drag} = \frac{12\mu_{f} \dfrac{A_{f}}{\ell_{f}}}{m_{p}} (v_{f} - v_{p}), \end{equation}
where  $\mu _{f}$ is the dynamic viscosity of the fluid,
 $A_{f}$ (
 $=\pi a^2$) is the projected area of the particle and
 $\ell _{f}$ (
 $=2a$) is the characteristic projected length, which we have intentionally left unspecified for future appropriate evaluation.
The above forces are included in the original formulation by Maxey & Riley (Reference Maxey and Riley1983), except for the lift force (A 3), due to Auton (Reference Auton1987) and a form of the added mass term different than (A 2), which corresponds to the correction due to Auton, Hunt & Prud'homme (Reference Auton, Hunt and Prud'homme1988). The specific form of lift force (A 3) can be found in Montabone (Reference Montabone2002, Chapter 4) (cf. similar forms in Henderson, Gwynllyw & Barenghi Reference Henderson, Gwynllyw and Barenghi2007; Sapsis et al. Reference Sapsis, Ouellette, Gollub and Haller2011).
To derive (2.3), Beron-Vera et al. (Reference Beron-Vera, Olascoaga and Miron2019b) first accounted for the geophysical nature of the fluid by including the Coriolis force. (In an earlier geophysical adaptation of the Maxey–Riley equation (Provenzale Reference Provenzale1999), the centrifugal force was included as well, but this is actually balanced out by the gravitational force on the horizontal plane.) This amounts to replacing (A 1) and (A 2) with
 \begin{equation} F_{flow} = \frac{m_{f}}{m_{p}}\left(\frac{{\operatorname{D}\!{v_{f}}}}{{\operatorname{D}\!{t}}} + f v_{f}^\bot\right), \end{equation}
and
 \begin{equation} F_{mass} = \frac{\frac{1}{2}m_{f}}{m_{p}}\left(\frac{{\operatorname{D}\!{v_{f}}}}{{\operatorname{D}\!{t}}} + f v_{f}^\bot - \dot v_{p} - f v_{p}^\bot\right), \end{equation}
respectively.
Then, noting that fluid variables and parameters take different values when pertaining to seawater or air, e.g.
 \begin{equation} v_{f}(x,z,t) = \begin{cases} v_{a}(x,t) & \text{if } z \in (0,h_{a}], \\ v(x,t) & \text{if } z \in [-h,0), \end{cases} \end{equation}
Beron-Vera et al. (Reference Beron-Vera, Olascoaga and Miron2019b) wrote
 \begin{equation} \dot v_{p} + f v_{p}^\perp = \langle F_{flow}\rangle + \langle F_{mass}\rangle + \langle F_{lift}\rangle + \langle F_{drag}\rangle, \end{equation}
where  $\langle \,\rangle$ is an average over
 $z\in [-h,h_{a}]$. After some algebraic manipulation, (2.3) follows upon making
 $\ell = \ell _{a} = \delta ^{-3}h$, as suggested by observations (Olascoaga et al. Reference Olascoaga, Beron-Vera, Miron, Triñanes, Putman, Lumpkin and Goni2020), and assuming
 $\delta _{a} \ll 1$ with the static stability considerations in § IV.B of Olascoaga et al. (Reference Olascoaga, Beron-Vera, Miron, Triñanes, Putman, Lumpkin and Goni2020) in mind.
Appendix B. Derivation of equations (4.7)–(4.9)
We begin by decomposing the elastic force as  $F_i = A_i + B_i$, where
 \begin{equation} A_i := - \sum_{j\in \textrm{neighbour}(i)} k_{ij}x_{ij},\quad B_i := \sum_{j\in \textrm{neighbour}(i)} k_{ij}\ell _{ij}\frac{x_{ij}}{|x_{ij}|}. \end{equation}
Then we note
 \begin{equation} \boldsymbol{\nabla}_iA_i = -\sum_{j\in \textrm{neighbour}(i)}k_{ij}\boldsymbol{\nabla}_ix_{ij} = - \sum_{j\in \textrm{neighbour}(i)}k_{ij}\,\textrm{Id}^{2\times 2}, \end{equation}
and thus
 \begin{equation} \sum_{i=1}^N\textrm{trace}\boldsymbol{\nabla}_iA_i = -\sum_{i=1}^N\sum_{j\in \textrm{neighbour}(i)}k_{ij} \ \textrm{trace} \ \textrm{Id}^{2\times 2} = -2 \sum_{i=1}^N\sum_{j \in \textrm{neighbour}(i)}k_{ij}. \end{equation}
Now, let  $x,y\in \mathbb {R}^2$ and note
 \begin{align} \boldsymbol{\nabla}_x\frac{x-y}{|x-y|} & = \frac{\boldsymbol{\nabla}_xx}{|x-y|} - \frac{(x-y)2(x-y)^\top\boldsymbol{\nabla}_xx}{2|x-y|^3}\nonumber\\ &= \frac{\textrm{Id}^{2\times 2}}{|x-y|} - \frac{(x-y)(x-y)^\top\textrm{Id}^{2\times 2}}{|x-y|^3}\nonumber\\ &= \frac{\textrm{Id}^{2\times 2}}{|x-y|} - \frac{(x-y)(x-y)^\top}{|x-y|^3}. \end{align}
Consequently,
 \begin{align} \textrm{trace}\boldsymbol{\nabla}_x\frac{x-y}{|x-y|} &= \textrm{trace} \begin{pmatrix} \dfrac{1}{|x-y|} & 0\\ 0 & \dfrac{1}{|x-y|} \end{pmatrix}\nonumber\\ &\quad - \textrm{trace} \begin{pmatrix} \dfrac{(x_1-y_1)^2}{|x-y|^3} & \dfrac{(x_1-y_1)(x_2-y_2)}{|x-y|^3}\\ \dfrac{(x_2-y_2)(x_1-y_1)}{|x-y|^3} & \dfrac{(x_2-y_2)^2}{|x-y|^3} \end{pmatrix}\nonumber\\ &= \frac{2}{|x-y|} - \frac{|x-y|^2}{|x-y|^3}\nonumber\\ &= \frac{1}{|x-y|}. \end{align}
Using (B 4) we obtain
 \begin{align} \boldsymbol{\nabla}_iB_i &= -\sum_{j\in \textrm{neighbour}(i)} k_{ij}\ell_{ij}\left(-\frac{\boldsymbol{\nabla}_ix_{ij}}{|x_{ij}|} + \frac{x_{ij}x_{ij}^\top}{|x_{ij}|^3}\right)\nonumber\\ &= -\sum_{j\in \textrm{neighbour}(i)} k_{ij}\ell_{ij}\left(-\frac{\textrm{Id}^{2\times 2}}{|x_{ij}|} + \frac{x_{ij}x_{ij}^\top}{|x_{ij}|^3}\right), \end{align}
while using (B 5),
 \begin{align} \sum_{i=1}^N\textrm{trace}\boldsymbol{\nabla}_iB_i &= -\sum_{i=1}^N\sum_{j\in \textrm{neighbour}(i)} k_{ij}\ell_{ij} \,\textrm{trace} \left(-\frac{\textrm{Id}^{2\times 2}}{|x_{ij}|} + \frac{x_{ij}x_{ij}^\top}{|x_{ij}|^3}\right)\nonumber\\ &= -\sum_{i=1}^N\sum_{j\in \textrm{neighbour}(i)} k_{ij}\ell_{ij}\left(-\frac{2}{|x_{ij}|} + \frac{1}{|x_{ij}|}\right)\nonumber\\ &= \sum_{i=1}^N\sum_{j\in \textrm{neighbour}(i)} k_{ij}\frac{\ell_{ij}}{|x_{ij}|}. \end{align}
Combining (B 3) and (B 7) we obtain
 \begin{equation} \sum_{i=1}^N\textrm{trace}\boldsymbol{\nabla}_iF_i = \sum_{i=1}^N\sum_{j\in \textrm{neighbour}(i)} k_{ij} \left(\frac{\ell_{ij}}{|x_{ij}|} -2\right). \end{equation}
Now, taking into account (B 8), from (4.3) it follows that
 \begin{align} \textrm{trace}\boldsymbol{\nabla}{\boldsymbol v}({\boldsymbol F}_{t_0}^{t}({\boldsymbol x}_0),t) &= \sum_1^N\textrm{trace}\boldsymbol{\nabla}_i v_i(x_i(t;x_i(t_0),t_0),t)\nonumber\\ &= \tau R_\alpha g\sum_1^N\nabla^2\eta(x_i(t;x_i(t_0),t_0),t)\nonumber\\ &\quad + \tau\sum_{i=1}^N\sum_{j\in \textrm{neighbour}(i)} k_{ij} \left(\frac{\ell_{ij}}{|x_{ij}(t;x_{ij}(t_0),t_0)|} -2\right) + O(\varepsilon^2)\nonumber\\ &= \tau R_\alpha gN\nabla^2\eta(F_{t_0}^t(x_0^*),t) - \tau\sum_{i=1}^N\sum_{j\in \textrm{neighbour}(i)} k_{ij} + O(\varepsilon^2), \end{align}
where  $R_\alpha := 1-\alpha -R$. Here, we have had (4.6) in mind, and consistent with this have assumed
 $\ell _{ij} = O(\varepsilon )$, so
 $\ell _{ij}/|x_{ij}| \sim 1$ as
 $\varepsilon \to 0$. Result (4.7)–(4.9) follows upon noting that
 $\det {\operatorname {\boldsymbol D}\!{{\boldsymbol F}}}_{t_0}^{t}({\boldsymbol x}_0) = \int _{t_0}^{t}\textrm {trace}\boldsymbol {\nabla } {\boldsymbol v}({\boldsymbol F}_{t_0}^{t'}({\boldsymbol x}_0),t'){{\textrm {d}}{t'}}$, where
 $\boldsymbol {\nabla }$ is the gradient operator in
 $\mathbb {R}^{2N}$.
Appendix C. Sensitivity analysis
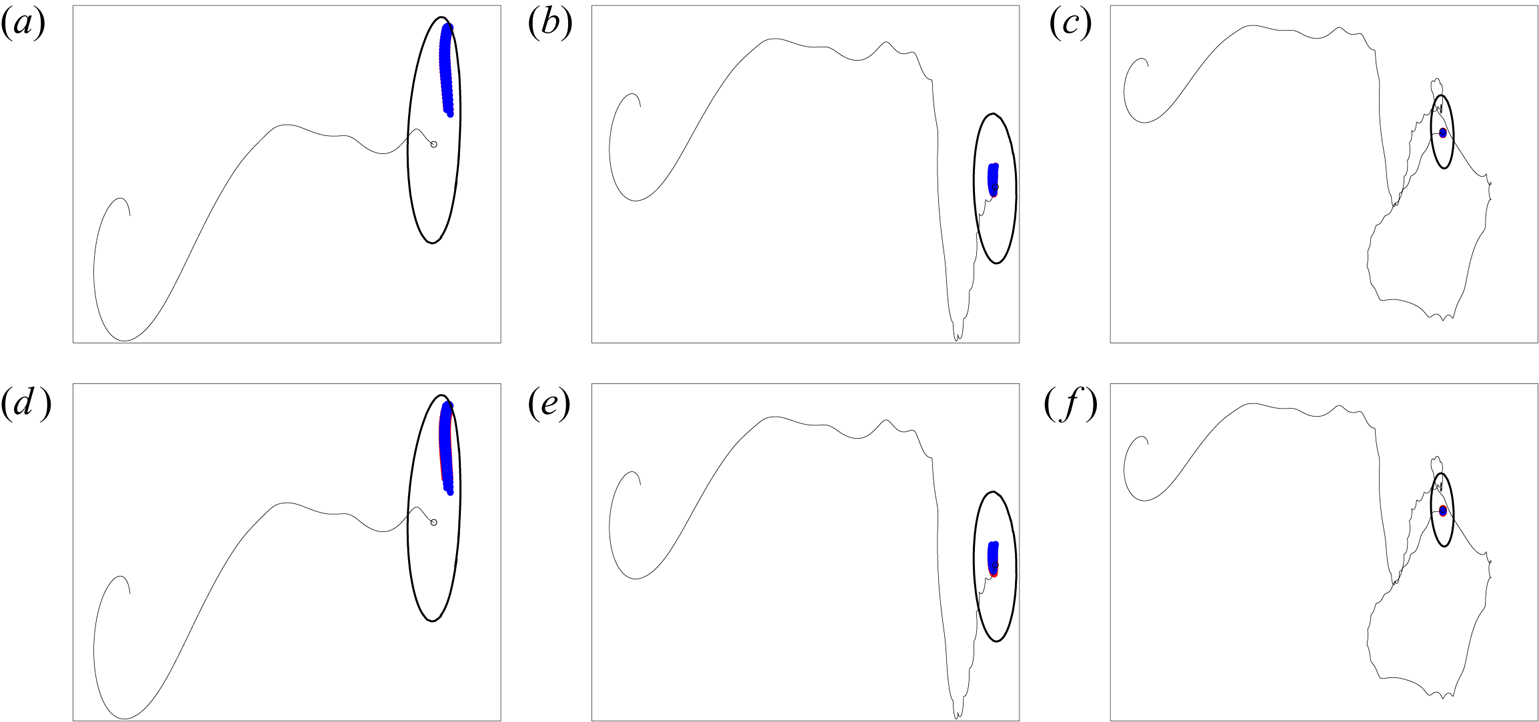
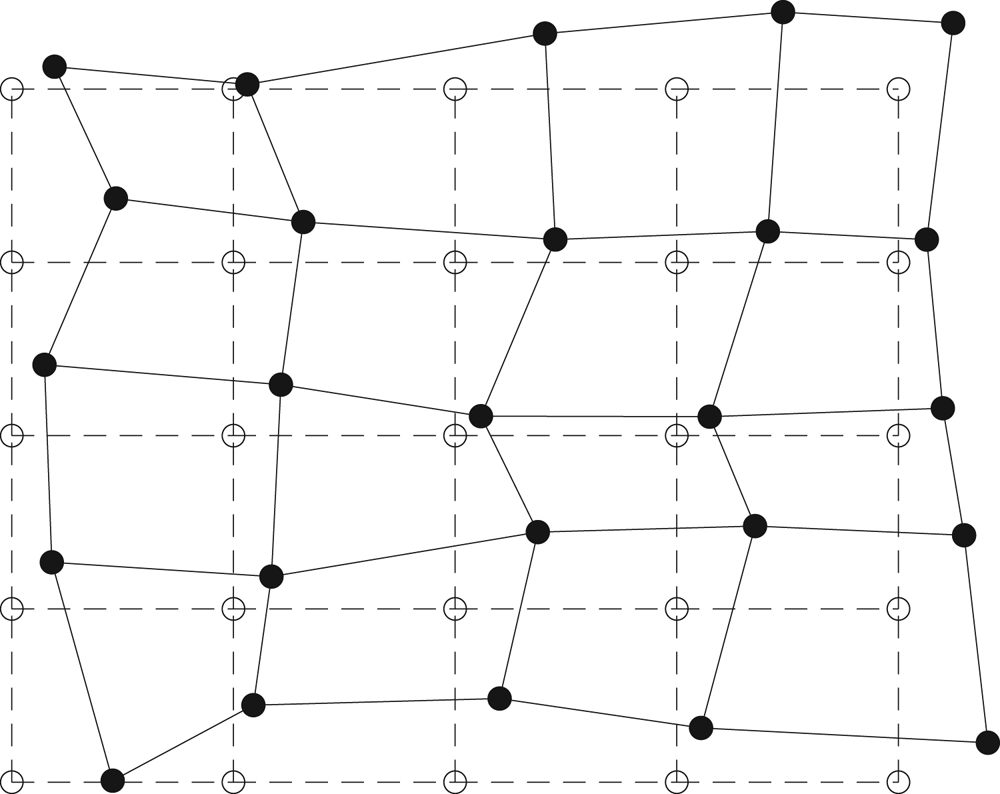
We provide further numerical support for the expectation that mesoscales eddies should in general trap Sargassum rafts through a sensitivity analysis with respect to the elastic network's initial position relative to the vortex and also the configuration of the initial network. This is given in figure 6, which uses the same parameters as in figure 3(d,e,f) except that initialization is made 25 (a–c) and 50 (d–f) km away from the boundary of the vortex. These distances correspond to approximately one and two times the mean radius of the vortex, respectively. The initial network's shape is irregular, obtained by applying a small random perturbation on the original square network's bead locations (figure 7). Note the influence of the vortex on the network.
As in the bottom panels of figure 3, except that the initialization of the elastic networks takes place away from the boundary of the vortex, at a distance equal to one (a–c) and two times as large as (d–f) the mean radius of the vortex ( $\sim$25 km) where the initial network's bead locations are a small random perturbation of the original locations forming a rectangular grid.