I. INTRODUCTION
A simplified model of graphene consists of a planar hexagonal array of carbon atoms (C). Its electronic band structure was first determined by Wallace in a 1947 study of graphite. Reference Wallace1 It was first isolated and studied in detail by Novoselov et al. in 2004. Reference Novoselov, Geim, Morozov, Jiang, Zhang, Dubonos, Grigorieva and Firsov2 Since then, it has been intensively studied, particularly for its potential value as a technological material. It has been found to have a number of extraordinary properties, including high electronic conductivity and enormous strength.
The ground state electronic structure of graphene consists of a filled hexagonal first Brillouin zone (BZI), with an energy gap that goes monotonically to zero at the zone corners, from a maximum at the centers of the zone edges. This electronic configuration arises from the particular relationship between the number of conduction (noncore) electrons per atom and the hexagonal atomic ordering.
A simple model of the noncore electrons in graphene has a two-dimensional Hamiltonian consisting of electron kinetic energy, electron–core (EC) interactions, and electron–electron (EE) interactions. Two extreme approximations from this formulation consist of the limiting cases: (i) where EE interactions are negligible compared to EC interactions and (ii) where EC are negligible compared to EE. Wallace’s treatment for the band structure falls within case (i). Case (ii) is representative of models for superconductivity (SC) and for charge density waves (CDWs). The theoretical basis for the latter was established by Fröhlich in 1954. Reference Fröhlich3
For the cases SC and CDW, a number of characteristics are required of the EE interactions. First, they involve pairwise interactions (at least). The problem of solving the Schrödinger equation then includes a self-consistency requirement among all the noncore electrons. Second, the EE is not representable in terms solely of pairwise Coulomb repulsions. One needs to include the effect of the phonon field of the crystal upon the noncore electrons, in simplest terms as an attractive pairwise contribution. Not only that, but also the combination of the Coulomb repulsion and phonon-mediated attraction needs to constitute a net attraction, at least for some portion of the phonon spectrum.
SC and CDWs have not been observed in pure, perfect single-sheet graphene, as far as we know. We feel that the CDW being introduced in this work will not be found there, given that the characteristic graphene band structure is correctly modeled by Wallace while neglecting electron–electron interactions. They have been induced, however, in impurity-doped or otherwise modified graphene systems. Reference Cartlidge4,Reference Rahnejat, Howard, Shuttleworth, Schofield, Iwaya, Hirijibehedin, Renner, Aeplli and Ellerby5 In this structural modification, the symmetry of graphene is broken by altering the atomic structure of the material. This broken symmetry is reflected in the CDW whose geometry alters the single electron states so that a gap is maintained throughout the periphery of the first Brillouin zone.
In the present work, the material is not graphene. The effect of its atomic structure on the noncore electrons has essentially been overwhelmed by the electron–electron interaction. The graphene-like properties come instead from the geometrical features of the electron–phonon interactions, as reflected in the resultant many-electron self-consistent field. We derive the conditions for this mimicking of graphene electronic structure to be complete, including zero gap at the corners of the fully occupied first BZ, a set of k-space points of measure zero.
Our purpose is to determine the material requirements for such a system. In terms of our simple model, there are three physical parameters that may be manipulated experimentally: the effective electron mass µ in a two-dimensional system, the dominant Fourier coefficient v K in the periodic CDW, and its wave number K. We also address the question whether the CDW state is a stable ground state, relative to an approximately uniform-density state. The work elucidates the conceptual and material considerations that arise in creating specific band structures by engineering CDWs.
The problem of investigating the possibility of creating a material of the sort represented by our model may be characterized as “physical/chemical aspects”. It exists along two tracks: the mathematical theory and the experimental process leading to a new class of materials. The present work is a first step along the mathematical theory track, based on the total energy algorithm
 $E\left( {\mu,{{\tilde v}_K},{\rho _0}} \right)$
; see Eqs. (5.16) and (5.15) with Eq. (4.12). This result is based on a highly simplified parametrization of the physical system. From at least one point of view, the mean electron density ρ0 is the least difficult to understand because if we are not primarily concerned with engineering the CDW length or number K, we simply accept the value given by the material and proceed with
 $E\left( {\mu,{{\tilde v}_K}} \right)$
. In the present work,
 $E\left( {\mu,{{\tilde v}_K}} \right)$
is optimized (minimized) with respect to a given value of μ, μ = 1.
There is a difficult path from a model of the system of electrons and atomic cores (or conceivably nuclei) to our model, in which the electron and core dynamical variables separate, in good approximation, so that the K(or ρ0) dependence of
 ${\tilde v_K}$
is determined. In fact, there is no general solution to this problem: it is highly material-dependent. However, better approximations than the present parametrization must be accessible and would improve on the accuracy of the present model.
The experimental process leading to a new class of materials is at least as complicated and difficult as the mathematical one. In general terms, it requires systematic variations of μ and
 ${\tilde v_K}$
to satisfy the theoretical criteria for stable CDWs in materials that by some reasonable judgment it might be deemed suitable. We are not, as theorists, able to give any leadership in such experimental topics. However, we note that in the past decade or more, vast progress has been made and is accelerating, in the fabrication of new materials that are not naturally occurring, but that meet specific physical and/or chemical requirements, in the full range of material types, from biological to the latest exotic two-dimensional systems, such as superconducting modifications of graphene.
The outline of the paper is as follows: In Sec. II, we specify the model that will be analyzed. In Sec. III, we give the method whereby specific results will be achieved through relatively simple calculation. In Sec. IV, the self-consistency condition (which arises whenever many-body interactions are included) is determined explicitly for our model and method, and its physical meaning is explored. In Sec. V, the total energy of the CDW system is evaluated in terms of the physical parameters µ, ρ0 and v K . In Sec. VI, the total energy is evaluated for the uniform-density state of the system, and in Sec. VII, the stability condition for the CDW state is displayed. In Sec. VIII, we summarize our results and present our conclusions.
II. MODEL: A CDW HAVING THE GRAPHENE ELECTRONIC STRUCTURE
We shall model a planar crystalline system with a number n of noncore conduction electrons in an area Ω. We shall assume that these electrons will form a CDW ground state that mimics the electronic band structure of graphene. In such a CDW state, the electronic density will have an array of minima and maxima whose positions mimic the carbon atomic core sites of graphene at the corner of hexagons and the interstitial sites at the hexagon centers.
A. Formulation
We begin with a two-dimensional crystal consisting of atomic cores (not necessarily carbon) and conduction electrons. This contains the implicit assumption that the problem is separable into planar (x, y) variables and a transverse variable z that is omitted. Consider the model Hamiltonian,
 $${H_n} = \left\{ {\sum\limits_{j = 1}^n {\left[ { - {{{\hbar ^2}} \over {2m}}\nabla _j^2 + \sum\limits_J {{v_{{\rm{core}}}}\left( {\left| {{{\vec R}_J} - {{\vec r}_j}} \right|} \right)} } \right]} + {1 \over 2}\sum\limits_{j,j'}^n {v\left( {\left| {{{\vec r}_j} - {{\vec r}_{j'}}} \right|} \right)} } \right\}\quad ,$$
where j = 1, 2, …, n are electrons whose two-dimensional position and spin variables are combined in
 ${\vec r_j}$
, J labels atomic cores, v
core is the electron-core interaction, and v, the effective electron–electron interaction, is taken to be pairwise and cylindrically symmetrical.
Now, the core terms
 $\hbox( {\sum\limits_J {} } \hbox)$
constitute the periodic potential of the crystal. If the conduction electrons are approximately like noninteracting electrons at the bottom of the first conduction band of the crystal, then the periodic potential may be replaced by an effective band mass m
b in place of the free-electron mass m. We express this in terms of a dimensionless parameter µ,
 $${m_{\rm{b}}} = \mu \cdot m\quad .$$
We can now rewrite the Hamiltonian H n in Bohr–Hartree atomic units,
 $${H_n} = \sum\limits_{j = 1}^n {\left[ { - {1 \over {2\mu }}\nabla _j^2 + {1 \over 2}\sum\limits_{j' = 1}^n {v\left( {{{\vec r}_j} - {{\vec r}_{j'}}} \right)} } \right]} \quad .$$
Units of length are now Bohr (a 0), and units of energy are Hartree (Hy), where
 $${a_0} = {{4\pi {\varepsilon _0} \cdot {\hbar ^2}} \over {m{e^2}}} = 0.529\;{\rm{A}},\quad 1\;{\rm{Hy}} = {{{\hbar ^2}} \over {ma_0^2}} = 27.2\;{\rm{eV}}\quad .$$
The pairwise interaction is now expressed in Hy units. Note especially that in Eq. (2.3), the periodic potential, if any, will arise from
 $v\left( {\vec r} \right)$
, expressing the CDW, not from the periodicity of the atomic ordering in the crystal, which is expressed by the band mass parameter µ.
The physics of our model system should include the phonons of the crystal and their energy, and the electron–phonon interaction and its energy. We assume that the electron–phonon interaction produces a modification of the electron–electron interaction and phonon–phonon interaction with the resultant effective electron and phonon dynamical variables becoming separable, the electron–phonon interaction having been subsumed into the new electronic and phononic parts of the system Hamiltonian. We can then analyze the electronic part, as in Eq. (2.1), and treat the phonon part as a fixed, constant part of the total energy. In this case, the effective pairwise electron–electron interaction,
 $v\left( {\vec r} \right)$
in Eq. (2.1), contains a phonon-mediated contribution, in addition to the Coulomb repulsion. While these postulates are not likely to be justifiable in general, the resultant model may mimic specific properties of some systems.
B. The total energy
It is our purpose, both in the system’s model and in the computation of its properties, especially its total energy, to use as simplified an approach as possible. The total energy E n from Eq. (2.3) is
 $${E_n} = \left\langle {{\Psi _n}\left| {{H_n}} \right|{\Psi _n}} \right\rangle \quad ,$$
where Ψ n is the ground state many-electron wave function and E n is its eigenvalue. For simplicity, consider the Hartree approximation, where
 $${\Psi _n}\left( {{{\vec r}_1},{{\vec r}_2}, \ldots ,{{\vec r}_n}} \right) = \prod\limits_{j = 1}^n {{\psi _j}\left( {{{\vec r}_j}} \right)} \quad ,$$
where
 ${\psi _j}\left( {{{\vec r}_j}} \right)$
is a set of n orthonormal single particle functions. If such a set has to minimize E
n
, it must satisfy the Hartree equation,
 $$h\left( {\vec r} \right) \cdot {\psi _j}\left( {\vec r} \right) = {\varepsilon _j} \cdot {\psi _j}\left( {\vec r} \right)\quad ,$$
where the Hartree operator h is
 $$h\left( {\vec r} \right) = - {1 \over {2\mu }}{\nabla ^2} + \sum\limits_{j' = 1}^n {\left\langle {j'\left| v \right|j'} \right\rangle } \quad ,$$
 $$\left\langle {j'\left| v \right|j'} \right\rangle = \int {{{\rm{d}}^2}r' \cdot \psi _{j'}^ * } \left( {\vec r'} \right) \cdot v\left( {\vec r - \vec r'} \right) \cdot {\psi _{j'}}\left( {\vec r'} \right)\quad .$$
From Eqs. (2.7) and (2.8), if we sum over j from j = 1 to j = n and compare the result that comes from Eqs. (2.3) and (2.6), we arrive at the well-known conclusion that the two-particle contribution to the energy is double counted in the Hartree equation. We shall therefore evaluate the total energy E n by summing over the n single-particle Hartree energies ε j and then subtracting half of the potential energies that are included in that sum,
 $${E_n} = \sum\limits_{j = 1}^n {{\varepsilon _j} - {1 \over 2}\sum\limits_{j,j' = 1}^n {\left\langle {j,j'\left| v \right|j,j'} \right\rangle } } \quad ,$$
see Eqs. (2.5)–(2.9).
C. Electron density
For our study of CDW, it is useful to include the electron density operator
 ${\rho _{{\rm{op}}}}\left( {\vec r} \right)$
in the formulation. Consider,
 $${\rho _{{\rm{op}}}}\left( {\vec r} \right) = \sum\limits_{j = 1}^n {\delta \left( {\vec r - {{\vec r}_j}} \right)} \quad .$$
We now introduce Ω as the Born-von Karman area of a system consisting of n electrons in N primitive unit cells of the Bravais lattice, subject to periodic boundary conditions. In terms of its Fourier analysis,
 ${\rho _{{\rm{op}}}}\left( {\vec r} \right)$
is
 $${\rho _{{\rm{op}}}}\left( {\vec r} \right) = \sum\limits_{\vec k} {{\rho _{\vec k}} \cdot \exp \left( {i\vec k \cdot \vec r} \right)} \quad ,$$
 $${\rho _{\vec k}} = {1 \over \Omega }\int {{{\rm{d}}^2}r' \cdot {\rho _{{\rm{op}}}}\left( {\vec r'} \right) \cdot \exp \left( { - i\vec k \cdot r'} \right)} = {1 \over \Omega }\sum\limits_{j = 1}^n {\exp \left( { - i\vec k \cdot {{\vec r}_j}} \right)} \quad .$$
D. The self-consistent field
The two-particle term in the Hartree Eq. (2.9) is called the self-consistent field, denoted scf. It is related to the electron density as follows. Consider the Fourier transform relation,
 $$v\left( {\vec r} \right) = \sum\limits_{\vec k} {{v_{\vec k}} \cdot \exp \left( {i\vec k \cdot \vec r} \right)} \quad ,$$
 $${v_{\vec k}} = {1 \over \Omega }\int {{{\rm{d}}^2}r' \cdot v\left( {\vec r'} \right) \cdot \exp \left( { - i\vec k \cdot \vec r} \right)} \quad .$$
Then in the scf, we have
 $${ \sum\limits_{j' = 1}^n {\left\langle {j'\left| {v\left( {\vec r - \vec r'} \right)} \right|j'} \right\rangle } = \sum\limits_{\vec k} {{v_{\vec k}} \cdot \exp \left( {i\vec k \cdot \vec r} \right)} \cdot \sum\limits_{j' = 1}^n {\int {{{\rm{d}}^2}r'{{\left| {{\psi _{j'}}\left( {\vec r'} \right)} \right|}^2} \cdot \exp \left( { - i\vec k \cdot \vec r'} \right)\quad .} } \cr}$$
Now in Eq. (2.16), the sum over j′ on the right-hand side is the expectation value of
 $\left( {\Omega \cdot {\rho _{\vec k}}} \right)$
, Eq. (2.13), in the many-body state Ψ, Eq. (2.6). Thus, if we denote
 $$\left\langle {\Psi \left| {{\rho _{\vec k}}} \right|\Psi } \right\rangle = \left\langle {{\rho _{\vec k}}} \right\rangle \quad ,$$
then the Hartree Eqs. (2.7) and (2.8) become
 $$\left[ { - {1 \over {2\mu }}{\nabla ^2} + \Omega \cdot \sum\limits_{\vec k} {{v_{\vec k}} \cdot \left\langle {{\rho _{\vec k}}} \right\rangle \cdot \exp \left( { - i\vec k \cdot \vec r} \right)} } \right]{\psi _j}\left( {\vec r} \right) = {\varepsilon _j} \cdot {\psi _j}\left( {\vec r} \right)\quad .$$
E. Graphene structure in a CDW
Graphene consists of a planar array of carbon atoms in a space filling set of open hexagons—see Fig. 1(a). The crystal basis consists of two nearest neighbor atoms at sites (1) and (2), for example, in Fig. 1(a), separated by the displacement vector
 ${\vec a_0}$
of magnitude a
0 [not to be confused with the Bohr radius a
0 in Eq. (2.4)]. The primitive translation vectors of the crystal lattice are
 ${\vec a_1}$
and
 ${\vec a_2}$
, where
 $${\vec a_1} = {a \over 2}\left( {\sqrt 3 \hat i + \hat j} \right),\;{\vec a_2} = {a \over 2}\left( {\sqrt 3 \hat i - \hat j} \right)$$
and where
 $$a = \left| {{{\vec a}_1}} \right| = \left| {{{\vec a}_2}} \right| = \sqrt 3 \cdot {a_0}\quad ,$$
and
 $\hat i$
and
 $\hat j$
are unit vectors in the x and y directions. The reciprocal lattice basis vectors are
 $${\vec b_1} = {{2\pi } \over a}\left( {{1 \over {\sqrt 3 }}\hat i + \hat j} \right),\;{\vec b_2} = {{2\pi } \over a}\left( {{1 \over {\sqrt 3 }}\hat i - \hat j} \right)\quad ,$$
with the defining property
 $$\left( {{{\vec b}_i} \cdot {{\vec a}_j}} \right) = 2\pi {\delta _{ij}},\;b = \left| {{{\vec b}_j}} \right| = {{4\pi } \over {3{a_0}}}\quad .$$
(a) Hexagonal unit of graphene crystal, with basis sites (1) and (2) and separation
 ${\vec a_0}$
, primitive translation vectors
 ${\vec a_1}$
and
 ${\vec a_2}$
, and x–y coordinate axes. (b) Hexagonal first Brillouin zone in the reciprocal lattice of the graphene crystal, with primitive translation vectors
 ${\vec b_1}$
and
 ${\vec b_2}$
, and k
x
− k
y
coordinates.

The reciprocal lattice hexagonal unit is shown in Fig. 1(b). Notice the (π/6) rotation between the hexagons in Figs. 1(a) and 1(b).
We now return to our Hartree Eq. (2.18). For a CDW, we require that the scf consists of a wave pattern that has the geometrical shape of the atomic core pattern of graphene, Fig. 1(a). We must keep in mind that our system, Eq. (2.18), contains no atomic cores. They have been subsumed into the effective electron mass parameter µ, Eq. (2.2). It will now be the phonon mediated part of
 ${v_{\vec k}}$
in Eq. (2.18) that enables the system to have an scf in the form of a CDW. This may occur if the scf is dominated by
 $\vec k$
values that reflect the electronic structure of graphene. Thus consider
 $$\vec k = \pm {\vec K_1},\; \pm {\vec K_2},\; \pm {\vec K_3}\quad ,$$
where
 $${\vec K_1} = {\vec b_1},\;{\vec K_2} = {\vec b_2},\;{\vec K_3} = \left( {{{\vec K}_1} + {{\vec K}_2}} \right) = \left( {{{\vec b}_1} + {{\vec b}_2}} \right)\quad .$$
Vectors
 ${\vec K_1}$
and
 ${\vec K_2}$
ensure that our scf has the correct translational properties, and
 ${\vec K_3}$
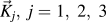
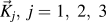
is required to reflect the two-atom basis of graphene. All three vectors
 ${\vec K_j},\;j = 1,\;2,\;3$
have the same magnitude K = b, where K determines the scale a
0 of the wave pattern, see Eq. (2.22).
The six wave vectors in Eq. (2.23) taken together give three cosines. Consider,
 $$F\left( {\vec r} \right) = \sum\limits_{j = 1}^3 {\cos \left( {{{\vec K}_j} \cdot \vec r} \right)} \quad .$$
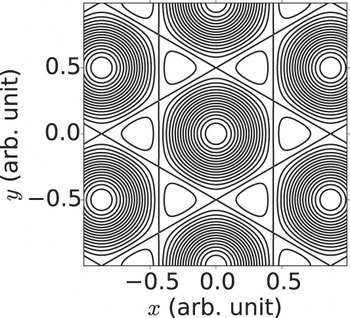
This wave pattern is shown as a contour map in Fig. 2. The large dark areas are centered on triangular mesh sites at wave pattern maxima. They tend toward hexagonal shape, representing each one’s relationship with six nearest neighbor minima. The latter is shown as light area, tending toward triangular shape, representing each one’s relationship with three nearest neighbor maxima. The minima correspond to atomic sites in graphene. The wave pattern therefore exactly reflects the potential seen by valence electrons in graphene.
Wave pattern, Eq. (2.25), of our two-dimensional CDW model with the graphene structure.

Now for our scf in Eq. (2.18) to behave like
 $F\left( {\vec r} \right)$
in Eq. (2.25), we require the coefficients
 $$\left( {{v_{\vec k}}.\left\langle {{\rho _{\vec k}}} \right\rangle } \right);\;\vec k = \pm {\vec K_j},\;j = 1,\;2,\;3$$
all to be equal. Since
 $v\left( {\vec r} \right)$
and
 $\rho \left( {\vec r} \right)$
are real, we see that
 $${v_{\vec k}} = {v_{ - \vec k}}\;{\rm{and}}\;{\rho _{\vec k}} = {\rho _{ - \vec k}}\quad .$$
Furthermore, in Fig. 1(b), we see that vectors
 ${\vec K_j},\;j = 1,\;2,\;3$
are all equivalent in relation to the reciprocal lattice of the graphene structure, as well as in relation to each other. It follows that
 $$\left( {{v_{{{\vec K}_j}}} \cdot {\rho _{{{\vec K}_j}}}} \right) = \left( {{v_K}\left\langle {{\rho _K}} \right\rangle } \right),\quad j = 1,\;2,\;3\quad .$$
The quantity v K is the second fundamental parameter of our model, the others being the effective band mass µ, Eq. (2.2) and the CDW number K. This completes our model for a CDW having the graphene electronic structure, determined in terms of the Hartree Eq. (2.18), now in the form,
 $$\left[ { - {1 \over {2\mu }}{\nabla ^2} + 2{\Omega ^2} \cdot {v_K} \cdot \left\langle {{\rho _K}} \right\rangle \cdot \sum\limits_{j' = 1}^3 {\cos \left( {{{\vec K}_{j'}} \cdot \vec r} \right)} } \right] \cdot {\psi _j}\left( {\vec r} \right) = {\varepsilon _j} \cdot {\psi _j}\left( {\vec r} \right)\quad .$$
III. METHOD: SOLVING THE HARTREE EQUATION
A. Tight-binding approximation
We now undertake the solution of Eq. (2.29). The discovery of the electronic structure of graphene dates from Wallace’s 1947 paper, Reference Novoselov, Geim, Morozov, Jiang, Zhang, Dubonos, Grigorieva and Firsov2 before the era of electronic computation. Using only analytical methods applied in very simple approximations, Wallace was able to get the qualitative features of graphene correctly. Since that approach was successful, and fits with our objective of keeping our analysis as simple as possible, we shall follow Wallace’s work closely. To this end, we introduce the tight-binding approximation. It is briefly described by Wallace and in more detail by Ashcroft and Mermin. Reference Ashcroft and Mermin6
We begin with Bloch functions of Wannier type, see Wallace’s Eq. (2.2). Because of the diatomic nature of our crystal basis, we view the crystal lattice as a superposition of two sublattices, A and B. Then the normalized Hartree eigenfunctions in Eq. (2.29) are
 $${\psi _{\vec k}}\left( {\vec r} \right) = {1 \over {\sqrt n }}\left\{ {{\varphi _{1,\vec k}}\left( {\vec r} \right) \pm {\varphi _{2,\vec k}}\left( {\vec r} \right)} \right\}\quad ,$$
where ± refers to states outside/inside BZI, and where
 $${\varphi _{1,\vec k}} = \sum\limits_A {\exp \left( {i\vec k \cdot {{\vec R}_A}} \right) \cdot {\rm X}\left( {\vec r - {{\vec R}_{\rm{A}}}} \right)\quad ,}$$
 $${\varphi _{2,\vec k}} = \sum\limits_B {\exp \left( {i\vec k \cdot {{\vec R}_B}} \right) \cdot {\rm X}\left( {\vec r - {{\vec R}_B}} \right)\quad ,}$$
with
 ${\rm X}\left( {\vec r} \right)$
a normalized ground state atomic-like orbital. Note that we have now labeled ψ
j
by
 $\vec k$
values, where
 $\vec k$
ranges over the n occupied Hartree eigenstates constituting the first Brillouin zone, BZI, similarly for ε
j
to become
 ${\varepsilon _{\vec k}}$
. Now following Wallace, for the single particle energy, here
 ${\varepsilon _{\vec k}}$
and in Wallace E, we have
 $${\varepsilon _{\vec k}} = \left\{ {{{h'}_{11}}\left( {\vec k} \right) \pm \left| {{{h'}_{12}}\left( {\vec k} \right)} \right|} \right\}\quad .$$
In Eq. (3.4),
 $${h'_{11}}\left( {\vec k} \right) = \int {{{\rm{d}}^2}r \cdot \varphi _{1,\vec k}^ * } \left( {\vec r} \right) \cdot h\left( {\vec r} \right) \cdot {\varphi _{1,\vec k}}\left( {\vec r} \right)\quad ,$$
 $${h'_{12}}\left( {\vec k} \right) = \int {{{\rm{d}}^2}r \cdot \varphi _{1,\vec k}^ * } \left( {\vec r} \right) \cdot h\left( {\vec r} \right) \cdot {\varphi _{2,\vec k}}\left( {\vec r} \right).$$
We now implement the tight-binding approximation by neglecting all but nearest-neighbor overlap integrals in sublattice A (or B) for the atomic-like orbitals
 ${\rm X}\left( {\vec r} \right)$
in
 ${h'_{11}}$
, Eq. (3.5), and further, neglecting all but nearest-neighbor integrals between sublattices A and B in
 ${h'_{12}}$
, Eq. (3.6).
Still following Wallace, we introduce the periodic potential V of the system. In the present case, this is the scf in Eq. (2.29),
 $$V\left( {\vec r} \right) = 2{\Omega ^2} \cdot {v_K} \cdot \left\langle {{\rho _K}} \right\rangle \cdot \sum\limits_{j = 1}^3 {\cos \left( {{{\vec K}_j} \cdot \vec r} \right)\quad .}$$
We also introduce the potential
 $U\left( {\vec r} \right)$
for an isolated atomic-like orbital, determined from the minima of
 $V\left( {\vec r} \right)$
. The precise analytical form of
 $U\left( {\vec r} \right)$
will be given in Sec. III.B. It is the combination (U–V) that is central to the tight-binding approximation. Then from Wallace, and verifying his results, we obtain
 $${h'_{11}} = {\varepsilon _0} - 2{\gamma '_0}\left[ {2\cos \left( {{{\sqrt 3 } \over 2}a{k_x}} \right)\cos \left( {{1 \over 2}a{k_y}} \right) + \cos \left( {a{k_y}} \right)} \right]\quad ,$$
 $$\left| {{{h'}_{12}}} \right| = {\gamma _0}{\left[ {1 + 4{{\cos }^2}\left( {{1 \over 2}a{k_y}} \right) + 4\cos \left( {{1 \over 2}a{k_y}} \right)\cos \left( {{{\sqrt 3 } \over 2}a{k_x}} \right)} \right]^{1/2}}\quad .$$
In Eq. (3.8),
 $${\varepsilon _0} = \int {{{\rm{d}}^2}r \cdot {{\rm X}^*}\left( {\vec r} \right) \cdot h\left( {\vec r} \right) \cdot {\rm X}\left( {\vec r} \right)\quad ,}$$
 $${\gamma '_0} = \int {{{\rm{d}}^2}r \cdot {{\rm X}^ * }\left( {\vec r} \right) \cdot h\left( {\vec r} \right) \cdot {\rm X}\left( {\vec r - {{\vec R}_A}} \right)} \quad ,$$
where
 ${\vec R_A}$
is any nearest-neighbor displacement of an atomic-like position from the origin in sublattice A. In Eq. (3.9),
 $${\gamma _0} = \int {{{\rm{d}}^2}r \cdot {{\rm X}^ * }\left( {\vec r} \right) \cdot h\left( {\vec r} \right) \cdot {\rm X}\left( {\vec r - {{\vec R}_B}} \right)\quad ,}$$
where
 ${\vec R_B}$
has the same meaning in sublattice B. From Fig. 1(a), we see that
 $${\vec R_A} = {\vec a_1},\;{\vec R_B} = {\vec a_0}\quad .$$
From the tight-binding approximation, we now have
 $${\gamma '_0} = \int {{{\rm{d}}^2}r \cdot {{\rm X}^ * }\left( {\vec r} \right) \cdot \left[ {U\left( {\vec r} \right) - V\left( {\vec r} \right)} \right] \cdot {\rm X}\left( {\vec r - {{\vec a}_1}} \right)\quad ,}$$
 $${\gamma _0} = \int {{{\rm{d}}^2}r \cdot {{\rm X}^ * }\left( {\vec r} \right) \cdot \left[ {U\left( {\vec r} \right) - V\left( {\vec r} \right)} \right] \cdot {\rm X}\left( {\vec r - {{\vec a}_0}} \right)\quad .}$$
Note that ε0 is the energy of an electron in the atomic-like potential
 $U\left( {\vec r} \right)$
. Also note that our definitions of U and V are vice versa to the definitions used by Ashcroft and Mermin.
Reference Ashcroft and Mermin6
Eq. (3.4), along with all the other formulae of this subsection, constitutes the tight-binding solution of our Hartree equation. However, we have yet to specify the atomic-like orbitals
 ${\rm X}\left( {\vec r} \right)$
in Eqs. (3.2) and (3.3).
B. Atomic-like orbitals
For our two-dimensional waveform
 $V\left( {\vec r} \right)$
, consisting of three harmonic waves, Eq. (3.7), we approximate
 $V\left( {\vec r} \right)$
in the region near one of its minima by the lowest order fit, namely, a cylindrically symmetrical quadratic form,
 $U\left( {\vec r} \right)$
,
 $$U\left( {\vec r} \right) = \left( { - A + {1 \over 2}B \cdot {r^2}} \right)\quad .$$
This potential will define our atomic-like orbitals
 ${\rm X}\left( {\vec r} \right)$
. In Eq. (3.16), we have introduced a negative sign based on the assumption that A is positive because the minima of
 $V\left( {\vec r} \right)$
come from the minima of three cosines, all of which are negative at their minima. An electron in such a potential satisfies a two-dimensional cylindrical Schrödinger equation,
 $$\left[ { - {1 \over {2\mu }} \cdot {\nabla ^2} + \left( { - A + {1 \over 2}B{r^2}} \right)} \right] \cdot {\rm X}\left( {\vec r} \right) = {\varepsilon '_0} \cdot {\rm X}\left( {\vec r} \right)\quad .$$
Consider a trial form for
 ${\rm X}\left( {\vec r} \right)$
,
 $${\rm X}\left( r \right) = \sqrt {{2 \over {\rm{\pi }}}} \cdot \alpha \cdot \exp \left( { - {\alpha ^2}{r^2}} \right)\quad ,$$
i.e., a normalized harmonic oscillator ground state wave function. If it is to be an eigenfunction in Eq. (3.17), we must have
 $$B = {{4{\alpha ^4}} \over \mu }$$
and
 $${\varepsilon '_0} = \left( {{{2{\alpha ^2}} \over \mu } - A} \right)\quad .$$
Now in Eq. (3.16), (−A) is the minimum value of our scf potential Eq. (3.7), and B is its curvature. First consider (−A),
 $$\left( { - A} \right) = 2\Omega \cdot {v_K} \cdot \left\langle {{\rho _K}} \right\rangle \cdot {\left[ {\sum\limits_{j = 1}^3 {\cos \left( {{{\vec K}_j} \cdot \vec r} \right)} } \right]_{\vec r = {{\vec r}_1}}}\quad ,$$
where
 ${\vec r_1}$
is a minimum of
 $V\left( {\vec r} \right)$
. For example, atomic-like site (3) in Fig. 1(a) has position,
 $${\vec r_1} = {a \over {2\sqrt 3 }} \cdot \left( {\hat i + \sqrt 3 \hat j} \right)$$
so
 $$A = 3 \cdot \Omega \cdot {v_K}\left\langle {{\rho _K}\left( \alpha \right)} \right\rangle \quad .$$
It follows from Eqs. (3.20) and (3.23) that the atomic-like ground state energy is
 $${\varepsilon '_0} = \left[ {{{2{\alpha ^2}} \over \mu } - 3\Omega \cdot {v_K}\left\langle {{\rho _K}\left( \alpha \right)} \right\rangle } \right]\quad .$$
Now regarding B, the requirement that Eq. (3.17) should be an eigenvalue equation gives us Eq. (3.19). However, we also require B to make U(r), Eq. (3.16), fit the curvature of the potential
 $V\left( {\vec r} \right)$
at its minimum. The second order terms from the expansion of V(r) about
 $\vec r = {\vec r_1}$
are
 $${ {1 \over 2}{\sum\limits_{\alpha ,\beta \simeq 1}^2 {\left[ {{{{\partial ^2}} \over {\partial {\chi _\alpha } \cdot \partial {\chi _\beta }}}\left[ {2\Omega \cdot {v_K} \cdot \left\langle {{\rho _K}} \right\rangle \cdot \sum\limits_{j = 1}^3 {\cos \left( {{{\vec K}_j} \cdot \vec r} \right)} } \right] \cdot {\chi _\alpha }{\chi _\beta }} \right]} _{\vec r = {{\vec r}_1}}} = \Omega \cdot {v_K} \cdot \left\langle {{\rho _K}} \right\rangle \cdot {\left( {{{2\pi } \over a}} \right)^2} \cdot {r^2}\quad . \cr}$$
In Eq. (3.25), χ1 = x, χ2 = y, r 2 = (x 2 + y 2). Thus combining Eqs. (3.19) and (3.25), we have
 $$B = {{4{\alpha ^4}} \over \mu } = 2\Omega \cdot {v_K} \cdot \left\langle {{\rho _K}} \right\rangle \cdot {\left( {{{2\pi } \over a}} \right)^2}\quad .$$
This is a powerful constraint upon the solution of the Hartree equation, and as we shall see, it plays a central role in the analysis of the model system.
IV. THE SELF-CONSISTENCY REQUIREMENT
Eq. (3.26) expresses the conditions that (i) our assumed Bloch wave solution, Eqs. (3.1)–(3.3), and (3.18), is an eigenfunction of the Hartree equation and (ii) that our assumed atomic-like orbital X(r) fits perfectly the minima of the scf potential. In that case, each Hartree eigenfunction depends on all n of the eigenfunctions. For the ground state of the system, we take the n Hartree eigenfunctions to be those of the lowest single-particle eigenvalues
 ${\varepsilon _{\vec k}}$
, see Eq. (3.18). We therefore call Eq. (3.26) the self-consistency requirement.
A. Occupied
 $\vec k$
-space region in the ground state

To examine the scf more fully, we need explicit knowledge of 〈ρ K 〉. From Eqs. (2.13) and (2.6),
 $$\left\langle {{\rho _K}} \right\rangle = {1 \over \Omega } \cdot \sum\limits_{j = 1}^n {\int {{d^2}r\psi _j^ * \left( {\vec r} \right) \cdot \exp \left( { - i\vec K \cdot \vec r} \right) \cdot {\psi _j}\left( {\vec r} \right)\quad .} }$$
In Sec. III.A, we have cast the Hartree eigenstates in terms of
 $\vec k$
values, Eq. (3.1) and later. Thus, consider the first Brillouin zone, denoted BZI: It consists of
 $\vec k$
-space values within the mutual limits,
 $$\vec k = \pm {{{{\vec b}_i}} \over 2},\;i = 1,\;2;\;{{{{\vec b}_3}} \over 2} = {{\left( {{{\vec b}_1} + {{\vec b}_2}} \right)} \over 2}$$
or
 $$\vec k = \pm {{{{\vec K}_i}} \over 2},\;i = 1,\;2,\;3\quad ,$$
see Eqs. (2.23) and (2.24). This area, A BZI, is therefore
 $${A_{{\rm{BZI}}}} = {{\sqrt 3 } \over 2} \cdot {b^2}\quad .$$
The density
 $D\left( {\vec k} \right)$
of
 $\vec k$
-space points is
 $$D\left( {\vec k} \right) = {\Omega \over {{{\left( {2\pi } \right)}^2}}}\quad ,$$
where Ω is the area of the Born-von Karman region containing n electrons in N primitive unit cells of the Bravais lattice, each containing two electrons,
 $$N = {n \over 2}\quad .$$
Thus from Eqs. (4.4) and (4.5), the number of one-electron states in BZI including spin is
 $$2 \cdot {A_{{\rm{BZI}}}} \cdot D\left( {\vec k} \right) = 2 \cdot \left( {{{\sqrt 3 } \over 2} \cdot {b^2}} \right) \cdot \left( {{\Omega \over {{{\left( {2\pi } \right)}^2}}}} \right)\quad .$$
Now Ω is
 $$\Omega = N \cdot \left| {{{\vec a}_1} \times {{\vec a}_2}} \right| = n{a^2} \cdot {{\sqrt 3 } \over 4}\quad ,$$
from Eqs. (4.6) and (2.19). We obtain the value of b from Eq. (2.21), giving for Eq. (4.7),
 $$2 \cdot {A_{{\rm{BZI}}}} \cdot D\left( {\vec k} \right) = n\quad .$$
This verifies that the number of electrons in our CDW exactly fills BZI. Wallace Reference Wallace1 has shown that all the Hartree eigenstates in BZI have lower energy than those outside.
B. The role of average electronic density in CDW
The average electronic density in
 $\vec r$
-space, ρ0, is
 $${\rho _0} = {n \over \Omega }\quad .$$
From Eq. (4.8), and the relationship between a and K, Eqs. (2.19) and (2.21), we find
 $${\rho _0} = \sqrt 3 {\left( {{K \over {2\pi }}} \right)^2}$$
or
 $$K = \left( {2\pi } \right) \cdot {\left( {{{{\rho _0}} \over {\sqrt 3 }}} \right)^{1/2}}\quad .$$
In other words, Eq. (4.11) tells us that if a CDW is required with a given value of K, then the average density must have the value specified there. On the other hand, if our system has a given density ρ0, the only K-value which can form in a CDW is given by Eq. (4.12).
C. Evaluation of 〈ρ K 〉
We must now evaluate 〈ρ
K
〉, Eq. (4.1). There, we convert the sum over j to an integral over
 $\vec k$
-space in BZI, (×2) for spin,
 $$\sum\limits_{j = 1}^n { \to 2 \cdot \int_{{\rm{BZI}}} {{{\rm{d}}^2}k \cdot D\left( {\vec k} \right)\quad .} }$$
In Eq. (4.1), expressed in terms of
 $\vec k$
,
 ${\psi _{\vec k}}\left( {\vec r} \right)$
is given by Eqs. (3.1)–(3.3), and (3.18), with the sums over
 ${\vec R_A}$
and
 ${\vec R_B}$
limited according to our application of the tight-binding approximation. The resultant evaluation has been determined analytically by using MATLAB and MAPLE independently, with the result,
 $$\left\langle {{\rho _K}} \right\rangle = {1 \over {{a^2}}} \cdot f\left( w \right)\quad ,$$
where
 $$w = {\left( {\alpha a} \right)^2}$$
and
 $$f\left( w \right) = \exp \left( { - {{2{\pi ^2}} \over {3w}}} \right) \cdot \left[ {{1 \over {2{\pi ^2}}} \cdot \left( {6\sqrt 3 + 4\pi } \right) \cdot \exp \left( { - {w \over 6}} \right) - {2 \over {\sqrt 3 }}} \right]\quad .$$
D. Self-consistency
We now evaluate the scf condition expressed by Eq. (3.26), using the notation w, Eq. (4.15), the expression for 〈ρ K 〉, Eqs. (4.14)–(4.16), and
 $${v_K} = {1 \over \Omega }\int {{{\rm{d}}^2}r \cdot v\left( r \right) \cdot \exp \left( { - i\vec K \cdot \vec r} \right)\quad .}$$
The result is
 $${w^2} = \left( {\mu .{{\tilde v}_K}} \right) \cdot f\left( w \right)\quad ,$$
where
 $${\tilde v_K} = 2{\pi ^2} \cdot \int {{{\rm{d}}^2}r \cdot v\left( r \right) \cdot {e^{ - i\vec K \cdot \vec r}} = 2{\pi ^2} \cdot \Omega \cdot {v_K}} \quad .$$
Equation (4.18) is the self-consistency condition required for a solution to the Hartree equation within the context of the tight-binding approximation as applied to a CDW. Only values of w that satisfy Eq. (4.18) may be used in calculating properties of the CDW system, such as the total energy.
From its definition, Eq. (4.15), w must be positive. From Eq. (4.18), several possibilities arise. Basically, it is required that
 $$\left( {\mu \cdot {{\tilde v}_K}} \right) \cdot f\left( w \right) > 0\quad .$$
We shall exemplify the possible solutions by considering here only the case,
 $$\mu > 0\quad .$$
We remark that the case μ < 0 means that the electron gas consists of hole-like, rather than electron-like, quasiparticles.
Now from Eqs. (4.20) and (4.21), two possibilities remain as follows:
 $${\rm{Case}}\;\left( {\rm{i}} \right):\;{\tilde v_K} > 0\;{\rm{and}}\;f\left( w \right) > 0\quad ,$$
 $${\rm{Case}}\;\left( {{\rm{ii}}} \right):\;{\tilde v_K} \lt 0\;{\rm{and}}\;f\left( w \right) \lt 0\quad .$$
Consider Case (i). From Eq. (4.16), we find that f(w) is positive only for
 $$0 \le w \le 0.0435\quad .$$
For w = 0.0435, ∝ ≈ (0.2/a) ≈ 1/(5a). Now ∝ is a measure of the range R of the Gaussian atomic-like orbital, namely, the distance at which the orbital’s amplitude is e −1 ≈ 0.37 times its maximum value. Thus we find that for f(w) > 0,
 $$w = {\left( {\alpha a} \right)^2} = {\left( {{a \mathord{\left/ {\vphantom {a R}} \right. \kern-\nulldelimiterspace} R}} \right)^2} \lt 0.0435\quad ,$$
whence
 $$R > 8.3{a_0}\quad ,$$
where a
0 is the nearest-neighbor distance in the graphene structure. However, implicit in the tight-binding approximation is the assumption that the atomic-like orbitals are well-localized within a range R ≲ a
0. Thus the solution with f(w) > 0 is inconsistent with the present model. We conclude that Case (i) is unphysical. At this point, we therefore conclude, perhaps not surprisingly, that with μ > 0,
 ${\tilde v_K}$
and therefore v
K
must be negative, i.e., attractive. It means that, at wave number K, the phonon-mediated part of the pairwise interaction must be attractive and must overwhelm the corresponding component of the Coulomb repulsion so that the total interaction is also attractive.
Now consider Case (ii), with
 ${\tilde v_K} \lt 0$
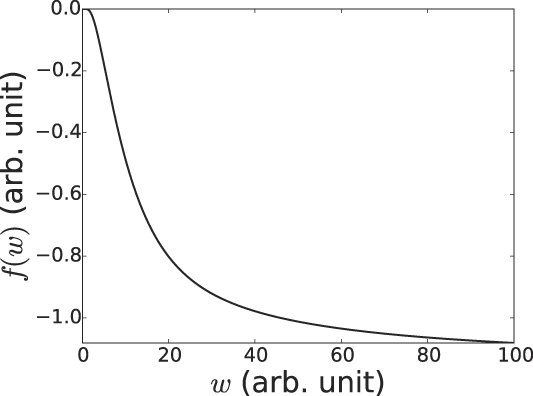
and f(w) < 0. The latter condition is found to be valid for w > 0.0435. Figure 3 shows the plot of f(w) versus w, with a horizontal asymptote at |f(w)| = 1.1547. We now express the scf condition in terms of w as a function of
 $x = \left( {\mu \cdot \left| {{{\tilde v}_K}} \right|} \right)$
, with μ > 0,
 $${{{w^2}} \over {\left| {f(w)} \right|}} = x\quad .$$
f(w), Eq. (4.16), plotted versus w.

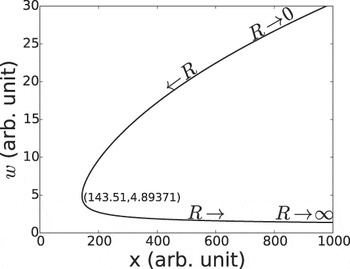
This is plotted in Fig. 4, where the coordinates for a minimum value of x are given, showing that self-consistency is not possible for x ≲ 143.5. Figure 4 will be further interpreted in Sec. V.
Plot of w versus x, showing the trends of range R, for the case μ = 1. See Eq. (4.27).

V. TOTAL ENERGY OF THE CDW SYSTEM
The total energy E n of our n-electron system has been introduced in terms of the Hartree approximation, see Eq. (2.10). We have chosen to solve the Hartree equation by following Wallace’s approach, namely, the tight-binding approximation, Sec. III.A. In Eq. (2.10), the first term is converted to
 $$\sum\limits_{j = 1}^n {{\varepsilon _j} = 2\int_{{\rm{BZI}}} {{{\rm{d}}^2}k \cdot \varepsilon \left( k \right) \cdot D\left( {\vec k} \right)\quad .} }$$
The second term in Eq. (2.10), correcting for double counting of pairwise interactions in ε j , is evaluated from Eq. (2.9). Now, the pairwise interaction energy V 2 of our system is
 $${V_2} = {1 \over 2}\sum\limits_{j,j' = 1}^n {\left\langle {\Psi \left| {v\left( {{{\vec r}_j} - {{\vec r}_{j'}}} \right)} \right|\Psi } \right\rangle \quad .}$$
Half of this must be subtracted from the sum over ε j .
Let us Fourier analyze
 $v\left( {\vec r} \right)$
in the union of spin space and configuration space,
 $$v\left( {{{\vec r}_j} - {{\vec r}_{j'}}} \right) = 2\sum\limits_{\vec k} {{v_{\vec k}} \cdot \exp \left[ {i\vec k \cdot \left( {{r_j} - {{\vec r}_{j'}}} \right)} \right]} \quad .$$
Then,
 $${V_2} = {1 \over 2} \cdot 2 \cdot {\sum\limits_{\vec k} {{v_{\vec k}} \cdot \left | {\sum\limits_j {\int {{{\rm{d}}^2}{{\vec r}_j} \cdot \exp \left( {i\vec k \cdot {{\vec r}_j}} \right) \cdot {{\left| {{\psi _j}\left( {{r_j}} \right)} \right|}^2}} } } \right|} ^2}\quad .$$
As explained in Sec. II.C, the integral in Eq. (5.4) is simply
 $\left( {\Omega \cdot \left\langle {{\rho _{\vec k}}} \right\rangle } \right)$
. Our correction term is therefore
 $$\left( { - {1 \over 2} \cdot {V_2}} \right) = - {1 \over 2}\sum\limits_{\vec k\left( {{\rm{BZI}}} \right)} {{\Omega ^2} \cdot {{\left| {\left\langle {{\rho _{\vec k}}} \right\rangle } \right|}^2} \cdot {v_{\vec k}}} \quad .$$
For our CDW case, the values of
 $\vec k$
are limited to
 $\pm {\vec K_j}$
, j = 1, 2, 3, as in Eqs. (2.23) and (2.24) of Sec. II.E, so now,
 $$\left( { - {1 \over 2}{V_2}} \right) = - 3{\Omega ^2}{\left| {\left\langle {{\rho _K}} \right\rangle } \right|^2} \cdot {v_K}\quad .$$
The total energy expression E n , Eq. (2.10), is therefore
 $${E_n} = \left[ {2\int_{{\rm{BZI}}} {{{\rm{d}}^2}k \cdot \varepsilon \left( {\vec k} \right) \cdot D\left( {\vec k} \right) - 3{v_K}{\Omega ^2} \cdot {{\left| {\left\langle {{\rho _K}} \right\rangle } \right|}^2}} } \right]\quad .$$
The first term, Eq. (5.1), is made explicit by introducing the results of Sec. III. The result can be expressed analytically, with the exception of one integral, of the form,
 $$I\left( a \right) \sim \int_{{\rm{BZI}}} {{{\rm{d}}^2}k{{\left[ {1 + 4{{\cos }^2}\left( {{1 \over 2}a{k_y}} \right) + \,\,4\cos \left( {{1 \over 2}a{k_y}} \right)\cos \left( {{{\sqrt 3 } \over 2}a{k_x}} \right)} \right]}^{1/2}}} \quad .$$
By numerical integration, a constant c 0 is introduced, where
 $${c_0} = 17.94479903\quad .$$
The final result is
 $$\eqalign{ {E_n} = {{4\Omega } \over {\sqrt 3 .{a^2}}} \cdot \left( {{{2{\alpha ^2}} \over \mu } - 3\Omega \cdot {{{v_K}} \over 2} \cdot \left\langle {{\rho _K}} \right\rangle } \right) + {c_0} \cdot {\Omega ^2} \cdot {v_K} \cdot \left\langle {{\rho _K}} \right\rangle \cdot \exp \left( { - {{{{\left( {\alpha a} \right)}^2}} \over 6}} \right)\quad . \cr \left[ {{6 \over {{{\left( {\pi a} \right)}^2}}} - {1 \over {{a^2}}}\left( {{1 \over 3} + {2 \over {{{\left( {\alpha a} \right)}^2}}}} \right) + {2 \over {{{\left( {\pi a} \right)}^2}}} \cdot \exp \left( { - {{2{\pi ^2}} \over {3{{\left( {\alpha a} \right)}^2}}}} \right)} \right] - 3{\Omega ^2} \cdot {v_K} \cdot {\left| {\left\langle {{\rho _K}} \right\rangle } \right|^2}\quad . \cr}$$
We now can express E
n
in terms of the material parameters µ, v
K
(or
 ${\tilde v_K}$
), and ρ0, which determines K, Eq. (4.11) or (4.12) in a canonical form by introducing a set of previously defined relationships, as follows. For Ω, we use Eq. (4.8). For α, we use Eq. (4.15). For 〈ρ
K
〉, we use Eq. (4.14) with (4.16). For v
K
, we use Eq. (4.19) to introduce
 ${\tilde v_K}$
,
 $${\tilde v_K} = 2\pi {\Omega ^2} \cdot {v_K}\quad .$$
For a, we use Eqs. (2.24) and (2.21) to get
 $${1 \over {{a^2}}} = {3 \over 4}{\left( {{K \over {2\pi }}} \right)^2}\quad .$$
With these substitutions we get, from Eq. (5.10), the total energy E n ,
 $${E_n} = n \cdot \left( {{{{K^2}} \over {2\mu }}} \right) \cdot \left( {{3 \over {8{\pi ^2}}}} \right) \cdot G\left( w \right)\quad ,$$
where
 $$\eqalign{ G\left( w \right) = 2w + {{\sqrt 3 } \over {4{\pi ^2}}} \cdot \left( {\mu \cdot \left| {{{\tilde v}_K}} \right|} \right) \cdot \left| {f\left( w \right)} \right|\quad . \,\, \left[ { - 4 \cdot \sqrt 3 + {c_0}\left[ {{6 \over {{\pi ^2}}} - \left( {{1 \over 3} + {2 \over w}} \right) + {2 \over {{\pi ^2}}}\exp \left( { - {{2{\pi ^2}} \over {3w}}} \right)} \right]} \right. \cdot \exp \left( { - {w \over 6}} \right)\left. {\matrix{ {} \cr {} \cr} + 3\left| {f\left( w \right)} \right|} \right]\quad . \cr}$$
This expression for G(w) may be evaluated subject to the scf condition given in Eq. (4.27), in terms of the quantity x introduced in Sec. IV,
 $$x = \left( {\mu \cdot \left| {{{\tilde v}_K}} \right|} \right),\quad \mu > 0\quad .$$
This is done by using w as a function of x, as plotted in Fig. 4, resulting in G(w) becoming Γ(x), shown in Fig. 5,
 $${E_n} = n\left( {{{{K^2}} \over {2\mu }}} \right)\left( {{3 \over {8{\pi ^2}}}} \right) \cdot \Gamma \left( x \right)\quad .$$
Plot of Γ(x) versus
 $x = \left( {\mu \left| {{{\tilde v}_K}} \right|} \right)$
for the case μ = 1, in the formula for total CDW energy E
n
, Eqs. (5.14) and (5.16): see discussion following Eq. (5.16). Shown by vertical dashed lines are plausible limits on R for validity of the tight-binding approximation, Eqs. (5.17) and (5.18).

We can see in Eq. (5.16) that E n is negative whenever Γ(x) is negative, if µ is positive. From Fig. 5, we can see that Γ(x), and therefore E n , is negative for x > 189.
We shall now show that the limitations of the tight-binding approximation translate into a limitation on the range of
 $x = \mu \cdot \left| {{{\tilde v}_K}} \right|$
within which our results may be expected to be valid. Roughly speaking, tight-binding implies that the range R = α−1 of the atomic-like orbitals [see Eq. (3.18), and discussion following Eq. (4.24)] should be significantly less than the nearest neighbor distance a
0 between pairs of such orbitals. In turn, the scf condition, Eq. (4.27) with the definition
 $w = {\left( {a\alpha } \right)^2} = {\left( {a{\rm{/}}R} \right)^2}$
, gives a direct relationship between R and x.
To illustrate the situation, we consider
 $$0.25 \lt {R \over {{a_0}}} \lt 0.5\quad .$$
The case R = 0.5a 0 is a liberally large value, where the atomic-like orbital has an amplitude A halfway between nearest-neighbor sites of ∼0.37A 0, where A 0 is the atomic orbital maximum. For the case of R = 0.25a 0, the ratio (A/A 0) is ∼0.02, i.e., the overlap of two orbitals might be considered to be negligible. The criterion expressed in Eq. (5.17) can be given in terms of x by using the scf condition, to read
 $$250 \le x \le 2{\rm{,}}290\quad .$$
These limits, relating to the tight-binding approximation, are shown in Fig. 5 by vertical dashed lines.
VI. THE SPATIALLY UNIFORM STATE
We recall that from Eq. (2.3), our model consists only of electrons with kinetic energy and with pairwise interactions that have both Coulomb repulsion and phonon-mediated attraction. We shall now show that there is a simple solution to this model, apart from the CDW solution developed heretofore. We shall examine the kinetic energy part first and then see what the interactions contribute to the total energy.
Eigenstates of the single-particle kinetic energy operator are
 $${\psi _j}\left( {\vec r} \right) = {\Omega ^{ - 1/2}} \cdot \exp \left( {i{{\vec k}_j} \cdot \vec r} \right);\quad {\varepsilon _j} = {{k_j^2} \over {2\mu }}\quad ,$$
see Eqs. (2.7) and (2.8). It is obvious that the spatial distribution of electrons in this n-particle system is uniform, i.e., independent of particle positions or spins. The ground state of this noninteracting system consists of vectors
 ${\vec k_j}$
that fill the Fermi circle k = k
F, where k
F is defined by
 $$2\int_{k = 0}^{{k_{\rm{F}}}} {{{\rm{d}}^2}k \cdot D\left( {\tilde k} \right) = n} \quad ,$$
see Eq. (4.13). From this, we find
 $${k_{\rm{F}}} = {\left( {2{\rm{\pi }} \cdot {\rho _0}} \right)^{1/2}}\quad .$$
Thus the total ground state kinetic energy
 $E_n^{(0)}$
is
 $$E_n^{(0)} = 2\int_{k = 0}^{{k_{\rm{F}}}} {{{\rm{d}}^2}k \cdot D\left( {\vec k} \right) \cdot {{{k^2}} \over {\left( {2\mu } \right)}} = n\left( {{{\pi \cdot {\rho _0}} \over {2\mu }}} \right)\quad .}$$
Now consider the pairwise interactions’ contribution to the uniform density state. Up to now, and throughout, as in Eq. (5.2), we have included terms j = j′ so that in the Hartree equation each electron sees the same scf, to conform to the principle that identical particles must be indistinguishable. We acknowledge, however, that this principle is already violated in the Hartree approximation by the assumed form of the n-particle wave function, Eq. (2.6), where each particle exists exclusively in a single basis function state, i.e., the jth particle is represented by ψ j and is therefore distinguishable from particle j′ ≠ j. In the uniform state, with
 $$\Psi _n^{{\rm{(0)}}} = \prod\limits_{j = 1}^n {{\Omega ^{ - 1/2}} \cdot \exp \left( {i{{\vec k}_j} \cdot {{\vec r}_j}} \right)\quad } ,$$
the pairwise interaction energy V (0) is
 $${V^{(0)}} = \left\langle {\Psi _n^{(0)}\left| {{1 \over 2}\sum\limits_{j,j' = 1}^n {v\left( {{{\vec r}_j} - {{\vec r}_{j'}}} \right)} } \right|\Psi _n^{(0)}} \right\rangle \quad .$$
The contribution to V (0) from terms with j = j′ is simply
 $$\sum\limits_{j = 1}^n {v\left( 0 \right) = n \cdot v\left( 0 \right)\quad .}$$
Consider now a single term with j′ ≠ j. For
 $v\left( {{{\vec r}_j} - {{\vec r}_{j'}}} \right)$
, write the Fourier series,
 $$v\left( {{{\vec r}_j} - {{\vec r}_{j'}}} \right) = \sum\limits_{\vec k} {{v_{\vec k}} \cdot \exp \left( {i\vec k \cdot {{\vec r}_j}} \right) \cdot \exp \left( { - ik \cdot {{\vec r}_{j'}}} \right)\quad .}$$
Such a term contributes to V (0),
 $${v_{\vec k}} \cdot \left\langle {{\psi _j}\left| {\exp \left( {i\vec k \cdot {{\vec r}_j}} \right)} \right|{\psi _j}} \right\rangle \cdot \left\langle {{\psi _{j'}}\left| {\exp \left( { - i\vec k \cdot {{\vec r}_{j'}}} \right)} \right|{\psi _{j'}}} \right\rangle \quad .$$
Since here |ψ
j
|2 = 1, and since in our model
 ${v_{\vec k}}$
is limited to
 $\vec k$
-values given in Eqs. (2.23) and (2.24), the relevant terms from Eq. (6.9) are symmetrical in pairs, constituting
 $\cos \hbox( {\vec k \cdot {{\vec r}_j}} \hbox)$
type of terms. Then in Eq. (6.9), we are left with terms like
 $$\left\langle {{\psi _j}\left| {\cos \left( {\vec k \cdot {{\vec r}_j}} \right)} \right|{\psi _j}} \right\rangle = 0\quad .$$
It follows that Eq. (6.7) is the total value of V (0),
 $${V^{(0)}} = n \cdot v\left( 0 \right)\quad .$$
Combining this with the noninteracting particle energy, Eq. (6.4), we have
 $$E_n^{(0)} = n\left( {{{\pi {\rho _0}} \over {2\mu }} + v(0)} \right)\,.$$
This is not useful, however, because v(0) is related to the self-energy of an electron, which can be given meaning only in the context of the quantum field picture of the particle, which is beyond the scope of our very elementary model. We can only assume that the second term in Eq. (6.12) is negligible compared to the first so that
 $E_n^{(0)}$
as given in Eq. (6.4) is the total energy. In general, the limitations of Hartree-based methods that we have mentioned, namely, distinguishability of identical particles, and electron self-energy, can be overcome easily by using the Hartree–Fock approximation (HF), in which neither problem exists. In HF, the exchange energy is also included, rigorously, and correlation can also be included approximately if it is merely perturbative. While HF requires much more work to implement, it also represents a large step in rigor compared to the Hartree approximation. It might therefore be considered for follow up to the present work.
VII. THE STABILITY CONDITION
For the CDW state of the system to be the stable ground state, its energy must be the lowest of all states. In particular, it must have lower energy than
 $E_n^{(0)}$
, the energy of the uniform density state, Eq. (6.4). In Sec. V and in Fig. 5, we have seen that E
n
is negative when Γ(x) is negative and Γ(x) < 0 for x > 189. We have also shown that our tight-binding results are probably not valid for x-values that are much less than x = 250. Thus, within the range of validity of our model, E
n
is generally negative. At the same time,
 $E_n^{(0)}$
, Eq. (6.4), is always positive, for μ > 0. Thus the requirement, that
 ${E_n} \lt E_n^{(0)}$
for stability of the CDW state relative to the uniform state, is generally satisfied for our model.
We can relate E
n
to
 $E_n^{(0)}$
by using the relationship between K and ρ0, Eq. (4.12). Then we have
 $${E_n} = E_n^{(0)} \cdot {{\sqrt 3 } \over {2\pi }} \cdot \Gamma \left( x \right)\quad .$$
This enables us to introduce the fractional deviation δE
n
of E
n
from
 $E_n^{(0)}$
,
 $$\delta {E_n} = {{\left( {E_n^{(0)} - {E_n}} \right)} \over {E_n^{(0)}}} = \left[ {1 - {{\sqrt 3 } \over {\left( {2\pi } \right)}} \cdot \Gamma \left( x \right)} \right]\quad .$$
The stability requirement, obtained in the previous paragraph, that
 $E_n^{(0)} > {E_n}$
, now becomes δE
n
> 0, which from Eq. (7.2) comes down to
 $$\Gamma \left( x \right) \lt {{\left( {2\pi } \right)} \over {\sqrt 3 }} \approx 3.628\quad .$$
This is the basic analytical condition for stability of the CDW state relative to the uniform-density state. The upper limit of 3.6 on Γ(x) is manifestly positive. However, in Fig. 5 we see that Γ(x) is negative for x > 189, and in particular, it is negative throughout the range of x-values within which our tight-binding method may be expected to be valid. This range has a lower limit of x = 250 at least, as expressed in Eq. (5.18), and as seen in Fig. 5. We therefore see that the stability condition for our model system is satisfied conclusively if only the scf condition is satisfied.
VIII. SUMMARY AND CONCLUSIONS
A. Summary
We have raised the question whether the scf for the electrons in a two-dimensional CDW can mimic the potential due to the atomic cores in graphene. If so, then the band structure in the CDW state will be qualitatively the same as it is in graphene, and one might expect it to have at least some of the properties of graphene. The mathematical and physical requirements for such a CDW system may define a class of materials that are quite different from graphene, while possessing some of graphene’s attractive properties.
We have adopted a simple model for a CDW in which the Hamiltonian for an n-electron system consists of kinetic energy and pairwise electron interactions (pwi’s). The kinetic energy includes the periodic potential due to the atomic cores of our host crystal by including an effective band mass, denoted µ. The pwi’s collectively define a self-consistent field which, for a model CDW, must be periodic. The periodicity will have minima and maxima that correspond to the atomic-core pattern and its interstices in graphene. The scf introduces, in addition to µ, the physical parameters
 ${\tilde v_K}$
and K, representing, respectively, the amplitude and wave number of the CDW.
The wave number K is determined by the average electronic density ρ0. We solve this many-electron problem by using very simple approximations, based as much as possible on Wallace’s original method. In this way, we determine the scf condition for the existence of an appropriate CDW. We develop an algorithm for an n-electron system, leading to an analytical formula for the total energy. Within the same model, we evaluate the total energy of a uniform-density state. We then determine in detail the criteria for the stability of the CDW relative to the uniform density state.
B. Conclusions
The existence of a two-dimensional CDW mimicking graphene electronic structure relies on the CDW having six dominant terms, all of the same amplitude
 ${\tilde v_K}$
in its Fourier series, which reflects the internal symmetry of graphene, Eqs. (2.23) and (2.24). In general, this must be accomplished by experimental manipulation of basic physical parameters µ,
 ${\tilde v_K}$
and K (or ρ0), qualitatively as has been done to induce SC and CDW in graphene.
We find that, in our model, a self-consistent solution requires that
 ${\tilde v_K}$
should be negative, indicating that at wave number K, the pairwise interaction, consisting of both Coulomb repulsion and phonon-induced attraction, must be attractive in total. Explicitly, however, we find that
 $\left| {{{\tilde v}_K}} \right|$
must be larger than a specific finite value, see Fig. 4. We find that the CDW has a lower total energy than the uniform-density state and is therefore the stable ground state (among the two of them). We have studied the lower-bound limitations placed on
 $\left| {{{\tilde v}_K}} \right|$
for fixed values of µ and ρ0 by the scf, the stability condition, and the tight-binding approximation, successively, and find that there is no contradiction among them. The ultimate limitation is that imposed by the tight-binding approximation.
The results of this study of a tight-binding model of a CDW having the graphene electronic structure support the idea of developing such a class of materials. On the theoretical side, a similar study of a weak-binding model appears feasible and might be useful.
ACKNOWLEDGMENTS
Author J.M.V. gratefully acknowledges, in his capacity as Senior Scholar, the support of the Faculty of Science and of the Department of Physics and Astronomy at the University of Manitoba, without which this work could not have been done. Author O.J.H. was supported in part by the Canadian Natural Sciences and Engineering Council (NSERC). We thankfully acknowledge personal support for this work by D.S. Xue of Lanzhou University and by R. Pandey of Michigan Technological University.