INTRODUCTION
Human African trypanosomiasis (infection with Trypanosoma brucei spp.) is a serious public health problem throughout much of sub-Saharan Africa, and is really 2 distinct diseases rather than one. The West African form of sleeping sickness (infection with T. b. gambiense) causes a chronic disease in humans and it is generally thought that the parasite maintains itself in human populations without a zoonotic reservoir (Fèvre et al. 2006a). The clinical presentation of East African sleeping sickness (infection with T. b. rhodesiense) is markedly different from the West African form in that progression of disease occurs much faster. Also, T. b. rhodesiense does not appear to cause disease in domestic and wild animal hosts. Instead, animal hosts are asymptomatic carriers responsible for the maintenance and spread of the parasite (Fèvre et al. 2006a). Infection with either T. b. rhodesiense or T. b. gambiense is fatal in humans if left untreated. The disease burden of T. b. rhodesiense is outweighed by that of T. b. gambiense, with more than 90% of the 30 000 new cases reported each year being the West African form (T. b. gambiense infection). The World Health Organization (2004) estimated that 1·53 million DALYs (disability-adjusted life years) are lost due to human African trypanosomiasis. Mortality associated with human African trypanosomisasis is ranked ninth out of 25 among the human infectious and parasitic diseases in Africa (Fèvre et al. Reference Fèvre, Odiit, Coleman, Woolhouse and Welburn2008).
Sexual transmission of T. brucei parasites has been reported for T. b. gambiense, and there is evidence for transplacental transmission of both T. b. gambiense and T. b. rhodesiense, but these routes are considered to be of clinical interest rather than of epidemiological importance (Welburn and Maudlin, Reference Welburn and Maudlin1999; Fèvre et al. 2006a). That is, to spread and persist, the parasite is obligated to colonize and mature in tsetse flies. This is not an easy thing for the parasite to achieve and one of the striking features of T. brucei is the low proportion of flies that are not refractory to infection. Even for the subset of flies that are genetically susceptible to infection of the midgut, this susceptibility sharply decreases after the first bloodmeal (Welburn and Maudlin, Reference Welburn and Maudlin1999). Furthermore, the passage and maturation of the parasite in the fly once taken up via a bloodmeal happens relatively slowly (considering the lifespan of the fly), and there is some evidence that tsetse survival is reduced by trypanosome infection (Welburn and Maudlin, Reference Welburn and Maudlin1999). These features imply that the window of opportunity for transmission is narrow and that very few flies are infectious at any one point in time. This is in fact what is observed in the field, even during an epidemic (Okoth and Kapaata, Reference Okoth and Kapaata1986). The low susceptibility and narrow window for transmission from flies appears to be balanced by long infectious periods in the vertebrate hosts. In the case of T. b. gambiense, the infectious period in humans has been recently estimated to be approximately 3 years (Cecchi et al. 2008). Also, the normally arduous terms experienced by the parasite in tsetse may be alleviated when flies are nutritionally stressed, with recent experimental work indicating that such flies are both more susceptible and become infectious sooner (Kubi et al. 2006; Akoda et al. Reference Akoda, Van den Bossche, Lyaruu, De Deken, Marcotty, Coosemans and Van den Abbeele2009a, Reference Akoda, Van den Abbeele, Marcotty, De Deken, Sidibe and Van den Bosscheb).
The causative agents of sleeping sickness are multi-host pathogens, even in the simplest case with only 1 species of Glossina and 1 mammalian host. The basic reproduction number R 0 is a key quantity in epidemiology that is defined for single-host pathogens as the expected number of secondary cases arising from a primary case in a wholly susceptible population. In the case of multi-host pathogens, the definition is less clear, but an extension was provided by Diekmann et al. (Reference Diekmann, Heesterbeek and Metz1990). This takes the form of a next-generation matrix that describes the growth of multiple types of infecteds (as there is more than one type of host) where the dominant eigenvalue of this matrix gives an R 0 with the same properties and a similar interpretation as in the single-host species case. Quantifying R 0 for a particular pathogen or parasite has long been a preoccupation of epidemiologists, and reasonably so since the value of R 0 quantifies the control effort required to end an epidemic (Anderson and May, Reference Anderson and May1991). An additional reason, though, is that the biological parameters to which R 0 is sensitive provide hypotheses about what factors determine the distribution of a pathogen since if R 0 is less than 1, then the parasite will be absent or only sporadically present via introductions, and if R 0 is greater than 1 then epidemics are possible.
In this paper we use the next-generation matrix approach to construct mechanistic models for R 0 for West and East African sleeping sickness. We note here that this is not so very different from building a compartment model such as the one presented by Rogers (Reference Rogers1988), but a next-generation matrix does not capture the dynamics beyond initial spread whereas a compartment model does. The advantages of the next-generation matrix are (i) the focus on R 0 and (ii) the theory that has developed from the work of Diekmann et al. (Reference Diekmann, Heesterbeek and Metz1990). The latter gives us confidence to interpret the magnitude of R 0 values in the same way that we interpret R 0 values for single-host pathogens and we can readily consider control effort, even if it is directed at a single host species (Roberts and Heesterbeek, Reference Roberts and Heesterbeek2003). We use the models to perform global sensitivity analyses for R 0. An outcome of such analyses are hypotheses for which factors most likely explain the focal distribution of West African sleeping sickness. These results could be particularly relevant with the current progress towards an Atlas of human African trypanosomiasis (Checchi et al. 2009) representing an increasingly clear picture of the geographical distribution of sleeping sickness. This approach also complements the drive to model the distributions of both tsetse and sleeping sickness using variables derived from satellite imagery (Rogers and Randolph, Reference Rogers and Randolph1991).
We have restricted our attention to sleeping sickness in Uganda for 2 primary reasons. Taking the whole of Africa, there is a dizzying number of Glossina species able to carry Trypanosoma parasites, and an equally daunting variation in climate, seasonality and ecology. In addition, Uganda is the only country in Africa to have both forms of sleeping sickness. For Uganda, and elsewhere in Africa, there are several available and proposed means of trypanosomiasis control ranging from low technology solutions to ambitious attempts at eradication of tsetse based on rearing and releasing sterile male flies. Examples of control methods include trypanocidal drugs for livestock, screening and treatment of human cases (for T. b. gambiense), tsetse population control by trapping, and the possible paratransgenesis of tsetse (Rio et al. Reference Rio, Hu and Aksoy2004). Finally, we use the sensitivity of R 0 to various biological parameters in order to comment on the likely efficacy of control methods that target these parameters.
MATERIALS AND METHODS
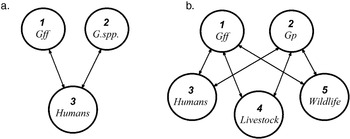
A next-generation matrix model begins by first defining a set of host types to give the model its structure. These types are referred to as types at infection (Matser et al. Reference Matser, Hartemink, Heesterbeek, Galvani and Davis2009) because it is the state of the host at the time of infection that is the basis for dividing the population of hosts into epidemiologically distinct groups. The state can be something like age or size of the host at infection (e.g. Hartemink et al. Reference Hartemink, Randolph, Davis and Heesterbeek2008) or it can be the species of the host. In this paper, the types at infection correspond to species (see Fig. 1). We include up to 2 host types to represent the tsetse fly population in Uganda; Glossina fuscipes fuscipes and another host type for either Glossina morsitans or Glossina pallidipes or a mixture of these. There are parts of Uganda where all 3 species are expected to be found, although more often it is just 2 or even 1 species. For example, during an investigation by Waiswa et al. (Reference Waiswa, Picozzi, Katunguka-Rwakishaya, Olaho-Mukani, Musoke and Welburn2006) in southeastern Uganda G. morsitans was not trapped at all in 2 of the districts visited and G. pallidipes was only rarely seen at a third district (2 of 660 flies).
The infection graphs for transmission of Trypanosoma b. gambiense (a) and T. b. rhodesiense (b) in Uganda. Each of the directed arcs between host-types represent transmission from tsetse vectors to vertebrate hosts, or vice versa. Each directed arc has a corresponding non-zero entry in the relevant next-generation matrix, K g or K r (see text).

T. b. gambiense is thought to be a disease of humans in the sense that only humans become infectious. There is little evidence for a role of animals in the maintenance of T. b. gambiense, though there remains some uncertainty (Fèvre et al. Reference Fèvre, Picozzi, Jannin, Welburn and Maudlin2006a). The strongest evidence that animals play no role is that the disease can be eliminated by early detection and treatment of human cases (Pepin and Meda, Reference Pepin and Meda2001). This alone does not imply that human hosts are required for transmission, but it does imply that if transmission occurs among domestic animals or wildlife it is not enough to maintain the parasite. In the case of T. b. rhodesiense, the opposite is true. For T. b. rhodesiense we have reduced the wide range of vertebrate host types found to carry the parasites to just 3 groups – humans, livestock and wildlife. This separation reflects the present situation in Uganda where livestock are often affected by animal trypanosomiasis and are regularly treated with trypanocides. Trypanocides also cure the animals of infection with T. b. rhodesiense as is reflected in the model by a short average infectious period for this host type. Finer resolution of the vertebrate host groups is possible through including host types to represent reptiles and suidae which have been identified as important sources of bloodmeals (Waiswa et al. Reference Waiswa, Picozzi, Katunguka-Rwakishaya, Olaho-Mukani, Musoke and Welburn2006). However, there were insufficient data in the literature to justify a larger number of host types as being epidemiologically distinct. Nonetheless, we emphasize the ease with which further host types representing either the presence of additional Glossina species or of vertebrate hosts can be added or removed from a next-generation matrix model if data are available. We also note that an additional host type would be justified if one was interested in control measures that would only apply to that host type. In this case one could estimate the type reproduction number introduced by Roberts and Heesterbeek (Reference Roberts and Heesterbeek2003) to estimate the required control effort.
A next-generation matrix for West African sleeping sickness
The transmission of T. b. gambiense between the 3 host-types pictured in Fig. 1a is captured by the following next-generation matrix in which host type 1 is G. f. fuscipes, host type 2 is either G. morsitans or G. pallidipes or a mixed population of both species and humans are host type 3;

Note that each non-zero element of the matrix corresponds to a directed arc in the transmission graph (Fig. 1a) and that k ij should be read as the average number of cases of host type i caused by a single host of type j. The elements k 31 and k 32 in the final row quantify transmission from tsetse to humans whereas the final column, consisting of k 13 and k 23 quantifies transmission from humans to flies. The latter is the number of flies that take an infected human bloodmeal, are susceptible to infection with trypanosomes and survive the extrinsic incubation period. The extrinsic incubation period is the period required for the trypanosomes to establish in the midgut and complete their life cycle in the salivary glands. The mean number of humans infected by such a fly is a product of the average number of bloodmeals taken while infectious and the likelihood that a bloodmeal is taken from a human. If μ is the survival rate of tsetse between bloodmeals (usually 2–4 days), and this is independent of age or infection state, then the number of bloodmeals taken before death follows the geometric distribution, with mean μ/(1−μ).
For humans infected with T. b. gambiense, Ravel et al. (Reference Ravel, Patrel, Koffi, Jamonneau and Cuny2006) suggested that a typical bloodmeal taken by a tsetse fly will always contain a number of parasites sufficient for infection. This seems unlikely for a chronic disease. One might expect periods of very low parasitaemia during which the host would not be infectious. However, there is no evidence for this in the literature and, interestingly, xenodiagnosis with teneral tsetse flies is still the most sensitive technique to take up trypanosomes from a host (Philippe Büscher, personal communication). We have assumed then that infected humans are infectious throughout the infectious period until death.
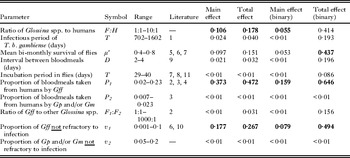
For a tsetse to become infectious, it must be susceptible such that the parasite will infect the midgut and go on to colonize the salivary glands. Our model assumes that only teneral flies have the potential to be susceptible (Welburn and Maudlin, Reference Welburn and Maudlin1999), and that of those teneral flies only a small fraction is actually susceptible. The expressions for the non-zero elements of K g are listed in Appendix A, reflecting the processes of infection from tsetse to humans and from humans to tsetse. The biological parameters that appear in those expressions are listed in Table 1, along with the intervals used for those parameters in the global sensitivity analyses. The relatively simple structure of the matrix (tsetse only infect humans, and humans only infect tsetse) means there is a simple analytic expression for the dominant eigenvalue, and hence for R 0;

The parameters appearing in the Trypanosoma b. gambiense model, the ranges used in the global sensitivity analysis and the results given as Sobol's main and total indices (see text)

A next-generation matrix for East African sleeping sickness
In the part of Uganda where East African sleeping sickness appears to be endemic, only 2 Glossina species are likely to be present, G. f. fuscipes and G. pallidipes. G. f. fuscipes is currently the problematic vector for sleeping sickness throughout Uganda; it is difficult to control using traditional means of tsetse control such as trapping, it may preferentially take bloodmeals from humans and it is a riverine species that tends to share the same habitat as humans. In contrast, G. pallidipes has been reported to be rarely trapped in districts with recent cases of East African sleeping sickness (Waiswa et al. Reference Waiswa, Picozzi, Katunguka-Rwakishaya, Olaho-Mukani, Musoke and Welburn2006) incriminating G. f. fuscipes as the one and only vector. We have retained G. pallidipes in the model for T. b. rhodesiense though because of the zoonotic nature of East African sleeping sickness and because there are fears that G. pallidipes is gradually re-establishing in Uganda (Waiswa et al. Reference Waiswa, Picozzi, Katunguka-Rwakishaya, Olaho-Mukani, Musoke and Welburn2006). The lists of vertebrate hosts that these tsetse species feed on (as indicated from bloodmeal analyses) are long (Clausen et al. Reference Clausen, Adeyemi, Bauer, Breloeer, Salchow and Staak1998; Waiswa et al. Reference Waiswa, Picozzi, Katunguka-Rwakishaya, Olaho-Mukani, Musoke and Welburn2006) but, as previously argued, we reduce the large number of vertebrates species involved to humans, livestock and wildlife.
The transmission of T. b. rhodesiense between the 5 host-types in Fig. 1b is captured by the following next-generation matrix;

The elements in the first 2 columns represent transmission from tsetse to humans or animals and those in the first 2 rows account for transmission from vertebrate hosts to tsetse. The processes are identical to that described above for transmission of T. b. gambiense from flies to humans, with infectious flies guaranteed to infect their hosts when a bloodmeal is taken and with only a fraction of teneral flies being susceptible. The expressions for the non-zero elements of K r are listed in Appendix A.
Sensitivity analyses
To calculate the sensitivity of R 0 to a model parameter p, the question is asked how much does R 0 vary in response to change in p around some value p=p c while all other parameters are fixed. This approach is known as local sensitivity analysis. The derivatives ∂R 0/∂p are evaluated at a particular point in parameter space. Thus, the measures reflect local properties of the model around that particular point. Saltelli et al. (Reference Saltelli, Tarantola, Campolongo and Ratto2004) have argued that global sensitivity analysis is a significant improvement on local sensitivity analysis. It requires that each parameter of the model be described in terms of a distribution that reflects the uncertainty or natural variation in that parameter. Such approaches are certainly not new to epidemiologists (Sanchez and Blower, Reference Sanchez and Blower1997; Gubbins et al. Reference Gubbins, Carpenter, Bayliss, Wood and Mellor2008), but local measures of sensitivity are perhaps the more common approach. The defining of parameter ranges, or distributions, enables a Monte Carlo experiment to generate a sample matrix (samples of the parameter space obtained by sampling independently from the parameter distributions). For our analysis of the 2 next-generation models we specify only a range for each parameter, i.e. we assume a uniform distribution based on a minimum and a maximum value. We used the R package {sensitivity} (http://cran.r-project.org/) and the Monte Carlo estimation scheme of Saltelli (Reference Saltelli2002) to calculate Sobol's main and total indices.
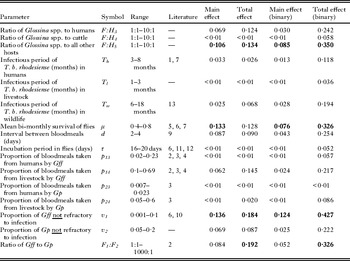
The results of global sensitivity analysis are 2 measures of the sensitivity of R 0 for each parameter. These are the main effect and the total effect. The main effect of parameter p (also known as the first order effect, or top-marginal variance) is the average reduction in the variance of model output if p is fixed to p c, where the average is taken over p c. The interpretation is that the higher the average reduction the more important p is in determining the model output of interest. The total effect of parameter p, which is also known as bottom-marginal variance, is the sum of the main effect and interaction effects between parameter p and all other parameters. If there is no interaction (e.g. if the model is completely linear) then the main and total effects will be identical. The interpretation of total effect is the same as the main effect; the higher the value the more important is the parameter. In Tables 1 and 2, we list the parameters of the next-generation models for West and East African sleeping sickness respectively, specifying a range of values that is based on values obtained from the literature. To obtain narrow confidence intervals for the indices we ran the Monte Carlo scheme with 25 000 samples.
The parameters appearing in the Trypanosoma b. rhodesiense model, the ranges used in the global sensitivity analysis and the results given as Sobol's main and total indices (see text)

Parameterization
We separated out G. f. fuscipes as a distinct type at infection primarily because of the difference between the proportions of bloodmeals taken from humans by G. f. fuscipes and by other Glossina species. Other reasons are the strong differences in abundance and the low effectiveness of trapping and other conventional means of vector control. In Tables 1 and 2, the proportion of bloodmeals for G. f. fuscipes coming from primates (which for the most part means humans) ranges from only 0·02 to 0·23. The lower limit of this range was observed by Waiswa et al. (Reference Waiswa, Picozzi, Katunguka-Rwakishaya, Olaho-Mukani, Musoke and Welburn2006) in Kamuli, Uganda. The upper limit of this range was reported by Okoth and Kapaata (Reference Okoth and Kapaata1988) for the Busoga sleeping sickness focus in Uganda, who found that 16–23% of the flies had fed on humans. These results agree with those for a subset of G. f. fuscipes from the West Nile district of Uganda analysed by Clausen et al. (Reference Clausen, Adeyemi, Bauer, Breloeer, Salchow and Staak1998) who found that 25% of the bloodmeals came from primates. It seems equally clear from these analyses that only very low proportions of the bloodmeals of G. pallidipes and G. morsitans (the two other Glossina species of importance in Uganda) come from humans (Clausen et al. Reference Clausen, Adeyemi, Bauer, Breloeer, Salchow and Staak1998).
The survival of tsetse is a parameter in the model that determines the probability that a fly will survive to become infectious and the average number of bloodmeals an infectious fly will take. The survival of tsetse is presented in Tables 1 and 2 as a bi-monthly rate. The range of values for the survival rate translates to a range for the mean life span of between only 3 weeks (a bi-monthly survival rate of 0·4) and 10 weeks (a bi-monthly survival rate of 0·8). The life spans reported for tsetse are in fact not much longer than the incubation period in the fly. For T. brucei, the initial infection occurs in the midgut of the fly but subsequent colonization of the salivary glands and production of metacyclic forms must occur for the parasite to complete its life cycle and for the fly to become infectious. It is increasingly clear that infection and infectiousness in tsetse is an outcome of a complex interaction between the trypanosomes and the tsetse (Roditi and Lehane, Reference Roditi and Lehane2008). The incubation periods reported in the literature are variable (Dale et al. Reference Dale, Welburn, Maudlin and Milligan1995; Welburn and Maudlin, Reference Welburn and Maudlin1999) and defining a range for the mean incubation period is further complicated by the possibility that the subspecies of Trypanosoma brucei that infect and cause disease in humans have far longer maturation times in tsetse than T. b. brucei (Welburn et al. Reference Welburn, Maudlin and Milligan1995). This may even imply that infectivity to humans comes at the cost of loss of transmissibility (Welburn and Maudlin, Reference Welburn and Maudlin1999). We have represented this by using ranges for the incubation periods for T. b. rhodesiense and T. b. gambiense that imply that it is entirely possible for incubation periods to be longer than the mean life span. We have also used a wide range of values for the level of refractoriness to infection with trypanosomes (including T. brucei) among tsetse (Welburn and Maudlin, Reference Welburn and Maudlin1999) reflecting the highly variable results of laboratory studies.
RESULTS
The model output of most interest is the value of R 0. However, we also ran separate global sensitivity analyses when the model output was reduced to a binary variable – a value of 1 when R 0>1 and 0 otherwise. Mathematically, R 0 has a threshold behaviour at 1. This is the point at which, on average, an infectious host transmits the pathogen to more than 1 other host, which is a minimum requirement for an epidemic to occur and is always true for an endemic pathogen. Conversely, having an infectious host transmit the pathogen to less than 1 other host is a minimum condition for a control programme to succeed in either preventing an epidemic or eliminating the pathogen. Hence, the purpose of analysing the binary form of the model output is to confirm that the parameters that explain numerical variation in R 0 also explain when the model predicts it is possible for the pathogen to spread (i.e. when R 0>1). This result is potentially useful for control and management of sleeping sickness because R 0>1 is a requirement for persistence and leads to hypotheses about factors that might determine geographical distribution.
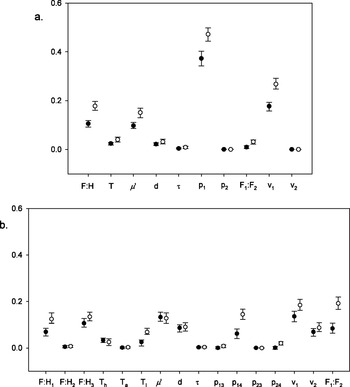
The results of global sensitivity analyses for the 2 pathogens are given in Tables 1 and 2, and are shown graphically in Fig. 2. The results are highly consistent and clear for West African sleeping sickness. With one exception, the same 3 parameters are ranked as highest either by main or total effect, using either the variation in R 0 or variation in the binary model output. For T. b. gambiense we can conclude that the proportion of tsetse bloodmeals taken from humans stands out as the most important parameter for determining presence and absence of the parasite, as well as numerical variation in R 0. Note that the proportion of bloodmeals from humans is not equivalent to either the number of feeds taken on humans, or the biting rate of tsetse because tsetse take bloodmeals from a wide range of hosts. The probability that a tsetse fly would take 2 or more bloodmeals from humans over its life span is determined by the proportion of bloodmeals taken from humans but is not necessarily related to the rate, or number, of feeds taken from humans. Consider that the number of bloodmeals from humans could be high, but if this is because very many tsetse flies are taking the occasional bloodmeal then the parasite (T. b. gambiense) would have few opportunities to complete its life cycle. In contrast, if the same number of bloodmeals from humans was due to just a few tsetse flies taking most of their bloodmeals from humans then the parasite would greatly benefit. The ratio of flies to humans and the fraction of flies refractory were also ranked consistently high for T. b. gambiense.
A plot of Sobol's indices (main and total effects) and their 95% confidence intervals for the biological parameters appearing in the 2 next-generation models for West African sleeping sickness (a) and East African sleeping sickness (b). The main effect of a parameter is the average reduction in variance if a parameter is fixed. The higher the value the more important the parameter is in determining variance and so the more sensitive the model is to that parameter. The total effect of a parameter is always higher than the main effect because it takes into account interactions with other parameters, but again, higher values indicate higher importance. See Tables 1 and 2 for parameter definitions and for the ranges of values used for each parameter. The model output of interest is R 0, the dominant eigenvalue of the next-generation matrix resulting from the Monte Carlo sample of parameter space. The tight confidence intervals reflect that the two models are relatively simple and high numbers of samples could be used in the estimation scheme of Saltelli (Reference Saltelli2002). The numerical values of the indices plotted here are given in Tables 1 and 2.

In the case of East African sleeping sickness the proportion of G. f. fuscipes not refractory to infection was consistently ranked highest by the sensitivity indices but tsetse population parameters – the monthly survival rate of tsetse and the ratio of tsetse flies to other hosts –also had index values almost as high and it is more difficult to draw strong conclusions. For the sensitivity analysis, we allowed the composition of the 2 tsetse species present in eastern Uganda (G. f. fuscipes and G. pallidipes) to vary from 1:1 to 1000:1. This parameter (the ratio of G. f. fuscipes to G. pallidipes) was sometimes ranked amongst the 3 parameters having the highest sensitivity values.
Summary statistics for the distributions of R 0 values generated by the large numbers of Monte Carlo samples of parameter space are given in Table 3. These results are interesting in themselves in terms of comparing the results of the modelling for T. b. gambiense and T. b. rhodesiense. For most of the parameter space defined by the intervals in Table 1, R 0 for T. b. gambiense was below 1 whereas the opposite was true for T. b. rhodesiense. T. b. rhodesiense also had higher variation.
Summary statistics for the distributions of R 0 values

Most parameters, or groups of parameters appear in both models. However, the measures of sensitivity differ markedly between the 2 models, reflecting the strong epidemiological differences between the 2 species of the parasite. A possible exception to this is tsetse survival which has moderate sensitivity values for both species. The sums of the main effects were 0·813 for T. b. gambiense and 0·777 for T. b. rhodesiense, indicating that the relationship between R 0 and the parameters is marginally more linear for T. b. gambiense than T. b. rhodesiense, since fewer interactions are required to explain the gap between the sum of main effects and 1.
DISCUSSION
We have presented next-generation matrices for both T. b. gambiense and T. b. rhodesiense, and global sensitivity analyses of these models using R 0 and a binary form of R 0 (a value of 1 if R 0 is greater than 1 and 0 otherwise) as the model outputs of interest. The global sensitivity analyses have suggested that the parameters most likely to explain the distribution of West African sleeping sickness are the proportion of bloodmeals taken from humans and, perhaps more intriguingly, the proportion of tsetse refractory to infection with the parasites. The importance of the proportion of bloodmeals taken from humans could be explained by transmission from vertebrate host to insect vector and back to vertebrate host representing completion of the parasite's life cycle. That is, for a loop of the infection graph to be completed (there are only 2 loops in the graph and both require this) a tsetse fly must take a first bloodmeal from a human (in order to become infected), and then another feed from a human to complete the chain of transmission. The probability of a tsetse fly taking 2 or more bloodmeals from humans is determined directly by the proportion of bloodmeals taken from humans. For East African sleeping sickness this is not highly relevant because humans are more of an accidental host than a reservoir. The most important parameters for East African sleeping sickness were instead the proportion of flies refractory, followed by population parameters determining the abundance, composition and life span of tsetse flies.
Global sensitivity analysis of a model for R 0 is an approach to sensitivity that is distinct from the perturbation methods used by Rogers (Reference Rogers1988) or the plots of the effective reproduction number used by Welburn et al. (Reference Welburn, Fèvre, Coleman, Odiit and Maudlin2001). Both of these approaches take fixed-point estimates of all parameters except the one of immediate interest and quantify the behaviour of the model around that point. Such methods inevitably measure the local behaviour of the model around a single point in parameter space. Global approaches avoid this pitfall (Saltelli, Reference Saltelli2002) and require at the very least that a range of values for each parameter be specified, which can be a useful exercise in its own right.
The application of the next-generation matrix method to sleeping sickness adds to a growing list of multi-host, vector-borne pathogens for which next-generation matrices have now been applied (Roberts and Heesterbeek, Reference Roberts and Heesterbeek2003; Hartemink et al. Reference Hartemink, Randolph, Davis and Heesterbeek2008; Matser et al. Reference Matser, Hartemink, Heesterbeek, Galvani and Davis2009). We point out though, that in the case of sleeping sickness the mechanics of transmission are simple enough for types at infection to be defined by host species. This means that a reproduction number for sleeping sickness can be obtained relatively easily, as was done by Rogers (Reference Rogers1988) who derived equations for the average number of infectious tsetse flies produced from 1 infected tsetse fly. This is not precisely the same as the R 0 given here – the expression from Rogers (Reference Rogers1988) does not average over all host types – but it is closely related (one need only take the square root) and has the desired threshold properties. This arguably more direct approach works because the parasite is obligated to complete its life cycle by transmitting from tsetse fly to vertebrate host and back again (Roberts and Heesterbeek, Reference Roberts and Heesterbeek2003). Further expressions for R 0 based on the work of Rogers (Reference Rogers1988) were proposed by Welburn and others (Welburn et al. Reference Welburn, Fèvre, Coleman, Odiit and Maudlin2001, Reference Welburn, Coleman, Maudlin, Fèvre, Odiit and Eisler2006) to compare the efficacy of chemoprophylaxis of domestic livestock, vector control and treatment of humans.
For sleeping sickness, then, a next-generation matrix is not strictly necessary to calculate an R 0, as it is for tick-borne diseases for example (Hartemink et al. Reference Hartemink, Randolph, Davis and Heesterbeek2008). R 0 values calculated from next-generation matrices do, however, have the property that regardless of the number of vector or host species they always have the same interpretation of per generation growth in infected, they are always calculated in the same way and they always gives values consistent with the single-host definition of R 0 (Diekmann and Heesterbeek, 2000). An added advantage is that the type reproduction number, which is a measure of the control effort required to eliminate a pathogen when a single host species is targeted by the control, quickly follows (Roberts and Heesterbeek, Reference Roberts and Heesterbeek2003), as do the elasticity and sensitivity matrices (Matser et al. Reference Matser, Hartemink, Heesterbeek, Galvani and Davis2009). In the case of sleeping sickness, an elasticity matrix would indicate (simply by summing its rows or columns) the contributions to R 0 from each Glossina species and for each vertebrate host type. This approach may be attractive if, for example, there is strong interest in quantifying the role of a particular host type because it is of growing importance in agriculture, or a tsetse vector species that is reinvading a region.
The use of global sensitivity indices is a relatively novel approach for models of infectious disease and we would always argue that using the literature to determine a range of values for a parameter is more appropriate than attempting to arrive at single point values. However, one limitation is that the range of values represents 2 types of variation; uncertainty about the parameter due to little or no information available and natural geographical variation arising from real differences in host and vector populations, climate, or the parasite strain. Ideally, one would like to separate these two types of variation, particularly when asking which parameters might be important for predicting the geographical distributions of a pathogen.
Care must be taken too when interpreting Sobol's indices, or interpreting rankings of biological parameters based on these indices, to comment on the likely efficacy of control methods that target different biological parameters. For example, we note that the main and total effects of the infectious period of humans are, in the case of West African sleeping sickness rather low. Yet early detection and treatment of West African sleeping sickness, which targets this parameter, came close to eliminating the disease during the decades that these programmes ran. A dramatic reduction in the infectious period in the single vertebrate host population, to values outside the range of values considered in the global analysis, would logically have a large impact on R 0. However, Sobol's indices do not reflect this. Hence, low values of Sobol's indices hence do not necessarily imply that a control strategy that targets that parameter should be dismissed because so much depends on the ease with which change to a parameter can be affected. In the case of early detection and treatment of West African sleeping sickness, there are also immediate benefits to patients and the wider community, which are quite separate from the prevention of future transmission.
The R 0 values for T. b. gambiense and T. b. rhodesiense indicate that T. b. gambiense is expected to spread for only a very small part of the parameter space, whereas for T. b. rhodesiense, the median value of R 0 is greater than 1. This result somewhat contradicts the magnitude of the public health problem posed by T. b. gambiense in comparison to the public health problem posed by T. b. rhodesiense, as 90% of sleeping sickness cases reported are caused by T. b. gambiense. The model may underestimate the amount of transmission between hosts and vectors for T. b. gambiense, or overestimate this for T. b. rhodesiense. The treatment of livestock with trypanocidal drugs, which is incorporated into the model for T. b. rhodesiense, is likely an important part of controlling East African sleeping sickness (Welburn et al. Reference Welburn, Coleman, Maudlin, Fèvre, Odiit and Eisler2006; Fèvre et al. Reference Fèvre, Tilley, Picozzi, Fyfe, Anderson, Magona, Shaw, Eisler and Welburn2006b). However, we note too that humans, wildlife and livestock are not as mixed as the model assumes. That is, the opportunities for tsetse flies to take feeds from both wildlife and humans may be relatively rare in present day Uganda, which would also explain why human cases of East African sleeping sickness are less common than our results might suggest.
Recent experimental work has shown that starvation (nutritional stress) affects the susceptibility of tsetse flies to trypanosome infection (Kubi et al. 2006), and this is true for teneral and non-teneral flies (Akoda et al. Reference Akoda, Van den Bossche, Lyaruu, De Deken, Marcotty, Coosemans and Van den Abbeele2009a), as well as for the offspring of nutritionally stressed female tsetse (Akoda et al. Reference Akoda, Van den Abbeele, Marcotty, De Deken, Sidibe and Van den Bossche2009b). The results of the global sensitivity analysis effectively underline the possible implications of these findings for the epidemiology of human Trypanosomiasis, because the susceptibility of tsetse was consistently identified as an important factor for R 0. That is, periods of nutritional stress that increase susceptibility of flies above what is normally reported would be predicted to have a large effect on R 0. These same results also give broad support for control strategies aimed at further increasing refractoriness in flies (Durvasula et al. Reference Durvasula, Gumbs, Panackal, Kruglov, Aksoy, Merrifield, Richards and Beard1997; Rio et al. Reference Rio, Hu and Aksoy2004), suggesting that changes to this parameter may in fact be enough to bring R 0 below 1. Although such methods may be a long way from being applied in the field, they are attractive to consider because the statement applies to both East and West African sleeping sickness. Finally, we note that flies carrying mature infections (infective to humans) have been found to have reduced survival such that infectivity to humans comes at a high cost to the parasite (Welburn and Maudlin, Reference Welburn and Maudlin1999). Such a relationship between infectivity and maturation exacerbates the already narrow window of infectiousness that is a weakness in the transmission cycle. This may explain the moderate sensitivity values in the model results for mean survival of tsetse. These results suggest that sustained tsetse control (that lowers the mean survival of flies over a period of years) should have strong effects on sleeping sickness. Lowering the mean survival narrows the window of opportunity for infectious flies and decreases the likelihood that a fly will live long enough to become infectious at all. It also does not require that tsetse be eliminated altogether, effectively sidestepping the problems associated with achieving eradication.
ACKNOWLEDGEMENTS
We wish to thank David Rogers for very helpful comments on the manuscript. We would also like to particularly thank Ouma Johnson, Philippe Büscher, Dieter Mehlitz and Peter Van den Bossche for their valuable advice concerning the biology of tsetse flies and the transmission of T. brucei.
FINANCIAL SUPPORT
This work was supported by NIH award AI068932 given to S.A., and S.D. was supported by the Miriam Burnett Trust.
APPENDIX A. EQUATIONS FOR THE ELEMENTS OF K g AND K r
For the next-generation matrix for West African sleeping sickness, infection with T. b. gambiense (K g) we have the following equations for the production of infectious tsetse:


The fraction (1−μ)d/(μ+(1−μ)d) represents the proportion of a tsetse population that is teneral. This is based on the assumption that the total number of tsetse is constant. All parameter symbols are given in Tables 1 and 2 in the main text. For the production of human infections we use the following equations:
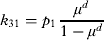

The fraction μ d/(1−μ d) represents the expected number of bloodmeals taken by an infectious tsetse fly, given the daily survival rate μ.
For the next-generation matrix for East African sleeping sickness, infection with T. b. rhodesiense (K r), the production of infectious tsetse can be expressed as:


For the production of animal and human infections we use the following equations: