



1 Introduction
Variable-density turbulent flow responding to an externally imposed acceleration field, such as gravity, is encountered in many contexts, such as inertial confinement fusion, geophysics, astrophysics, compressible turbulence and combustion. In the present study, of interest is the flow dynamics resulting from the body force
 $\unicode[STIX]{x1D70C}\boldsymbol{g}$
, where
 $\unicode[STIX]{x1D70C}$
is the density of the fluid and
 $\boldsymbol{g}$
the imposed acceleration field. The action of the body force generates complex multi-scale dynamics. For instance, in a uniform gravitational field, density stratification results in waves, instabilities and modification of turbulence by stable density stratification or buoyant convection (e.g. Turner Reference Turner1979).
In many applications, the flow can be treated as incompressible with only small density variations,
 $\unicode[STIX]{x1D70C}^{\prime }/\unicode[STIX]{x1D70C}\ll 1$
, and the Boussinesq approximation can adequately describe the flow physics (Gerz, Schumann & Elghobashi Reference Gerz, Schumann and Elghobashi1989; Métais & Herring Reference Métais and Herring1989; Batchelor, Canuto & Chasnov Reference Batchelor, Canuto and Chasnov1992; Holt, Koseff & Ferziger Reference Holt, Koseff and Ferziger1992; Gerz & Yamazaki Reference Gerz and Yamazaki1993; Jacobitz, Sakar & Van Atta Reference Jacobitz, Sakar and Van Atta1997; Staquet & Godeferd Reference Staquet and Godeferd1998; Shih et al.
Reference Shih, Koseff, Ferziger and Rehmann2000; Riley & deBruynKops Reference Riley and deBruynKops2003; Diamessis & Nomura Reference Diamessis and Nomura2004; Chung & Matheou Reference Chung and Matheou2012). Boussinesq flows can capture the effects of stratification in decaying turbulence (Métais & Herring Reference Métais and Herring1989; Staquet & Godeferd Reference Staquet and Godeferd1998; Riley & deBruynKops Reference Riley and deBruynKops2003), with some studies of unstable stratification, e.g. buoyancy-driven flows of a fluctuating density field (Batchelor et al.
Reference Batchelor, Canuto and Chasnov1992) or stable stratification if a different mechanism, e.g. shear (Gerz et al.
Reference Gerz, Schumann and Elghobashi1989; Holt et al.
Reference Holt, Koseff and Ferziger1992; Jacobitz et al.
Reference Jacobitz, Sakar and Van Atta1997; Shih et al.
Reference Shih, Koseff, Ferziger and Rehmann2000; Diamessis & Nomura Reference Diamessis and Nomura2004; Chung & Matheou Reference Chung and Matheou2012), drives the flow. Such flows tend to be nearly barotropic, with mean pressure gradients typically in the direction of, or opposite to, mean density gradients.
Misalignments of pressure and density gradients generate baroclinic torques that can significantly influence the flow dynamics and may be important to include in large-eddy simulation (LES) modelling of high-Reynolds-number turbulent flows. The Boussinesq linearization retains density variations only in accounting for body force in the momentum equation (e.g. Batchelor et al. Reference Batchelor, Canuto and Chasnov1992), with non-hydrostatic baroclinic torques in the vorticity equation ignored.
The goal of the present study is to investigate turbulence in a variable-density flow dominated by baroclinic torques. A flow configuration is considered in which two different gas-phase fluids and an externally imposed vertical acceleration field result in initially perpendicular pressure and density gradients. A mean perpendicular density–pressure gradient is maintained as the flow evolves while multi-scale baroclinic torques are generated in the turbulent shear-layer flow that ensues.
The present flow is inspired by flow visualization of a laboratory demonstration by Robert Breidenthal in the late 1970s at Caltech (unpublished). The flow was a baroclinically generated shear layer formed between vertically oriented streams of water solutions, whose densities were close, i.e.
 $\unicode[STIX]{x0394}\unicode[STIX]{x1D70C}/\unicode[STIX]{x1D70C}\ll 1$
, with
 $\unicode[STIX]{x0394}\unicode[STIX]{x1D70C}=\unicode[STIX]{x1D70C}_{1}-\unicode[STIX]{x1D70C}_{2}$
. A recent analysis of this flow indicates a velocity difference across such a shear layer (circulation per unit shear-layer length) that is linearly increasing in time. This is as opposed to a Kelvin–Helmholtz layer, for example, whose velocity difference is constant.
The present study extends the aforementioned baroclinically generated shear layer of water solutions to higher density ratios, renders it in a periodic domain, and employs a direct numerical simulation (DNS) approach. Specifically, simulations with varying free-stream density ratios in the range
 $1.05\leqslant R\equiv \unicode[STIX]{x1D70C}_{1}/\unicode[STIX]{x1D70C}_{2}\leqslant 10$
are performed. By way of example, flow with a density ratio of
 $R=10$
corresponds to turbulent mixing of argon (Ar) and helium (He). The low-Mach-number approximation of the full equations of motion is used to study this flow whose density ratios place it outside the validity of the Boussinesq approximation. For low density ratios, i.e.
 $R=1+\unicode[STIX]{x1D700}$
, the flow limits to the Boussinesq approximation for small
 $\unicode[STIX]{x1D700}$
. The limiting behaviour was investigated and confirmed in a separate study that investigated yet lower density ratios, down to
 $R=1.02$
, 1.01 and 1.005 (Gat et al.
Reference Gat, Matheou, Chung and Dimotakis2016).
The present flow exhibits common attributes with other fundamental variable-density (non-Boussinesq) flow configurations, such as three-dimensional Rayleigh–Taylor instability simulations (e.g. Rayleigh Reference Rayleigh1882; Taylor Reference Taylor1950; Anuchina et al. Reference Anuchina, Kucherenko, Neuvazhaev, Ogibina, Shibarshov and Yakovlev1978; Read Reference Read1984; Youngs Reference Youngs1984, Reference Youngs1989; Cook & Dimotakis Reference Cook and Dimotakis2001, and others) and variable-density buoyancy-generated turbulence (Sandoval Reference Sandoval1995, and studies mentioned therein) and later studies (e.g. Livescu & Ristorcelli Reference Livescu and Ristorcelli2007, Reference Livescu and Ristorcelli2008; Livescu et al. Reference Livescu, Ristorcelli, Gore, Dean, Cabot and Cook2009; Chung & Pullin Reference Chung and Pullin2010) that further expanded on the work of Sandoval (Reference Sandoval1995). In the present configuration, the turbulent mixing region grows in the horizontal direction, i.e. perpendicular to the vertical acceleration, whereas in Rayleigh–Taylor-type flows, the mixed-fluid region grows in the vertical direction, i.e. parallel to the acceleration direction. In addition, the present simulations correspond to temporally evolving mixed-fluid regions between two pure-fluid accelerating (free) streams, in contrast to spatially homogeneous buoyancy-generated turbulent flows (e.g. Livescu & Ristorcelli Reference Livescu and Ristorcelli2007, Reference Livescu and Ristorcelli2008; Chung & Pullin Reference Chung and Pullin2010).
This flow exhibits similarities to buoyancy-generated turbulent flows as well as similarities to classical spatially developing shear layers (e.g. Brown & Roshko Reference Brown and Roshko1974, Reference Brown and Roshko2012; Bradshaw Reference Bradshaw1977; Ho & Huerre Reference Ho and Huerre1984; Dimotakis Reference Dimotakis2005, and references therein). In the present flow, however, the vertically accelerating free streams develop temporally growing shear layers. In many experiments on buoyancy-driven free-stream acceleration (e.g. Thorpe Reference Thorpe1968, Reference Thorpe1978; Pawlak & Armi Reference Pawlak and Armi1998), gravity is inclined with respect to the free-stream flow direction, whereas acceleration is parallel to the free-stream flow direction in the present study.
Similar to Livescu & Ristorcelli (Reference Livescu and Ristorcelli2007) and Chung & Pullin (Reference Chung and Pullin2010), the present flow is triply periodic. The lack of solid boundaries introduces a degree of freedom and non-uniqueness (Livescu & Ristorcelli Reference Livescu and Ristorcelli2007) that requires specification of the mean-pressure gradient in place of a far-field boundary condition. The mean-pressure gradient sets the flow reference frame (see § 2.2). A zero-mean-momentum reference frame is chosen that also facilitates force accounting.
The flow configuration, governing equations and numerical solution method are discussed in § 2. The flow parameters are introduced in § 3 followed by analyses of the flow evolution and turbulence, including mixing and spectra, in §§ 4 and 5. In § 6, the discussion notes that some attributes of variable-density flows can be mapped to those for uniform-density flows, such as spectral scaling for all density ratios,
 $R$
, extending to the limit of
 $R=1+\unicode[STIX]{x1D700}$
, as
 $\unicode[STIX]{x1D700}\rightarrow 0$
. Further details regarding the numerical method, quality of the simulations and sensitivity to the initial conditions are documented in appendices A and B.
2 Problem formulation
2.1 Governing equations
Absent species sources and sinks, the mass, momentum and species mass-fraction conservation equations for flow subject to an externally imposed acceleration field, such as gravity, are
 $$\begin{eqnarray}\displaystyle \frac{\unicode[STIX]{x2202}\unicode[STIX]{x1D70C}}{\unicode[STIX]{x2202}t}+\unicode[STIX]{x1D735}\boldsymbol{\cdot }(\unicode[STIX]{x1D70C}\boldsymbol{u}) & = & \displaystyle 0,\end{eqnarray}$$
 $$\begin{eqnarray}\displaystyle \frac{\unicode[STIX]{x2202}\unicode[STIX]{x1D70C}\boldsymbol{u}}{\unicode[STIX]{x2202}t}+\unicode[STIX]{x1D735}\boldsymbol{\cdot }(\unicode[STIX]{x1D70C}\boldsymbol{u}\boldsymbol{u}) & = & \displaystyle -(\unicode[STIX]{x1D71E}+\unicode[STIX]{x1D735}p)-\widehat{\boldsymbol{z}}\,\unicode[STIX]{x1D70C}g+\unicode[STIX]{x1D735}\boldsymbol{\cdot }\unicode[STIX]{x1D749},\end{eqnarray}$$
 $$\begin{eqnarray}\displaystyle \frac{\unicode[STIX]{x2202}\unicode[STIX]{x1D70C}Y_{\unicode[STIX]{x1D6FC}}}{\unicode[STIX]{x2202}t}+\unicode[STIX]{x1D735}\boldsymbol{\cdot }[\unicode[STIX]{x1D70C}Y_{\unicode[STIX]{x1D6FC}}(\boldsymbol{u}+\boldsymbol{v}_{\unicode[STIX]{x1D6FC}})] & = & \displaystyle 0.\end{eqnarray}$$
In these equations,
 $\unicode[STIX]{x1D70C}$
is the density of the mixture,
 $\boldsymbol{u}$
is the velocity vector,
 $p$
is the pressure,
 $\unicode[STIX]{x1D71E}(t)$
is the spatially uniform component of the pressure gradient,
 $g$
is the magnitude of the acceleration in the
 $-\widehat{\boldsymbol{z}}$
direction,
 $Y_{\unicode[STIX]{x1D6FC}}$
is the
 $\unicode[STIX]{x1D6FC}$
-species mass fraction and
 $\boldsymbol{v}_{\unicode[STIX]{x1D6FC}}$
is the
 $\unicode[STIX]{x1D6FC}$
-species diffusion velocity (e.g. Dimotakis Reference Dimotakis2005). A Newtonian viscous stress tensor and monatomic gases, i.e. zero bulk viscosity (Hirschfelder, Curtiss & Bird Reference Hirschfelder, Curtiss and Bird1964) are assumed,
 $$\begin{eqnarray}\unicode[STIX]{x1D749}=\unicode[STIX]{x1D707}\left[\unicode[STIX]{x1D735}\boldsymbol{u}+(\unicode[STIX]{x1D735}\boldsymbol{u})^{\text{T}}-{\textstyle \frac{2}{3}}(\unicode[STIX]{x1D735}\boldsymbol{\cdot }\boldsymbol{u})\unicode[STIX]{x1D644}\right],\end{eqnarray}$$
where
 $\unicode[STIX]{x1D644}$
is the identity matrix.
The equation of state assumed for the binary mixture of fluids with density
 $\unicode[STIX]{x1D70C}_{1}$
and
 $\unicode[STIX]{x1D70C}_{2}$
, with
 $\unicode[STIX]{x1D70C}_{1}>\unicode[STIX]{x1D70C}_{2}$
(Sandoval Reference Sandoval1995), is
 $$\begin{eqnarray}\frac{1}{\unicode[STIX]{x1D70C}(\boldsymbol{x},t)}=\frac{Y(\boldsymbol{x},t)}{\unicode[STIX]{x1D70C}_{1}}+\frac{1-Y(\boldsymbol{x},t)}{\unicode[STIX]{x1D70C}_{2}}=\frac{1}{\unicode[STIX]{x1D70C}_{2}}-Y(\boldsymbol{x},t)\left(\frac{1}{\unicode[STIX]{x1D70C}_{2}}-\frac{1}{\unicode[STIX]{x1D70C}_{1}}\right),\end{eqnarray}$$
with the mass fraction,
 $Y(\boldsymbol{x},t)\equiv Y_{1}(\boldsymbol{x},t)=1-Y_{2}(\boldsymbol{x},t)$
. In the zero-Mach-number limit (incompressible flow) studied here, temperature is uniform (and infinite), decoupling the energy equation.
The species diffusion velocity (2.1c ) is dominated by Fickian transport i.e.
 $$\begin{eqnarray}\unicode[STIX]{x1D70C}Y\boldsymbol{v}=-\unicode[STIX]{x1D70C}{\mathcal{D}}\unicode[STIX]{x1D735}Y,\end{eqnarray}$$
where
 $\boldsymbol{v}\equiv \boldsymbol{v}_{1}$
and
 $Y\boldsymbol{v}=Y_{1}\boldsymbol{v}_{1}=-Y_{2}\boldsymbol{v}_{2}$
for a binary mixture. Combining the conservation equations for mass and species mass fraction yields the density evolution equation,
 $$\begin{eqnarray}\frac{\text{D}\unicode[STIX]{x1D70C}}{\text{D}t}=\frac{\unicode[STIX]{x2202}\unicode[STIX]{x1D70C}}{\unicode[STIX]{x2202}t}+\boldsymbol{u}\,\boldsymbol{\cdot }\,\unicode[STIX]{x1D735}\unicode[STIX]{x1D70C}=-\unicode[STIX]{x1D70C}\unicode[STIX]{x1D735}\boldsymbol{\cdot }\boldsymbol{u}=\unicode[STIX]{x1D70C}\unicode[STIX]{x1D735}\boldsymbol{\cdot }\left(\frac{{\mathcal{D}}}{\unicode[STIX]{x1D70C}}\unicode[STIX]{x1D735}\unicode[STIX]{x1D70C}\right),\end{eqnarray}$$
i.e. variable-density flow is not divergence free in the presence of diffusion, even in the zero-Mach-number limit (e.g. Sandoval Reference Sandoval1995; Cook & Dimotakis Reference Cook and Dimotakis2001; Livescu Reference Livescu2013).
The simulations assume gas-phase molecular diffusion, i.e. a unity Schmidt number,
 $\mathit{Sc}\approx 1$
, where
 $\mathit{Sc}\equiv (\unicode[STIX]{x1D707}/\unicode[STIX]{x1D70C})/{\mathcal{D}}$
is the ratio of the viscous to the species diffusivity. In considering a mixture of two gases, treated here as ideal, each would be characterized by its own density, e.g.
 $\unicode[STIX]{x1D70C}_{1}$
and
 $\unicode[STIX]{x1D70C}_{2}$
, with the mixed-fluid density,
 $\unicode[STIX]{x1D70C}(X)$
, a function of the mixture mole fraction,
 $X=[\unicode[STIX]{x1D70C}(X)-\unicode[STIX]{x1D70C}_{2}]/[\unicode[STIX]{x1D70C}_{1}-\unicode[STIX]{x1D70C}_{2}]$
. Similarly, while dynamic viscosity would be a function of temperature in each of the two pure fluids, there would be a temperature-dependent dynamic viscosity that would be a function of mixture composition and temperature, i.e.
 $\unicode[STIX]{x1D707}(X,T)$
. The model for the simulations performed adopts the simplifying assumption that
 $\unicode[STIX]{x1D707}(X,T)=\unicode[STIX]{x1D707}$
is uniform and constant in the flow. A unity Schmidt number then yields a variable diffusion coefficient, i.e.
 ${\mathcal{D}}(\boldsymbol{x},t)=\unicode[STIX]{x1D707}/\unicode[STIX]{x1D70C}(\boldsymbol{x},t)$
.
2.2 Flow reference frame
The simulated flow is in a triply periodic cube of volume
 $L^{3}$
with an imposed vertical acceleration field. In this set-up, the pressure gradient can be solved up to a constant (in space),
 $\unicode[STIX]{x1D71E}(t)$
in (2.1b
) (Livescu & Ristorcelli Reference Livescu and Ristorcelli2007). The simulations exploit this degree of freedom to select the frame of reference. Some authors chose
 $\unicode[STIX]{x1D71E}(t)$
to render the flow maximally unstable (Livescu & Ristorcelli Reference Livescu and Ristorcelli2007), or to ensure a constant mean velocity (Chung & Pullin Reference Chung and Pullin2010). In the simulations presented here, a different approach is chosen.
To help track forces acting on the flow,
 $\unicode[STIX]{x1D71E}(t)$
is selected such that
 $\text{d}\!\left\langle \unicode[STIX]{x1D70C}\boldsymbol{u}\right\rangle \!/\text{d}t=0$
in the chosen frame, i.e. a constant volume-averaged momentum. Here,
 $\langle \,\rangle$
denotes the domain volume average,
 $$\begin{eqnarray}\left\langle \ast \right\rangle =\frac{1}{V}\int _{V}\ast \,\text{d}V.\end{eqnarray}$$
The simulated flow is set to be initially quiescent, with zero initial volume-averaged momentum, yielding zero mean momentum for all time. Ensuring
 $\text{d}\!\left\langle \unicode[STIX]{x1D70C}\boldsymbol{u}\right\rangle \!/\text{d}t=0$
then requires
 $$\begin{eqnarray}\unicode[STIX]{x1D71E}\cong -\widehat{\boldsymbol{z}}\unicode[STIX]{x1D70C}_{0}g,\end{eqnarray}$$
where
 $$\begin{eqnarray}\unicode[STIX]{x1D70C}_{0}=\left\langle \unicode[STIX]{x1D70C}\right\rangle =\unicode[STIX]{x1D6FD}\unicode[STIX]{x1D70C}_{1}+(1-\unicode[STIX]{x1D6FD})\unicode[STIX]{x1D70C}_{2},\end{eqnarray}$$
with
 $\unicode[STIX]{x1D6FD}$
denoting the high-density fluid volume fraction in the domain. For the majority of the simulations shown,
 $\unicode[STIX]{x1D70C}_{0}=(\unicode[STIX]{x1D70C}_{1}+\unicode[STIX]{x1D70C}_{2})/2$
, i.e.
 $\unicode[STIX]{x1D6FD}=1/2$
, with equal volumes of high- and low-density fluid in the domain.
In the simulated frame of reference corresponding to (2.6),
 $\unicode[STIX]{x1D71E}$
is approximately constant, since the mean density,
 $\unicode[STIX]{x1D70C}_{0}$
, remains constant as the flow evolves. However, local fluctuations can cause small unsteady displacements of the centre of mass, requiring the imposition of small variations in
 $\unicode[STIX]{x1D71E}$
to maintain a constant mean momentum.
2.3 Flow initialization
The flow is initialized with a region of high-density fluid between regions of low-density fluid, as shown in figure 1. With this initialization, the flow is statistically anisotropic with respect to all three axes but statistically homogeneous in the
 $(y,z)$
-plane. In the chosen frame, low-density fluid moves opposite to the external uniform acceleration field and high-density fluid moves in the direction of the external uniform acceleration field. In a stationary frame, both fluids would move in the direction of the external uniform acceleration field (i.e. downwards in figure 1).
Initial density field. High-density fluid (dark blue) moves in the same direction as the acceleration field between regions of low-density fluid (light blue) moving in the opposite direction to the acceleration field. The interface between high- and low-density fluid is initially perturbed in the
 $(y,z)$
-plane.

Transitions at fluid interfaces are initially represented by error functions,
 $$\begin{eqnarray}\unicode[STIX]{x1D70C}(\boldsymbol{x};t=0)=\frac{1}{2}\left\{\text{erf}\left[\frac{x_{\text{i}}(\boldsymbol{x})-x_{0}}{2\unicode[STIX]{x0394}x}\right]-\text{erf}\left[\frac{x_{\text{i}}(\boldsymbol{x})-(L-x_{0})}{2\unicode[STIX]{x0394}x}\right]\right\}(\unicode[STIX]{x1D70C}_{1}-\unicode[STIX]{x1D70C}_{2})+\unicode[STIX]{x1D70C}_{2},\end{eqnarray}$$
where
 $\boldsymbol{x}=(x,y,z)$
,
 $$\begin{eqnarray}x_{\text{i}}(\boldsymbol{x})=x+20\unicode[STIX]{x0394}x\unicode[STIX]{x1D709}(y,z)\quad \text{and}\quad x_{0}=(1-\unicode[STIX]{x1D6FD})L/2.\end{eqnarray}$$
 $\unicode[STIX]{x0394}x$
is the grid spacing,
 $L$
is the periodic cubic domain extent and
 $\unicode[STIX]{x1D709}(y,z)$
is the initial scaled perturbation field. Perturbation amplitudes are scaled by
 $20\unicode[STIX]{x0394}x$
(2.8b,c
), tying them to grid size to ensure their resolution, with the factor of 20 setting the perturbation amplitude. This yields
 $20\unicode[STIX]{x0394}x\unicode[STIX]{x1D709}_{RMS}<0.44\unicode[STIX]{x1D6FF}_{\text{i}}$
, with
 $\unicode[STIX]{x1D6FF}_{\text{i}}$
the initialized shear-layer width.
The flow is initialized with
 $\boldsymbol{u}(\boldsymbol{x},t=0)=0$
. The zero-velocity initialization and (2.8) are not solutions to (2.4). However, the imposition of pressure as a Lagrange multiplier generates the correct diffusion-induced velocity in the first time step(s). Transients from this initial condition decay as the flow evolves. Different initializations were tested with functions other than an error function, such as a hyperbolic tangent and the full initial solution to (2.4). All relaxed to statistically similar states. Details of the initial perturbation displacements,
 $\unicode[STIX]{x1D709}(y,z)$
, and initial function profile tests are discussed further in appendix B.
2.4 Numerical method
The method of direct numerical simulation is used to solve the flow equations. A Fourier pseudo-spectral spatial discretization method is employed (Chung & Pullin Reference Chung and Pullin2010) in the triply periodic cubic domain. A Helmholtz–Hodge decomposition of pressure is implemented following Chung & Pullin (Reference Chung and Pullin2010). The present simulations maintain a constant volume-averaged momentum in the entire domain, as discussed in § 2.2. The zero volume-averaged momentum constraint is imposed by removing any small mean-momentum fluctuations that ensue at every time step. The semi-implicit Runge–Kutta time stepping method of Spalart, Moser & Rogers (Reference Spalart, Moser and Rogers1991) is used.
The computational domain for the flow simulations is discretized using
 $1024^{3}$
cells for the majority of the simulations shown. If no resolution is indicated, the results are for
 $1024^{3}$
runs. Simulations performed with a
 $512^{3}$
resolution are labelled as such. All simulations are resolved to
 $k_{max}\unicode[STIX]{x1D702}_{min}>1.5$
, where
 $k_{max}$
is the maximum resolved wavenumber and
 $\unicode[STIX]{x1D702}_{min}$
is the minimum plane-averaged Kolmogorov length scale (see appendix A).
This code has been used previously, where it was tested and verified in Chung & Pullin (Reference Chung and Pullin2010), and further verified as part of the present work. Additional details on the numerical method are discussed in appendix A.
3 Flow characteristics
The flow in the cubic computational domain is scaled as:
 $$\begin{eqnarray}L=4\unicode[STIX]{x03C0};\end{eqnarray}$$
with times scaled by the characteristic time
 $$\begin{eqnarray}\unicode[STIX]{x1D70F}=2\unicode[STIX]{x03C0}\sqrt{\frac{\ell }{{\mathcal{A}}g}},\end{eqnarray}$$
and
 $$\begin{eqnarray}\ell =\frac{L}{2},\end{eqnarray}$$
the horizontal distance between the initial free-stream midpoints.
 $$\begin{eqnarray}{\mathcal{A}}=\frac{R-1}{R+1},\end{eqnarray}$$
is the Atwood number, with
 $$\begin{eqnarray}R\equiv \frac{\unicode[STIX]{x1D70C}_{1}}{\unicode[STIX]{x1D70C}_{2}},\end{eqnarray}$$
the density ratio of high- to low-density fluid. The mean density is set to
 $\unicode[STIX]{x1D70C}_{0}=1$
(cf. (2.7)), which selects the values of
 $\unicode[STIX]{x1D70C}_{1}$
and
 $\unicode[STIX]{x1D70C}_{2}$
, given the volume fraction of high-density fluid,
 $\unicode[STIX]{x1D6FD}$
, and the density ratio,
 $R$
.
Figure 2 displays slices of the density field for density ratios:
 $R=1.4$
, 2, 5 and 10, with
 $\unicode[STIX]{x1D6FD}=1/2$
. Only half the domain slice in
 $x$
is shown. Figure 2(a) depicts the flow for those density ratios at the same non-dimensional time,
 $t/\unicode[STIX]{x1D70F}$
. The flow is initially dominated by diffusion, with growing unsteadiness eventually leading to turbulence. In this turbulent regime, flow realizations are best compared at the same Reynolds number as opposed to the same dimensionless time.
High-density fluid mole fraction for
 $R=1.4$
, 2, 5 and 10 (from left to right). Dark colour indicates
 $X=1$
(pure high-density fluid) and white indicates
 $X=0$
(pure low-density fluid). (a) Flow slices at the same time,
 $t/\unicode[STIX]{x1D70F}\approx 0.2$
, when shear-layer growth is dominated by diffusion. (b) Flow slices at later (and different) times, at
 $Re_{\unicode[STIX]{x1D6FF}}\approx 8500$
, except for
 $R=10$
flow that is displayed at
 $Re_{\unicode[STIX]{x1D6FF}}\approx 7700$
.

An outer-scale Reynolds number is used in this discussion, based on the shear-layer width,
 $\unicode[STIX]{x1D6FF}$
, the vertical velocity difference across the shear layer,
 $\unicode[STIX]{x0394}W$
, and the mean density within the shear layer,
 $\overline{\unicode[STIX]{x1D70C}}$
, as described in § 4. Flow realizations for
 $R=1.4$
, 2 and 5 are shown in figure 2(b) at
 $Re_{\unicode[STIX]{x1D6FF}}\approx 8500$
, at the outset of fully developed turbulence, as further discussed in § 4. The flow for
 $R=10$
is displayed at
 $Re_{\unicode[STIX]{x1D6FF}}\approx 7700$
, the highest Reynolds number attained at that (highest) density ratio.
Flow statistics in the fully developed turbulent regime, which generally begins at approximately
 $Re_{\unicode[STIX]{x1D6FF}}\sim 10^{4}$
(Dimotakis Reference Dimotakis2000), exhibit relatively low sensitivity to Reynolds number. The flow discussed here enters this regime at comparable outer flow Reynolds numbers, as also discussed in § 4.
Shear layers eventually encroach across a pure free-stream fluid, as can be seen in the slices for
 $R=5$
and
 $R=10$
in figure 2(b), where the shear layer has straddled the low-density stream. Flow simulations are terminated once mixed fluid extends across either of the pure free streams.
4 Bulk flow statistics
4.1 Shear-layer width growth
We adopt the mixed-fluid region width definition proposed by Koochesfahani & Dimotakis (Reference Koochesfahani and Dimotakis1986), wherein the ‘mixed-fluid’ transverse extent, i.e. the shear-layer width,
 $\unicode[STIX]{x1D6FF}(t)$
, is based on a 1 % criterion, or the transverse extent that spans all locations with fluid mass fractions in the range
 $$\begin{eqnarray}0.01<Y(\boldsymbol{x},t)<0.99.\end{eqnarray}$$
Rewriting (2.4) with
 $\mathit{Sc}=1$
(uniformly), i.e.
 ${\mathcal{D}}(\boldsymbol{x},t)=\unicode[STIX]{x1D707}/\unicode[STIX]{x1D70C}(\boldsymbol{x},t)$
allows both sides the equation to be expressed as functions of
 $1/\unicode[STIX]{x1D70C}$
, which helps elucidate the shear-layer growth behaviour, i.e.
 $$\begin{eqnarray}\frac{\text{D}}{\text{D}t}\left(\frac{1}{\unicode[STIX]{x1D70C}}\right)=\unicode[STIX]{x1D707}\frac{1}{\unicode[STIX]{x1D70C}}\unicode[STIX]{x1D6FB}^{2}\left(\frac{1}{\unicode[STIX]{x1D70C}}\right).\end{eqnarray}$$
Diffusion induces a contribution to the initial velocity field, and for the unperturbed case,
 $\boldsymbol{u}=\widehat{\boldsymbol{x}}u(x,t)$
and
 $\unicode[STIX]{x1D70C}=\unicode[STIX]{x1D70C}(x,t)$
, as in Cook & Dimotakis (Reference Cook and Dimotakis2001),
 $$\begin{eqnarray}u(x,t)\approx u_{\text{D}}(x,t)=\unicode[STIX]{x1D707}\frac{\unicode[STIX]{x2202}}{\unicode[STIX]{x2202}x}\left[\frac{1}{\unicode[STIX]{x1D70C}(x,t)}\right].\end{eqnarray}$$
The convective term initially satisfies the equation,
 $$\begin{eqnarray}\boldsymbol{u}\,\boldsymbol{\cdot }\,\unicode[STIX]{x1D735}\left(\frac{1}{\unicode[STIX]{x1D70C}}\right)=\unicode[STIX]{x1D707}\left[\frac{\unicode[STIX]{x2202}}{\unicode[STIX]{x2202}x}\left(\frac{1}{\unicode[STIX]{x1D70C}(x,t)}\right)\right]^{2}.\end{eqnarray}$$
Defining
 $f(\unicode[STIX]{x1D701})=\unicode[STIX]{x1D70C}_{0}/\unicode[STIX]{x1D70C}(x,t)$
, with
 $\unicode[STIX]{x1D701}=(x-x_{0})/\sqrt{t\unicode[STIX]{x1D707}/\unicode[STIX]{x1D70C}_{0}}$
, equation (4.2) becomes
 $$\begin{eqnarray}f(\unicode[STIX]{x1D701})f^{\prime \prime }(\unicode[STIX]{x1D701})+\frac{\unicode[STIX]{x1D701}}{2}f^{\prime }(\unicode[STIX]{x1D701})-[f^{\prime }(\unicode[STIX]{x1D701})]^{2}=0,\end{eqnarray}$$
with boundary conditions of
 $f(\unicode[STIX]{x1D701}\rightarrow \infty )\rightarrow \unicode[STIX]{x1D70C}_{0}/\unicode[STIX]{x1D70C}_{1}$
and
 $f(\unicode[STIX]{x1D701}\rightarrow -\infty )\rightarrow \unicode[STIX]{x1D70C}_{0}/\unicode[STIX]{x1D70C}_{2}$
, which admits similarity solutions. Equation (4.5) indicates that the relevant length scale in the diffusive regime is
 $\sqrt{t\unicode[STIX]{x1D707}/\unicode[STIX]{x1D70C}_{0}}$
; the shear layer would grow as
 ${\sim}\sqrt{t}$
in this regime. However, to avoid gradient singularities, flows are initialized with a small width, corresponding to an effective initial time,
 $t_{\text{i}}$
, in each case.
The solution to (4.5) is density ratio dependent, as dictated by the boundary conditions. Figure 3 displays solutions to (4.5) in terms of mass fractions, where
 $$\begin{eqnarray}f(\unicode[STIX]{x1D701})=\frac{\unicode[STIX]{x1D70C}_{0}}{\unicode[STIX]{x1D70C}_{2}}-\left(\frac{\unicode[STIX]{x1D70C}_{0}}{\unicode[STIX]{x1D70C}_{2}}-\frac{\unicode[STIX]{x1D70C}_{0}}{\unicode[STIX]{x1D70C}_{1}}\right)Y(\unicode[STIX]{x1D701})\rightarrow Y(\unicode[STIX]{x1D701})=\frac{\displaystyle \frac{\unicode[STIX]{x1D70C}_{0}}{\unicode[STIX]{x1D70C}_{2}}-f(\unicode[STIX]{x1D701})}{\displaystyle \frac{\unicode[STIX]{x1D70C}_{0}}{\unicode[STIX]{x1D70C}_{2}}-\frac{\unicode[STIX]{x1D70C}_{0}}{\unicode[STIX]{x1D70C}_{1}}}.\end{eqnarray}$$
Figure 3(a) displays solutions of (4.5) in terms of the self-similar variable,
 $\unicode[STIX]{x1D701}$
. Figure 3(b) displays solutions at the initial times,
 $t_{\text{i}}$
, i.e.
 $Y(x,t=0)$
, where
 $x$
is offset by
 $x_{0}$
to match initial conditions. Profiles are asymmetric, with longer tails extending into the lower-density fluid.
Mass-fraction solutions to the self-similar mass conservation equation (4.5) for four density ratios. (a) Plot of
 $Y(\unicode[STIX]{x1D701})$
, with dashed line at
 $\unicode[STIX]{x1D701}=0$
shown for reference. (b) Plot of
 $Y(x,t=0)$
with dashed line at
 $(x-x_{0})/\ell =0$
.

In the present simulations, the initial velocity field is set to zero everywhere, i.e.
 $\boldsymbol{u}(\boldsymbol{x},t=0)=0$
. However, initially, a non-zero initial diffusion-induced velocity field is required (cf. (4.3)), with non-zero components in all directions induced by the perturbed density field. This initial non-zero diffusion-induced velocity field was shown to have little impact on the flow and omitted in the majority of the simulations. Appendix B discusses this and other initial condition choices.
The self-similar mass conservation equation predicts shear-layer widths that grow in the diffusive regime as
 $$\begin{eqnarray}\frac{\unicode[STIX]{x1D6FF}(t)}{\unicode[STIX]{x1D6FF}_{\text{i}}}=\left(\frac{t+t_{\text{i}}}{t_{\text{i}}}\right)^{1/2},\end{eqnarray}$$
with
 $\unicode[STIX]{x1D6FF}_{\text{i}}=\unicode[STIX]{x1D6FF}(t=0)$
, as set by the initial conditions. This growth is independent of
 $\unicode[STIX]{x1D70F}$
in the local diffusive regime, the characteristic time in (3.1b
), as confirmed in figure 4 that displays the temporal shear-layer width growth for the density ratios studied, non-dimensionalized with
 $\unicode[STIX]{x1D6FF}_{\text{i}}$
.
Non-dimensionalized shear-layer width,
 $(\unicode[STIX]{x1D6FF}/\unicode[STIX]{x1D6FF}_{\text{i}})\sqrt{t_{\text{i}}/\unicode[STIX]{x1D70F}}$
, versus time, for seven density ratios (coloured lines) with the black line for slope reference.

Following transition to the second regime, shear-layer widths grow in time as
 $$\begin{eqnarray}\frac{\unicode[STIX]{x1D6FF}(t)}{\unicode[STIX]{x1D6FF}_{tr}}\simeq \left(\frac{t+t_{\text{i}}}{t_{tr}+t_{\text{i}}}\right)^{3},\end{eqnarray}$$
in which the two asymptotic (diffusive and unsteady) regimes cross at
 $t_{tr}$
(figure 5), with
 $t_{tr}$
an implicit function of
 $\unicode[STIX]{x1D70F}$
. Transitions to the second regime for each flow vary somewhat. However, no systematic dependence of the transition time on flow parameters or initial perturbations is observed, as discussed further in appendix B.
Figure 5 displays shear-layer widths plotted as
 $\unicode[STIX]{x1D6FF}/\ell$
(lines on top), and shear-layer widths further scaled with
 $\sqrt{t_{\text{i}}/\unicode[STIX]{x1D70F}}$
(lines on bottom). The shear-layer width is initialized as,
 $\unicode[STIX]{x1D6FF}_{\text{i}}$
, corresponding to a
 $t_{\text{i}}$
, which then scales shear-layer width growth in the diffusive regime. Shear-layer width growth in the unsteady flow regime scales with
 $\ell$
, rather than
 $\unicode[STIX]{x1D6FF}_{\text{i}}$
, and plotted accordingly in figure 5.
Shear-layer widths versus time, for seven density ratios (coloured lines). Black lines denote approximate reference slopes. Top lines are non-dimensionalized by domain width. Bottom lines scale non-dimensionalized shear-layer widths with
 $\sqrt{t_{\text{i}}/\unicode[STIX]{x1D70F}}$
.

In the present study, shear-layer widths in the turbulent regime are observed to grow approximately proportional to the cube of time. Modulo variations in the high-Lyapunov-exponent turbulent regime, this near-cubic time dependence of the shear-layer width emerges as a relatively robust result. This can be explained in terms of dimensional analysis and similarity. The time derivative of the shear-layer widths, i.e.
 $\text{d}\unicode[STIX]{x1D6FF}/\text{d}t$
, or in terms of the scaled time,
 $t/\unicode[STIX]{x1D70F}$
, is given by
 $$\begin{eqnarray}\frac{\text{d}\unicode[STIX]{x1D6FF}}{\text{d}(t/\unicode[STIX]{x1D70F})}\simeq \unicode[STIX]{x1D6EC}(t;\unicode[STIX]{x1D70F},R,g),\end{eqnarray}$$
where
 $\unicode[STIX]{x1D6EC}$
is a function with units of length. This then leads to
 $$\begin{eqnarray}\frac{\text{d}\unicode[STIX]{x1D6FF}}{\text{d}(t/\unicode[STIX]{x1D70F})}\propto {\mathcal{A}}gt^{2},\end{eqnarray}$$
i.e. the relevant length scale based on the reduced acceleration,
 ${\mathcal{A}}g$
, with
 ${\mathcal{A}}={\mathcal{A}}(R)$
the Atwood number (3.1d
). Dividing both sides by
 $\ell$
then yields,
 $$\begin{eqnarray}\frac{\text{d}(\unicode[STIX]{x1D6FF}/\ell )}{\text{d}(t/\unicode[STIX]{x1D70F})}\propto \frac{t^{2}}{\ell /({\mathcal{A}}g)}\simeq C_{\unicode[STIX]{x1D6FF}}\left(\frac{t}{\unicode[STIX]{x1D70F}}\right)^{2},\end{eqnarray}$$
as observed, modulo virtual origins in time and
 $\unicode[STIX]{x1D6FF}$
. Rescaling
 $\ell$
, i.e.
 $\ell \rightarrow \unicode[STIX]{x1D706}\ell$
, only redefines the proportionality constant, i.e.
 $C_{\unicode[STIX]{x1D6FF}}\rightarrow \unicode[STIX]{x1D706}^{1/2}C_{\unicode[STIX]{x1D6FF}}$
, leaving the predicted quadratic growth rate time dependence unaltered.
A comparison of this behaviour with the growth of the time-dependent vertical extent of the mixed-fluid region in Rayleigh–Taylor (RT) flow,
 $h_{RT}(t)$
, is of interest. RT flow also evolves in response to an externally imposed acceleration field,
 $g$
, such as gravity, and possesses the same acceleration-induced length scale,
 ${\mathcal{A}}gt^{2}$
. RT flow, however, has no characteristic time scale akin to
 $\unicode[STIX]{x1D70F}$
that is imposed on its dynamics. In the present flow,
 $\unicode[STIX]{x1D70F}$
scales the time dependence, as seen in figure 5 and in other time-dependent statistics discussed below. Equivalently, RT flow does not possess a time-independent length scale akin to
 $\ell$
, in terms of which the characteristic time
 $\unicode[STIX]{x1D70F}$
is defined (3.1b
).
In RT flow, the vertical extent of the mixed-fluid region grows at a rate that is linear in time, i.e.
 $\text{d}h_{RT}/\text{d}t\propto {\mathcal{A}}gt$
. Vertical velocities also grow linearly in time in the present flow, as shown and discussed below. The difference is that the quadratic growth rate of the shear-layer width
 $\unicode[STIX]{x1D6FF}(t)$
is of a horizontal extent (perpendicular to the acceleration field), versus the vertical extent (parallel to the acceleration field),
 $h_{RT}$
, in RT flow.
As defined here and as demonstrated to scale time-dependent results in the present flow, the time scale,
 $\unicode[STIX]{x1D70F}$
, can be recognized as the period of a simple pendulum of length
 $\ell$
, in a reduced acceleration/gravity field,
 ${\mathcal{A}}g$
. The pendulum length,
 $\ell$
, in the definition of
 $\unicode[STIX]{x1D70F}$
is the distance to the two mid-span points in the two free streams, independently of
 $\unicode[STIX]{x1D6FD}$
, the horizontal span of the high-density fluid.
The high-density fluid responds here by initially accelerating in the direction of the uniform acceleration field (downwards in figure 1), while the low-density fluid accelerates opposite to it (upwards in figure 1), akin to the motion of an initially horizontal pendulum. Periodic boundary conditions on the top and bottom surfaces, however, prevent stable stratification at later times, corresponding to a vertical orientation of an equivalent pendulum, and yielding a homogeneous mixture for long times (Gat et al. Reference Gat, Matheou, Chung and Dimotakis2016). Nevertheless, the initial phase of what would be an overturning motion is unimpeded by the boundary conditions and the pendulum period emerges as a characteristic time scale.
Shear-layer growth rates in figure 5 suggest that
 $C_{\unicode[STIX]{x1D6FF}}$
increases with
 $R$
. Flows with
 $R=5$
and
 $R=10$
density ratio did not reach scaled times that were as large in their late-time asymptotic state as for lower density ratios; their free streams were encroached earlier, as discussed above towards the end of § 3. Wider free streams (higher grid resolution) for those density ratios may have allowed a similar asymptotic state to be attained, as suggested in
 $R<5$
flows.
The present flow is relevant to RT flow. Shear layers investigated here correspond to sheared regions formed between descending high-density fluid ‘spikes’ and ascending low-density fluid ‘bubbles’ in RT flow. The rapidly growing shear layers reported here would be expected to encroach across the supply of pure fluids in RT flow, leading to a later growth phase in the vertical extent of that flow that may, eventually, be slower.
4.2 Free-stream velocity difference across the shear layer
The externally imposed acceleration (gravity) field induces a hydrostatic pressure field, which initially is the sole pressure field component,
 $$\begin{eqnarray}\unicode[STIX]{x1D71E}+\unicode[STIX]{x1D735}p\simeq -\widehat{\boldsymbol{z}}\unicode[STIX]{x1D70C}_{0}g,\end{eqnarray}$$
simplifying (2.1b ) for the free-stream velocity, i.e.
 $$\begin{eqnarray}\frac{\text{D}\boldsymbol{U}}{\text{D}t}\simeq -\widehat{\boldsymbol{z}}g\left(1-\frac{\unicode[STIX]{x1D70C}_{0}}{\unicode[STIX]{x1D70C}}\right),\end{eqnarray}$$
ignoring viscous terms that are small compared to the pressure and acceleration terms. This analysis applies to the free-stream velocity field,
 $\boldsymbol{U}$
, as opposed to the space–time-dependent velocity in the entire domain,
 $\boldsymbol{u}(\boldsymbol{x},t)$
.
The free-stream velocity field is dominated by its
 $\widehat{\boldsymbol{z}}$
component, even at late times, which is a function of
 $x$
– the coordinate across the shear-layer thickness. Thus,
 $$\begin{eqnarray}\frac{\text{D}\boldsymbol{U}}{\text{D}t}=\frac{\unicode[STIX]{x2202}\boldsymbol{U}}{\unicode[STIX]{x2202}t}+(\boldsymbol{U}\,\boldsymbol{\cdot }\,\unicode[STIX]{x1D735})\boldsymbol{U}\approx \widehat{\boldsymbol{z}}\frac{\unicode[STIX]{x2202}W}{\unicode[STIX]{x2202}t}+\widehat{\boldsymbol{z}}W\frac{\unicode[STIX]{x2202}W(x)}{\unicode[STIX]{x2202}z}=\widehat{\boldsymbol{z}}\frac{\unicode[STIX]{x2202}W}{\unicode[STIX]{x2202}t}\end{eqnarray}$$
with the free-stream velocity field,
 $\boldsymbol{U}=(0,0,W)$
. Integrating this equation yields
 $$\begin{eqnarray}W(x,t)=-gt\left[1-\frac{\unicode[STIX]{x1D70C}_{0}}{\unicode[STIX]{x1D70C}(x)}\right].\end{eqnarray}$$
The difference between the free-stream velocities is then a linear function of time, i.e.
 $$\begin{eqnarray}\displaystyle \unicode[STIX]{x0394}W & = & \displaystyle |W_{1}-W_{2}|=gt\left(\frac{\unicode[STIX]{x1D70C}_{0}}{\unicode[STIX]{x1D70C}_{2}}-\frac{\unicode[STIX]{x1D70C}_{0}}{\unicode[STIX]{x1D70C}_{1}}\right)\nonumber\\ \displaystyle & = & \displaystyle {\mathcal{A}}gt\frac{(R+1)}{R}[(R-1)\unicode[STIX]{x1D6FD}+1],\end{eqnarray}$$
where, as before,
 $\unicode[STIX]{x1D6FD}$
is the volume fraction of high-density fluid in the periodic domain. Scaling the right-hand side by
 $\unicode[STIX]{x1D70F}/\ell$
yields
 $$\begin{eqnarray}\unicode[STIX]{x0394}W=\frac{(2\unicode[STIX]{x03C0})^{2}(R+1)[(R-1)\unicode[STIX]{x1D6FD}+1]}{(\unicode[STIX]{x1D70F}/\ell )R}\left(\frac{t}{\unicode[STIX]{x1D70F}}\right),\end{eqnarray}$$
or,
 $$\begin{eqnarray}\frac{\text{d}\unicode[STIX]{x0394}W}{\text{d}(t/\unicode[STIX]{x1D70F})}=\frac{(2\unicode[STIX]{x03C0})^{2}(R+1)[(R-1)\unicode[STIX]{x1D6FD}+1]}{(\unicode[STIX]{x1D70F}/\ell )R}.\end{eqnarray}$$
For the common
 $\unicode[STIX]{x1D6FD}=1/2$
case, this becomes
 $$\begin{eqnarray}\frac{\text{d}\unicode[STIX]{x0394}W}{\text{d}(t/\unicode[STIX]{x1D70F})}=\frac{[2\unicode[STIX]{x03C0}(R+1)]^{2}}{2(\unicode[STIX]{x1D70F}/\ell )R}.\end{eqnarray}$$
Figure 6 displays the simulated values of
 $\unicode[STIX]{x0394}W$
, confirming the analytical solution in (4.13b
) and (4.13d
). Plots shown are for
 $\unicode[STIX]{x1D6FD}=1/2$
. The results were tested and also hold for
 $\unicode[STIX]{x1D6FD}=1/4$
,
 $1/3$
,
 $2/3$
and
 $3/4$
, but are not shown for brevity. Late-time deviations occur when shear layers bridge across a free-stream extent.
Scaled free-stream velocity difference,
 $\unicode[STIX]{x0394}W$
, for
 $\unicode[STIX]{x1D6FD}=1/2$
and various density ratios. Dashed black line plots the prediction of (4.13b
).

Returning to the discussion of RT flow, we note that vertical velocities here are also proportional to time, so the vertical separation between two free-stream points across a shear layer would increase as
 $t^{2}$
, as does the vertical extent in RT flow.
4.3 Mean shear-layer density
Equation (4.5) shows that, in the viscous diffusive regime,
 $\overline{\unicode[STIX]{x1D70C}}$
, the mean fluid density within the shear layer is a function of
 $\unicode[STIX]{x1D701}=(x-x_{0})/\sqrt{t\unicode[STIX]{x1D707}/\unicode[STIX]{x1D70C}_{0}}$
, i.e. the density field shape throughout the diffusive regime depends only on the self-similarity variable,
 $\unicode[STIX]{x1D701}$
. The density profile width will increase with time without changing the mean density within the shear layer. This allows the mean density to be predicted from (4.5), for one-dimensional unperturbed flow.
An empirical relation for the mean density within the shear layer can also be obtained through the entrainment ratio. The volumetric entrainment ratio,
 $E_{v}$
, is the ratio of entrained volume of high- to low-speed fluid in the mixing region. For a temporally growing shear layer,
 $E_{v}$
can be represented by the ratio of induction velocities,
 $v_{i1}$
and
 $v_{i2}$
(Dimotakis Reference Dimotakis1986),
 $$\begin{eqnarray}E_{v}=\frac{X_{2}(\overline{\unicode[STIX]{x1D70C}})}{X_{1}(\overline{\unicode[STIX]{x1D70C}})}=-\frac{v_{i2}}{v_{i1}},\end{eqnarray}$$
where
 $X_{\unicode[STIX]{x1D6FC}}$
are the species mole fractions, or volume fractions, with
 $\unicode[STIX]{x1D70C}_{\unicode[STIX]{x1D6FC}}X_{\unicode[STIX]{x1D6FC}}=\unicode[STIX]{x1D70C}Y_{\unicode[STIX]{x1D6FC}}$
. Induction velocities
 $v_{i1}=\text{d}\left\langle x_{0.99}\right\rangle _{y,z,L/R}/\text{d}t$
and
 $v_{i2}=\text{d}\left\langle x_{0.01}\right\rangle _{y,z,L/R}/\text{d}t$
, with
 $\left\langle x_{0.99}\right\rangle _{y,z,L/R}$
and
 $\left\langle x_{0.01}\right\rangle _{y,z,L/R}$
marking the mean left,
 $L$
, and right,
 $R$
, shear-layer boundaries (figure 1) in terms of mass fraction (4.1), averaged over
 $(y,z)$
.
The entrainment ratio can be related to the ratio of apparent velocities in the convective frame with the Dimotakis (Reference Dimotakis1986) ansatz, i.e.
 $$\begin{eqnarray}E_{v}=\frac{X_{2}(\overline{\unicode[STIX]{x1D70C}})}{X_{1}(\overline{\unicode[STIX]{x1D70C}})}=-\frac{v_{i2}}{v_{i1}}=\frac{W_{2}-W_{c}}{W_{c}-W_{1}},\end{eqnarray}$$
where
 $W_{c}$
is the mean convective velocity of the large-scale shear-layer turbulent structures. With (4.15),
 $\overline{\unicode[STIX]{x1D70C}}$
, the mean density within the shear layer is predicted by
 $$\begin{eqnarray}X(\overline{\unicode[STIX]{x1D70C}})=X_{1}(\overline{\unicode[STIX]{x1D70C}})=\frac{1}{E_{v}+1}=\frac{\overline{\unicode[STIX]{x1D70C}}-\unicode[STIX]{x1D70C}_{2}}{\unicode[STIX]{x1D70C}_{1}-\unicode[STIX]{x1D70C}_{2}},\end{eqnarray}$$
where
 $X=X_{1}$
.
In the present simulations, an empirical relation for the convection velocity,
 $W_{c}$
, is indicated by correlations of spatial eddy locations over time and the evolution of the
 $(y,z)$
-averaged vertical velocity. An expression for
 $W_{c}$
is obtained for
 $\unicode[STIX]{x1D6FD}=1/2$
using a relation for temporally growing shear-layer convection velocities (Dimotakis Reference Dimotakis1986),
 $$\begin{eqnarray}W_{c}=\frac{1+r\sqrt{R}}{1+\sqrt{R}},\end{eqnarray}$$
where
 $r$
is the free-stream velocity ratio, i.e.
 $$\begin{eqnarray}\frac{W_{c}}{\unicode[STIX]{x0394}W}=\frac{(W_{1}+W_{2})/\unicode[STIX]{x0394}W}{2\sqrt{R}+3}=\frac{R-1}{(2\sqrt{R}+3)(R+1)}.\end{eqnarray}$$
Figure 7 displays the mean density within the shear layers derived from the simulations (solid lines), compared to the empirical relation for
 $\overline{\unicode[STIX]{x1D70C}}$
(dashed lines) for
 $\unicode[STIX]{x1D6FD}=1/2$
. The empirical relation for
 $\overline{\unicode[STIX]{x1D70C}}$
is derived using the volumetric entrainment-ratio definition (4.15) with (4.16) noting the vertical velocities,
 $W_{1}$
,
 $W_{2}$
and
 $W_{c}$
from (4.12) and (4.18). Values of
 $\overline{\unicode[STIX]{x1D70C}}$
from simulations are calculated using the shear-layer 1 % criterion (4.1) at each
 $(y,z)$
-plane for both shear layers, and averaging. After an initial transient, as mentioned in § 2.3, the mean shear-layer density is seen to relax to approximately the same value independently of initial conditions. These values also match well with the predicted mean density from (4.5). At late times, mean shear-layer densities deviate from the constant
 $\overline{\unicode[STIX]{x1D70C}}$
after pure fluid is depleted. The flow exhibits a small deviation from the predicted
 $\overline{\unicode[STIX]{x1D70C}}$
at
 $t/\unicode[STIX]{x1D70F}$
values corresponding to the transition to the second flow regime (figure 5).

 $W_{c}$
depends on the reference frame and
 $\unicode[STIX]{x1D6FD}$
, the ratio of heavy to light fluid in the computational domain. The expression for
 $W_{c}$
above can be extended empirically to capture the dependence on
 $\unicode[STIX]{x1D6FD}$
:
 $$\begin{eqnarray}\displaystyle \frac{W_{c}}{\unicode[STIX]{x0394}W} & = & \displaystyle \frac{[(1-\unicode[STIX]{x1D6FD})^{2}W_{1}+\unicode[STIX]{x1D6FD}^{2}W_{2}]/\unicode[STIX]{x0394}W}{\unicode[STIX]{x1D6FD}R^{\unicode[STIX]{x1D6FD}}+3(1-\unicode[STIX]{x1D6FD})/2}\nonumber\\ \displaystyle & = & \displaystyle \frac{\unicode[STIX]{x1D6FD}^{3}R-(1-\unicode[STIX]{x1D6FD})^{3}}{[\unicode[STIX]{x1D6FD}R^{\unicode[STIX]{x1D6FD}}+3(1-\unicode[STIX]{x1D6FD})/2][(R-1)\unicode[STIX]{x1D6FD}+1]},\end{eqnarray}$$
which agrees with (4.18) for
 $\unicode[STIX]{x1D6FD}=1/2$
and was obtained similarly by comparing simulations of the same
 $R$
but different
 $\unicode[STIX]{x1D6FD}$
values. We offer no theoretical explanation for it, however.
Figure 8 displays the comparison of (4.19) (in conjunction with (4.15) and (4.16) to obtain
 $\overline{\unicode[STIX]{x1D70C}}$
) with the simulation
 $\overline{\unicode[STIX]{x1D70C}}$
for
 $R=5$
for various
 $\unicode[STIX]{x1D6FD}$
values. These equations yield similar
 $\overline{\unicode[STIX]{x1D70C}}$
values to the simulations (and the analytical solution to (4.5)) and (4.19) approximately matches the mean velocity of the shear layer, as it should in this case.
Mean density within
 $R=5$
shear layers simulated for five
 $\unicode[STIX]{x1D6FD}$
values on
 $512^{3}$
grids. Solid lines show flow simulation results. Dashed lines display the empirical expression value. Small deviations from late-time predictions coincide with diffusive-to-unsteady flow transitions, as also seen in figure 7. Note different
 $y$
-axis here versus that in figure 7.

Equation (4.19) indicates that for
 $\unicode[STIX]{x1D6FD}\geqslant 1/2$
,
 $W_{c}>0$
for all
 $R$
. However, for
 $\unicode[STIX]{x1D6FD}<1/2$
, there are density ratios for which the convective velocity is negative (downward) in the zero-mean-momentum reference frame. For example, for
 $\unicode[STIX]{x1D6FD}=1/3$
,
 $W_{c}<0$
if
 $R<7$
, and for
 $\unicode[STIX]{x1D6FD}=1/4$
,
 $W_{c}<0$
if
 $R<26$
, which includes all
 $R$
values investigated. Flow animations also support this conclusion.
4.4 Reynolds number
Figure 9 shows the evolution of the Reynolds number,
 $Re_{\unicode[STIX]{x1D6FF}}=\overline{\unicode[STIX]{x1D70C}}\unicode[STIX]{x1D6FF}\unicode[STIX]{x0394}W/\unicode[STIX]{x1D707}$
, based on outer-scale variables. The two asymptotic flow regimes, diffusive and unsteady/turbulent, are evident. Some of the curves in figure 9 may suggest the beginning of a third regime at late times. However, this occurs when a free-stream fluid is depleted and shear layers no longer grow freely.
Reynolds-number evolution. Coloured lines display information from the numerical simulations and black lines (solid and dashed) denote reference slopes.

Profiles of the mean kinetic energy in the shear layer become nearly Reynolds-number independent for
 $Re_{\unicode[STIX]{x1D6FF}}\gtrsim 8000$
, characteristic of behaviour past the mixing transition (Dimotakis Reference Dimotakis2000). These results are also omitted for brevity.
5 Statistics in mixed-fluid regions
5.1 Entrainment ratio
Shear-layer entrainment ratios are studied following the analysis of experiments by Koochesfahani & Dimotakis (Reference Koochesfahani and Dimotakis1986), who analyse mixture fraction probability density function (p.d.f.) behaviour in spatially developing shear layers. Koochesfahani & Dimotakis (Reference Koochesfahani and Dimotakis1986) find that mole fraction values in a liquid-phase flow at Reynolds numbers beyond the mixing transition exhibit a ‘non-marching’ or ‘slightly tilted’ hump in the shear-layer composition p.d.f. across the transverse extent of the mixing region. The results of a similar analysis are shown in figure 10.
This paper discusses temporally developing gas-phase (
 $\mathit{Sc}=1$
) shear layers subject to an imposed acceleration field, whereas Koochesfahani & Dimotakis (Reference Koochesfahani and Dimotakis1986) experimentally investigated spatially developing shear layers with constant and uniform free-stream velocities across liquid-phase shear layers (
 $\mathit{Sc}\sim 10^{3}$
). However, behaviour similar to that reported by Koochesfahani & Dimotakis (Reference Koochesfahani and Dimotakis1986) is found in the present flow.
Mole fraction p.d.f.s across the shear layer. (a) Data for
 $R=1.4$
in the diffusion-dominated regime at
 $t/\unicode[STIX]{x1D70F}=0.18$
. (b) Data for the same flow as (a), but at a later time, in the turbulence-dominated regime at
 $t/\unicode[STIX]{x1D70F}=0.35$
. (c) Data for
 $R=5$
flow in the unsteady/turbulent regime at
 $t/\unicode[STIX]{x1D70F}=0.34$
. (d) Data for
 $R=2$
flow at
 $t/\unicode[STIX]{x1D70F}=0.37$
, when
 $Re_{\unicode[STIX]{x1D6FF}}>10\,000$
. Solid black lines mark
 $X(\overline{\unicode[STIX]{x1D70C}})$
.

Figure 10(a) shows the p.d.f. of high-density fluid mole fraction,
 $X$
, across the shear layer for
 $R=1.4$
early in the simulation (
 $t/\unicode[STIX]{x1D70F}=0.18$
), in the diffusion-dominated regime. The expected ‘marching p.d.f.’ is observed in this regime. Figure 10(b) displays the shear-layer mole fraction p.d.f. later, for the same (
 $R=1.4$
) simulation, in the unsteady/turbulent regime. In this regime, a prevalent mole fraction (‘non-marching’) p.d.f. is observed. However, the most probable mole fraction is not exactly the mean mole fraction of mixed fluid within the shear layer, indicated by the black line, although they are close. Asymmetric composition excursions away from the most probable values yield most probable mole fraction values away from the mean, as the p.d.f.s indicate and is shown in figure 11.
Non-marching p.d.f.s are observed at all density ratios in the turbulent regime, with a hump location and degree of tilt a function of
 $R$
. Figure 10(c) shows this in terms of the shear-layer mole fraction p.d.f. for the
 $R=5$
simulations in the turbulent regime. Figure 10(d) displays the same behaviour for the
 $R=2$
simulations at even later times, for
 $Re_{\unicode[STIX]{x1D6FF}}>10\,000$
attained for this flow.
One-dimensional p.d.f.s half-way across the shear layer (
 $x/\unicode[STIX]{x1D6FF}=0.5$
) for various density ratios at times corresponding to
 $Re_{\unicode[STIX]{x1D6FF}}\approx 8500$
. The p.d.f. for the
 $R=10$
simulation is displayed at
 $Re_{\unicode[STIX]{x1D6FF}}\approx 7700$
.
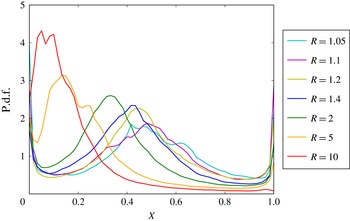
The shear layers entrain more low-density high-speed fluid than high-density low-speed fluid, by volume, at amounts that increase with
 $R$
(Dimotakis Reference Dimotakis1986). This is consistent with the solution to the self-similar mass conservation equation, shown in figure 3, with asymmetric p.d.f.s (figure 11). This has also been observed in buoyancy-driven flows (Livescu & Ristorcelli Reference Livescu and Ristorcelli2008). Additionally, similarly to spatially developing liquid-phase shear layers, simulated temporally developing gas-phase shear layers also exhibit a constant (in time) and most probable mole fraction (‘non-marching’ hump). This is not commonly reported for gas-phase shear-layer experiments (Meyer, Dutton & Lucht Reference Meyer, Dutton and Lucht2006). Marching versus non-marching p.d.f.s have been reported to depend on initial conditions (Rogers & Moser Reference Rogers and Moser1994; Mattner Reference Mattner2011), in particular, the dimensionality of the initial disturbances, i.e. two- versus three-dimensional (Slessor, Bond & Dimotakis Reference Slessor, Bond and Dimotakis1998). Initial disturbances in this study more closely correspond to the three-dimensional initial perturbations of Slessor et al. (Reference Slessor, Bond and Dimotakis1998), for which they report marching p.d.f.s. For all initial conditions explored (appendix B), non-marching slightly tilted p.d.f. behaviour was ubiquitous in the non-diffusive unsteady growth regimes.
5.2 Spectra
For uniform-density flows at finite Reynolds numbers, spectra are found to scale as
 $k^{-5/3+q}$
, with
 $q\rightarrow 0$
with increasing Reynolds numbers (Kolmogorov Reference Kolmogorov1941, Reference Kolmogorov1962; Mydlarski & Warhaft Reference Mydlarski and Warhaft1996). Similar behaviour is observed for variable-density flows at low density ratios (e.g. Batchelor et al.
Reference Batchelor, Canuto and Chasnov1992; Livescu & Ristorcelli Reference Livescu and Ristorcelli2008; Chung & Matheou Reference Chung and Matheou2012). However, for variable-density flow, the kinetic energy, as opposed to the specific kinetic energy, is important.
For notational purposes, the spectrum of a field is denoted as
 $S$
and the spectrum of the fluctuating specific kinetic energy by
 $S_{\boldsymbol{u}^{\prime }\boldsymbol{\cdot }\boldsymbol{u}^{\prime }}=S_{u^{\prime }u^{\prime }}+S_{v^{\prime }v^{\prime }}+S_{w^{\prime }w^{\prime }}$
, where
 $\boldsymbol{u}^{\prime }=(u^{\prime },v^{\prime },w^{\prime })$
, omitting the factor of
 $1/2$
. Spectra shown are spatial one-dimensional spectra along the
 $z$
direction, at particular
 $x$
locations, averaged over
 $y$
. We compare the fields at
 $x$
values corresponding to
 $\left\langle \unicode[STIX]{x1D70C}\right\rangle _{y,z}\approx 1$
, where
 $\left\langle \unicode[STIX]{x1D70C}\right\rangle _{y,z}$
denotes the mean density averaged over
 $(y,z)$
at
 $x$
locations where the spectra are calculated.
Spectra shown are also averaged at the corresponding values of
 $x$
in the two shear layers (cf. figure 1).
 $$\begin{eqnarray}\displaystyle S_{\boldsymbol{u}^{\prime }\boldsymbol{\cdot }\boldsymbol{u}^{\prime }}(k_{3};x,t) & = & \displaystyle \left\langle \int _{-\infty }^{\infty }\overline{\boldsymbol{u}^{\prime }(\boldsymbol{x}+\widehat{\boldsymbol{z}}z^{\prime },t)\boldsymbol{\cdot }\boldsymbol{u}^{\prime }(\boldsymbol{x},t)}\text{e}^{-\text{i}k_{3}z^{\prime }}\text{d}z^{\prime }\right\rangle _{y}\nonumber\\ \displaystyle & = & \displaystyle \left\langle |{\mathcal{F}}_{z}\{u(\boldsymbol{x},t)\}|^{2}+|{\mathcal{F}}_{z}\{v(\boldsymbol{x},t)\}|^{2}+|{\mathcal{F}}_{z}\{w(\boldsymbol{x},t)\}|^{2}\right\rangle _{y}.\end{eqnarray}$$
In the limit of
 $R\rightarrow 1$
, the kinetic energy spectrum must yield the specific kinetic energy spectrum, multiplied by the (near-)uniform density. The scaled spectrum,
 $S_{\boldsymbol{j}^{\prime }\boldsymbol{\cdot }\boldsymbol{j}^{\prime }}/\overline{\unicode[STIX]{x1D70C}}$
, is calculated based on the field
 $\boldsymbol{j}\equiv \unicode[STIX]{x1D70C}^{1/2}\boldsymbol{u}$
, as proposed by Kida & Orszag (Reference Kida and Orszag1992). The kinetic energy spectrum is then computed conventionally. After division by
 $\overline{\unicode[STIX]{x1D70C}}$
, results should converge to specific kinetic energy spectra in the limit of
 $R\rightarrow 1$
.
Spectra for seven density ratios at times corresponding to
 $Re_{\unicode[STIX]{x1D6FF}}\approx 8500$
. Spectra for
 $R=10$
are displayed at
 $Re_{\unicode[STIX]{x1D6FF}}\approx 7700$
. (a) Specific kinetic energy (solid lines) and kinetic energy (dashed lines) spectra, (b) vorticity (solid lines) and specific vorticity (dashed lines) spectra.

To facilitate comparisons and as suggested above, figure 12(a) plots specific kinetic energy spectra (solid lines),
 $S_{\boldsymbol{u}^{\prime }\boldsymbol{\cdot }\boldsymbol{u}^{\prime }}$
, and kinetic energy spectra divided by
 $\overline{\unicode[STIX]{x1D70C}}$
(dashed lines),
 $S_{\boldsymbol{j}^{\prime }\cdot \boldsymbol{j}^{\prime }}/\overline{\unicode[STIX]{x1D70C}}$
, non-dimensionalized by
 $\unicode[STIX]{x1D716}^{-1/4}\unicode[STIX]{x1D708}^{-5/4}$
. The specific kinetic energy dissipation rate is
 $\unicode[STIX]{x1D716}$
and
 $\unicode[STIX]{x1D708}=\unicode[STIX]{x1D707}/\left\langle \unicode[STIX]{x1D70C}\right\rangle _{y,z}$
is a kinematic viscosity, with both averaged over
 $(y,z)$
-planes at the same
 $x$
locations.
The panels in figure 12 display spectra at different times, corresponding to similar Reynolds numbers of
 $Re_{\unicode[STIX]{x1D6FF}}\approx 8500$
for six simulations, with
 $Re_{\unicode[STIX]{x1D6FF}}\approx 7700$
for the
 $R=10$
simulation, the largest Reynolds number attained at that density ratio. Spectra are plotted versus wavenumber,
 $k_{z}$
, scaled with
 $\unicode[STIX]{x1D702}$
, where
 $\unicode[STIX]{x1D702}=(\unicode[STIX]{x1D708}^{3}/\unicode[STIX]{x1D716})^{1/4}$
, the plane-averaged Kolmogorov length scale.
Figure 12(a) reveals approximately one decade of power-law scaling. Including density in the autocorrelation through the
 $\boldsymbol{j}$
dynamic variable has only a small effect on the spectra and does not alter their power-law scaling. The two sets of spectra are similar, as also reported by Kida & Orszag (Reference Kida and Orszag1992) in their investigation of smaller density variations, i.e.
 $\unicode[STIX]{x1D70C}^{\prime }/\overline{\unicode[STIX]{x1D70C}}\leqslant 0.18$
, in simulations of compressible turbulence. The close match between kinetic energy and specific kinetic energy spectra is not attributable to statistical independence between the density and velocity fields. As evident from the flow geometry, this is not expected.
Figure 12(b) displays non-dimensionalized vorticity spectra,
 $S_{\unicode[STIX]{x1D74E}^{\prime }\boldsymbol{\cdot }\unicode[STIX]{x1D74E}^{\prime }}$
(solid lines), and non-dimensionalized specific vorticity spectra,
 $S_{(\unicode[STIX]{x1D74E}/\unicode[STIX]{x1D70C})^{\prime }\cdot (\unicode[STIX]{x1D74E}/\unicode[STIX]{x1D70C})^{\prime }}$
(dashed lines). As with kinetic energy, including density in the vorticity spectra has a small effect, albeit a slightly larger effect than for kinetic energy.
The transport equation for specific vorticity,
 $\unicode[STIX]{x1D74E}/\unicode[STIX]{x1D70C}$
, in variable-density flow can be written as,
 $$\begin{eqnarray}\frac{\text{D}}{\text{D}t}\left(\frac{\unicode[STIX]{x1D74E}}{\unicode[STIX]{x1D70C}}\right)=\left(\frac{\unicode[STIX]{x1D74E}}{\unicode[STIX]{x1D70C}}\right)\,\boldsymbol{\cdot }\,\unicode[STIX]{x1D668}+\frac{1}{\unicode[STIX]{x1D70C}}\left[(\unicode[STIX]{x1D71E}+\unicode[STIX]{x1D735}p)\times \unicode[STIX]{x1D735}\left(\frac{1}{\unicode[STIX]{x1D70C}}\right)+\unicode[STIX]{x1D735}\times \left(\frac{1}{\unicode[STIX]{x1D70C}}\unicode[STIX]{x1D735}\,\boldsymbol{\cdot }\,\unicode[STIX]{x1D749}\right)\right],\end{eqnarray}$$
where
 $\unicode[STIX]{x1D668}=(\unicode[STIX]{x1D735}\boldsymbol{u}+\unicode[STIX]{x1D735}\boldsymbol{u}^{\text{T}})/2$
is the local strain rate tensor and
 $\unicode[STIX]{x1D749}$
is the viscous stress tensor. In this formulation, no dilatation term appears and density enters through its reciprocal, motivating the investigation of specific vorticity in figure 12(b).
One-dimensional compensated spectra in
 $z$
for flow with
 $R=1.4$
at various Reynolds numbers. Note the different
 $x$
axis, which is scaled by the (outer-scale) shear-layer width,
 $\unicode[STIX]{x1D6FF}(t)$
, as opposed to the inner-scale of
 $\unicode[STIX]{x1D702}$
in figure 12. Spectra are multiplied by
 $(k_{z}\ell )^{5/3-q}$
, where
 $\ell =L/2$
half the computational domain width, and
 $q=0.3$
. The black horizontal line is for reference.

To explore the spectral dependence on Reynolds number, figure 13 displays one-dimensional kinetic energy spectra for
 $R=1.4$
. These are compensated (multiplied by
 $(k_{z}\ell )^{5/3-q}$
, with
 $q=0.3$
) and exhibit very small slopes over about a decade, with slopes slightly decreasing with increasing Reynolds number, terminating with the viscous attenuation at small scales, i.e. progressively higher wavenumbers. The value
 $q=0.3$
was determined by fitting slopes to achieve nearly horizontal lines for the larger Reynolds numbers and is consistent with findings by Mydlarski & Warhaft (Reference Mydlarski and Warhaft1996). Figure 13 demonstrates the larger-scale wavenumber separation with increasing Reynolds number, as expected.
6 Conclusions
Results of direct numerical simulation of a variable-density flow at zero Mach number subject to a uniform acceleration field are presented in a novel configuration, with density ratios in the range
 $1.05\leqslant R\leqslant 10$
. The downward acceleration acts on initially vertical slabs of high-density fluid, in between vertical slabs of low-density fluid, in a triply periodic cubic flow domain. Initially horizontal density gradients are acted on by the acceleration-induced vertical pressure gradient, producing baroclinic torques that generate vorticity and shear-layer growth. The simulated flow attains Reynolds numbers that are in, or approaching, the fully developed turbulent regime with
 $Re_{\unicode[STIX]{x1D6FF},max}\approx 20\,000$
.
Simulations are in an accelerating frame in which the mean momentum is constant and maintained to be zero, facilitating imposed force accounting. In that frame, the acceleration dictates the vertical shear-layer large-scale structure convection velocity,
 $W_{c}$
. An empirical relation obtained for
 $W_{c}$
predicts the observed entrainment ratio and dominant mixed-fluid composition statistics, in accord with the self-similar mass conservation equation.
An equation for
 $\unicode[STIX]{x0394}W=|W_{1}-W_{2}|$
, the difference of the free-stream vertical velocities as a function of time,
 $\unicode[STIX]{x0394}W(t/\unicode[STIX]{x1D70F})/(\ell /\unicode[STIX]{x1D70F})=\text{}\underline{\text{fn}}(t/\unicode[STIX]{x1D70F};R,\unicode[STIX]{x1D6FD})$
, is derived and solved. The theory is confirmed by simulation for all values of
 $R$
studied, provided unmixed free-stream fluid remains on both sides of the shear layers.
Two phenomena cause shear-layer growth: diffusion and turbulent eddy growth. Diffusion dominates in a first regime, yielding a growth rate of
 $\unicode[STIX]{x1D6FF}/\unicode[STIX]{x1D6FF}_{\text{i}}=\sqrt{(t+t_{\text{i}})/t_{\text{i}}}$
. A subsequent regime is dominated by unsteady eddy growth, leading to turbulence. Shear-layer growth in this regime is found to scale approximately as the cube of time, i.e.
 $\unicode[STIX]{x1D6FF}(t)/\unicode[STIX]{x1D6FF}_{tr}\simeq [(t+t_{\text{i}})/(t_{tr}+t_{\text{i}})]^{3}$
, where
 $\unicode[STIX]{x1D6FF}_{tr}$
is the shear-layer thickness at the transition time to the unsteady/turbulent regime,
 $t_{tr}$
.
The cubic time dependence represents a new result, to the best of our knowledge. This unsteady/turbulent shear-layer growth is traceable to a fixed length scale,
 $\ell$
, that in turn defines a fixed characteristic flow time,
 $\unicode[STIX]{x1D70F}$
. The (horizontal width) growth rate then becomes,
 $\text{d}\unicode[STIX]{x1D6FF}/\text{d}(t/\unicode[STIX]{x1D70F})\propto {\mathcal{A}}gt^{2}$
, consistent with the observed cubic growth in time. Notably, the vertical extent of a Rayleigh–Taylor mixed-fluid region grows quadratically in time, i.e. a linear growth of its derivative,
 $\text{d}h_{RT}/\text{d}t\propto t$
, as with the linear growth in time of all vertical velocities in the flow studied here.
In the unsteady/turbulent regime, composition p.d.f.s within the shear layers exhibit a slightly tilted and constant in time (‘non-marching’) hump, (approximately) corresponding to the most probable mole fraction. The shear layers preferentially entrain low-density fluid by volume, as noted previously (Dimotakis Reference Dimotakis1986; Livescu & Ristorcelli Reference Livescu and Ristorcelli2007, Reference Livescu and Ristorcelli2008), and this is reflected in the mixed-fluid composition observed for all density ratios investigated in this flow.
For non-uniform-density flows, spectra of the kinetic energy must include the local density, i.e.
 $\unicode[STIX]{x1D70C}u^{2}$
, as opposed to the specific kinetic energy,
 $u^{2}$
(ignoring factors of
 $1/2$
). This is addressed via the spatial autocorrelation of
 $\boldsymbol{j}=\unicode[STIX]{x1D70C}^{1/2}\boldsymbol{u}$
and its spectra. Scaling the latter with
 $\overline{\unicode[STIX]{x1D70C}}$
, the mean density in the shear-layer mixed-fluid region, yields spectra similar to specific-kinetic energy spectra. The specific vorticity,
 $\unicode[STIX]{x1D74E}/\unicode[STIX]{x1D70C}$
, obviating dealing with dilatation as a separate effect in flows extending to high density ratios, was also studied. Spectra of fluctuating specific vorticity are found to be very nearly similar to scaled fluctuating vorticity spectra. Other statistics, such as entrainment ratio and shear-layer composition p.d.f.s, that depend on density ratio are found to be in accord with previous theory predictions.
In conclusion, the baroclinic-vorticity-generated flow described in this paper exhibits novel dynamics, with attributes that can be mapped to those for uniform-density flows, such as spectral scaling, regardless of the density ratio,
 $R$
, extending to the Boussinesq limit, i.e.
 $R=1+\unicode[STIX]{x1D700}$
, as
 $\unicode[STIX]{x1D700}\rightarrow 0$
, but also others that cannot be similarly mapped.
Acknowledgements
The work is supported by DOE grant DE-NA0002382, the NSF Graduate Research Fellowship Program under grant DGE-1144469, the Caltech academic program, and the Caltech Northrop Chair in Aeronautics. Support was also provided by the AFOSR grant FA9550-12-1-0461, the Blue Waters Sustained-Petascale Computing Project, supported by NSF Awards OCI-0725070 and ACI-1238993, and the state of Illinois. Blue Waters is a joint effort of the University of Illinois at Urbana-Champaign and its National Center for Supercomputing Applications. Simulations performed on Blue Waters were under NSF PRAC award number ACI-1440083. Computations were also performed on the Caltech Zwicky computer cluster, supported by NSF MRI-R2 Award PHY-0060291 and by the Sherman Fairchild Foundation. The work was also supported by the Cray Trinity system of the Alliance for Computing at Extreme Scale (ACES), a partnership between Los Alamos National Laboratory and Sandia National Laboratories for the U.S. Department of Energy’s NNSA. Data storage, visualization, and post-processing were facilitated by a computer cluster integrated by D. Lang, and developed through support by NSF MRI grant EIA-0079871, AFOSR DURIP grant FA9550-10-1-0553, and support by the AFOSR and DOE grants mentioned above. We’d like to thank C. Pantano for noting an additional term in the self-similar mass conservation equation contributed by the diffusion-induced velocity (4.3). We would finally like to acknowledge discussions with D. Meiron and D. Pullin, and a collaboration in the computations with C. Ott.
Appendix A. Numerical method
A.1 Time integration
The time integration method used is a low-storage semi-implicit Runge–Kutta scheme from Spalart et al. (Reference Spalart, Moser and Rogers1991), with an adaptive time step, discussed in Chung (Reference Chung2009) and Chung & Pullin (Reference Chung and Pullin2010). The discrete time mass conservation equation (Chung Reference Chung2009, equation (2.20a)) differs from the implementation in this paper to account for a variable diffusivity,
 ${\mathcal{D}}(\boldsymbol{x},t)=\unicode[STIX]{x1D707}/\unicode[STIX]{x1D70C}(\boldsymbol{x},t)$
, as opposed to
 ${\mathcal{D}}(\boldsymbol{x},t)={\mathcal{D}}=\text{const.}$
in Chung (Reference Chung2009) and Chung & Pullin (Reference Chung and Pullin2010). The variable diffusion coefficient here requires solving for
 $\unicode[STIX]{x1D70C}$
instead of
 $s=\log (\unicode[STIX]{x1D70C}/\unicode[STIX]{x1D70C}_{0})$
with additional terms in the equation for
 $H_{s}$
(
 $H_{\unicode[STIX]{x1D70C}}$
here) in Chung (Reference Chung2009, § 2.3.2), which are solved explicitly.
A.2 Pressure term
Chung & Pullin (Reference Chung and Pullin2010) decompose the pressure term into Lagrange multipliers
 $(\unicode[STIX]{x1D719},\unicode[STIX]{x1D74D},\boldsymbol{f})$
:
 $$\begin{eqnarray}\boldsymbol{P}=\frac{1}{\unicode[STIX]{x1D70C}^{(\ast )}}(\unicode[STIX]{x1D71E}+\unicode[STIX]{x1D735}p)=\unicode[STIX]{x1D735}\unicode[STIX]{x1D719}+\boldsymbol{h}+\boldsymbol{f},\end{eqnarray}$$
where
 $\unicode[STIX]{x1D70C}^{(\ast )}$
is a weighted average density over the time step,
 $\boldsymbol{h}=\unicode[STIX]{x1D735}\times \unicode[STIX]{x1D74D}$
, and
 $\boldsymbol{f}=\boldsymbol{f}(t)$
is a harmonic component.
With this decomposition,
 $\unicode[STIX]{x1D719}$
can be solved exactly from the divergence of the momentum equation, combined with the mass conservation equation.
 $\unicode[STIX]{x1D74D}$
is calculated iteratively, as described in Chung (Reference Chung2009, § 2.3.1), with a convergence error set to be less than
 $10^{-6}$
in the present simulations. Lastly,
 $\boldsymbol{f}$
is solved by imposing a zero volume-averaged momentum constraint, i.e.
 $\left\langle \unicode[STIX]{x1D70C}^{n+1}\boldsymbol{u}^{n+1}\right\rangle =0$
, as discussed in § 2.2. This is similar to Chung (Reference Chung2009), but with a volume-averaged momentum here, as opposed to a mid-plane-averaged velocity field in Chung (Reference Chung2009).
A.3 Grid resolution
The value of the uniform viscosity,
 $\unicode[STIX]{x1D707}$
, is set in the simulations to ensure that they remain well resolved, i.e.
 $k_{max}\unicode[STIX]{x1D702}_{min}>1.5$
(Donzis & Yeung Reference Donzis and Yeung2010), with
 $$\begin{eqnarray}\unicode[STIX]{x1D702}_{min}=\underset{x}{\min }\left\{\left(\frac{\unicode[STIX]{x1D708}^{3}}{\unicode[STIX]{x1D716}}\right)^{1/4}\right\},\end{eqnarray}$$
where
 $\unicode[STIX]{x1D708}=\unicode[STIX]{x1D707}/\!\left\langle \unicode[STIX]{x1D70C}\right\rangle _{y,z}$
and
 $\unicode[STIX]{x1D716}$
is the
 $(y,z)$
-plane averaged kinetic energy dissipation rate, also used in scaling the spectra, ensuring that
 $\unicode[STIX]{x1D702}>0.7\unicode[STIX]{x0394}x$
. Figure 14(a) plots
 $k_{max}\unicode[STIX]{x1D702}_{min}$
for seven density ratios. The simulations conserve mass to a fractional error of
 $\unicode[STIX]{x1D6FF}m/m\lesssim 10^{-8}$
, as shown in figure 14(b), where
 $m(t)$
is the total mass in the domain at time
 $t$
and
 $\unicode[STIX]{x1D6FF}m(t)=|m(t)-m(0)|$
.
(a) Plots of
 $k_{max}\unicode[STIX]{x1D702}_{min}$
for seven simulations and (b) total mass error (see text).

Appendix B. Flow sensitivity to initial conditions
To probe flow dependence on initial conditions, various initial density and velocity profiles and perturbations were tested. These tests were performed on
 $512^{3}$
grids.
Initial perturbations were chosen to be isotropic and calculated similarly to Cook & Dimotakis (Reference Cook and Dimotakis2001). A discrete two-dimensional random number field is convolved with a spatial Gaussian filter. The resulting field is Fourier transformed and filtered with a radial Gaussian function. The Fourier coefficients are then inverse transformed and used as the perturbation field,
 $\unicode[STIX]{x1D709}(y,z)$
, to offset
 $x$
locations of the initial density profile (2.8). The ratio of perturbation root mean square to initialized shear-layer width is in the range
 $0.36<(20\unicode[STIX]{x0394}x\unicode[STIX]{x1D709}_{RMS})/\unicode[STIX]{x1D6FF}_{\text{i}}<0.44$
, depending on grid size and density ratio, as referenced in the main text.
Spectra of the isotropic perturbation fields are taken in the radial direction and averaged in the polar direction. Three perturbation spectra were tested, labelled: ‘Pert1’, ‘Pert2’ and ‘Pert3’, in figure 15(a). The spectra (in figure 15 a) use different initial discrete random number fields and spectral Gaussian filter widths. The flow in this paper was initialized with Pert3.
To investigate the effects of the initial density profile, an error function (chosen for the simulations shown throughout this paper), a hyperbolic tangent function, and a numerical fit to the solution of (4.5) were used to represent density interfaces.
The sensitivity of the flow to the various initial conditions, is assessed in terms of the shear-layer width growth (figure 15 b). This illustrates that initial diffusive growth rates are similar in all cases studied. The shear-layer width slopes in this diffusive regime are very nearly 0.5, as predicted, with actual slopes in the range 0.4802–0.4881.
Transition times when the flow enters the turbulent regime depend on perturbations and initial profiles, with variations in
 $t_{tr}$
less than 10 %. The growth in the unsteady/turbulent regime depends weakly on initial conditions and differs (somewhat) between
 $512^{3}$
and
 $1024^{3}$
simulations. Other flow statistics studied, e.g. shear-layer composition p.d.f., mean shear-layer density, etc. are found to be statistically independent (or only weakly dependent) on the initial condition choices described above.
(a) Radial spectra of three initial perturbation fields tested in
 $512^{3}$
simulations, along with the initial perturbation spectra in the
 $1024^{3}$
simulations. (b) Shear-layer width growth in time for initial perturbations and initial profiles tested with
 $512^{3}$
grids. The
 $1024^{3}$
result is shown for comparison. Blue, magenta, red and green solid lines plot results from error function initial profiles with different perturbations. Yellow and red lines differ only by the initial random number field of the perturbation profiles. Yellow, cyan and green lines are initialized with Pert3. Results plotted derive from
 $R=10$
simulations.

Differences in statistics between two simulations with the same initial density field, but different initial velocity fields. (a) Pointwise
 $L_{2}$
-norms of the evolving velocity and density fields. (b) Evolving shear-layer width difference (B 2a
). Results in these plots are for
 $R=10$
simulations with
 $512^{3}$
grids.

While testing the effects of the initialized density field as the numerical fit to (4.5), the initial velocity field dependence was specifically probed. This was motivated by initial condition effects documented in Cook & Dimotakis (Reference Cook and Dimotakis2001), in which the flow was initialized with a diffusion-induced velocity deduced from their three-dimensional initial density profiles. Simulations were run with a zero initial velocity field, i.e.
 $\boldsymbol{u}_{\text{i}}=0$
, as in the simulations documented in the main text, as well as with
 $\boldsymbol{u}_{\text{i}}=\unicode[STIX]{x1D707}\unicode[STIX]{x1D735}(1/\unicode[STIX]{x1D70C})$
– the three-dimensional equivalent to (4.3) required by continuity by the initial three-dimensional density field. In the case of
 $\boldsymbol{u}_{\text{i}}=0$
, the pressure Lagrange multiplier generates the required fields after the first time step to satisfy continuity. The study below assesses the differences on the flow from the two initial velocity fields.
A discrete pointwise
 $L_{2}$
-norm was employed to study the sensitivity to the initial velocity, shown in figure 16(a), with
 $$\begin{eqnarray}L_{2,F}(t)=\left[\left(\frac{\unicode[STIX]{x0394}x}{L}\right)^{3}\mathop{\sum }_{l,m,n}|F_{lmn}(t)_{\boldsymbol{u}_{\text{i}}=\unicode[STIX]{x1D707}\unicode[STIX]{x1D735}(1/\unicode[STIX]{x1D70C})}-F_{lmn}(t)_{\boldsymbol{u}_{\text{i}}=0}|^{2}\right]^{1/2}.\end{eqnarray}$$
Each component of the velocity field and the density field were tested, with
 $$\begin{eqnarray}F(t)=\left\{\frac{u_{i}(t)}{\unicode[STIX]{x0394}W},\frac{\unicode[STIX]{x1D70C}(t)}{\unicode[STIX]{x0394}\unicode[STIX]{x1D70C}}\right\},\end{eqnarray}$$
where
 $\unicode[STIX]{x0394}\unicode[STIX]{x1D70C}$
is the difference between free-stream densities. The error is seen to decrease in the diffusive regime, but diverges as the flow enters the turbulent regime. Pointwise statistics, however, do not provide the appropriate error metric in the high-Lyapunov-exponent unsteady/turbulent regime. In that regime, a scaled difference of averaged quantities, such as shear-layer widths, rather than a pointwise metric, is computed,
 $$\begin{eqnarray}\unicode[STIX]{x0394}G(t)=|G(t)_{\boldsymbol{u}_{\text{i}}=\unicode[STIX]{x1D707}\unicode[STIX]{x1D735}(1/\unicode[STIX]{x1D70C})}-G(t)_{\boldsymbol{u}_{\text{i}}=0}|,\end{eqnarray}$$
with
 $$\begin{eqnarray}G(t)=\frac{\unicode[STIX]{x1D6FF}^{\ast }(t)}{\overline{\unicode[STIX]{x1D6FF}^{\ast }}(t)},\quad \unicode[STIX]{x1D6FF}^{\ast }(t)=\frac{\unicode[STIX]{x1D6FF}(t)}{\unicode[STIX]{x1D6FF}_{\text{i}}}\sqrt{\frac{t_{\text{i}}}{\unicode[STIX]{x1D70F}}},\end{eqnarray}$$
and
 $$\begin{eqnarray}\overline{\unicode[STIX]{x1D6FF}^{\ast }}(t)={\textstyle \frac{1}{2}}[\unicode[STIX]{x1D6FF}^{\ast }(t)_{\boldsymbol{ u}_{\text{i}}=\unicode[STIX]{x1D707}\unicode[STIX]{x1D735}(1/\unicode[STIX]{x1D70C})}+\unicode[STIX]{x1D6FF}^{\ast }(t)_{\boldsymbol{ u}_{\text{i}}=0}].\end{eqnarray}$$
The results are plotted in figure 16(b). The quantities differenced criss-cross each other in the turbulent regime, indicating the absence of a systematic statistical difference in time, with only a small fractional amplitude difference, even towards the end of the simulations, when rapid shear-layer growth occurs.
Effects from the differences in the initial velocity field are seen to be small, especially when compared to those resulting from the different initial density fields discussed above, which are also small.
There are many possible initialization choices. This section quantified the relative lack of initialization sensitivity of this flow, which may not hold for other flows. Investigation of the sensitivity to various initial condition choices was undertaken because a zero initial velocity does not satisfy the continuity equation (2.4). The initial condition choice was simple to implement and the inconsistency is lifted after the first 1–2 time steps through strict mass conservation, leaving no significant imprint on the flow.



