THE ROLE OF VOCABULARY IN PERCEPTUAL TUNING
Improvement in second-language (L2) perception has recently been posited to occur early in L2 learning when the learner’s L2 vocabulary is still small, whereas a large L2 vocabulary has been posited to curtail perceptual learning and lead to phonological fossilization (the perceptual assimilation model for SLA, or PAM-L2; Best & Tyler, Reference Best, Tyler, Munro and Bohn2007). This proposition is extended by introducing a new L2 developmental framework: the vocabulary-tuning model of L2 rephonologization (or vocab model for short). The model suggests that early L2 lexical development facilitates establishment of phonological categories in a manner analogous to children’s first-language (L1) acquisition before as opposed to after the vocabulary spurt. Recent findings on the role of vocabulary acquisition on L1 phonological development are reviewed before outlining the model and testing its predictions in two experiments.
VOCABULARY ACQUISITION AND L1 PERCEPTUAL TUNING
Studies of infant speech perception have firmly demonstrated that infants attend to phonetic differences from birth. They are able to discriminate most native and nonnative speech contrasts until their perceptual systems selectively attune to those of the surrounding language at approximately 5–6 months of age for vowels and at 8–10 months for consonants (Best & McRoberts, 2003; Best, McRoberts, & Sithole, Reference Best, McRoberts and Sithole1988; Kuhl, Reference Kuhl1983; Kuhl, Williams, Lacerda, Stevens, & Lindblom, Reference Kuhl, Williams, Lacerda, Stevens and Lindblom1992; Werker & Tees, Reference Werker and Tees1984). However, infants may initially be sensitive to the distributional properties of speech segments (e.g., Norris, McQueen, & Cutler, Reference Norris, McQueen and Cutler2000; Vitevich & Luce, Reference Vitevich and Luce1998) rather than actual phonetic or phonological categories themselves, and through vocabulary acquisition, this sensitivity is updated and refined to reflect the phonological system of the ambient language (see Pierrehumbert, Reference Pierrehumbert2003).
Additional support for the notion that vocabulary plays a central role in L1 phonological development comes from the relatively new research topic of early cross-dialect word recognition. Although infants and young toddlers are highly skilled at detecting differences in surface phonetic details that are important in their L1, they are not able to hear past irrelevant phonetic information (like dialect or speaker-specific variance) to perceive words on the basis of their underlying phonology—that is, they do not display phonological constancy. Best, Tyler, Gooding, Orlando, and Quann (Reference Best, Tyler, Gooding, Orlando and Quann2009) demonstrated the emergence of phonological constancy by observing cross-dialect word recognition in toddlers at 15 months, when vocabularies are small, versus 19 months, after the vocabulary spurt (see Metsala & Walley, Reference Metsala, Walley, Metsala and Ehri1998). They found that both 15- and 19-month-olds recognized familiar words in their native Connecticut accent, but only the older children successfully recognized the same words spoken in the markedly different and unfamiliar Jamaican Mesolect English accent.
There is also evidence that children in the early phase of word learning attend to more phonetic detail in L1 segmental speech discrimination tasks than in L1 word learning tasks. For instance, mispronounced words (such as gat for cat) are readily accepted by these young children (14 months), whereas the same contrasts that differentiate the original versus mispronounced word are well discriminated by infants of 8–10 months (Stager & Werker, Reference Stager and Werker1997). In contrast, word recognition of 19-month-olds is clearly affected by phonetic mispronunciations, so that they reject familiar words when one of the phonemes in the word has been replaced by another to create a mispronounced token of that word (Swingley, Reference Swingley2003).
These results indicate that early L1 words are learned and recognized by very young children in their detailed dialect-specific phonetic form rather than as structures built of higher order phonological properties. Successful cross-dialect recognition of otherwise familiar words, which reflects recognition of phonological constancy, appears to emerge only around the age of the vocabulary spurt, which occurs in the average child at approximately 18 months of age. Early attunement to ambient phonetic details and later attunement to the abstract phonological structure of familiar words together indicate that pressures from a rapidly increasing vocabulary drive the attunement to the higher order phonological structures in the language (Best & Tyler, Reference Best, Tyler, Munro and Bohn2007; Studdert-Kennedy, Reference Studdert-Kennedy, Allport, MacKay, Prini and Scheerer1987, Reference Studdert-Kennedy, Krasnegor, Rumbaugh, Schiefelbusch and Studdert-Kennedy1991). In other words, the increased vocabulary encourages the child to phonologize the phonetic properties of the input. This interpretation is further supported by evidence that children with larger L1 vocabularies perform better than children with smaller L1 vocabularies on tests of phonological awareness—in particular, in dense lexical neighborhoods (Metsala, Reference Metsala1999).
VOCABULARY ACQUISITION AND L2 PERCEPTUAL TUNING
The influence of vocabulary size on L1 phonological development raises questions about similar influences on L2 phonological development. It is necessary to detail how L2 vocabulary expansion might influence L2 phonological acquisition in a manner analogously to that of vocabulary expansion on L1 phonological acquisition detailed.
Most current theories of SLA assume that the language learning processes and mechanisms that children use when learning their L1 remain intact and accessible in later SLA—for example, the speech learning model (Flege, Reference Flege and Strange1995); PAM-L2 (Best, Reference Best, Goodman and Nusbaum1994, Reference Best and Strange1995; Best & Tyler, Reference Best, Tyler, Munro and Bohn2007); natural referent vowel framework (Bohn & Polka, Reference Bohn and Polka2001; Polka & Bohn, Reference Polka and Bohn1996, Reference Polka and Bohn2003); automatic selective perception model (Strange, Reference Strange2006, Reference Strange, Munro and Bohn2007a, Reference Strange2007b). According to the perceptual assimilation model (PAM)—which focuses on L1 acquisition—and PAM-L2, but not unique to these models, both L1 acquisition and subsequent SLA thus involve the attunement of the perceptual systems to the meaningful phonetic features and phonological structure and organization of the language spoken in the immediate environment. For a L1 learner, this entails tuning into those phonetic differences that differentiate meaning in the L1—that is, phonological distinctions, such as the difference between /b/ and /p/ in bet and pet—while learning to ignore those phonetic differences that do not differentiate meaning, such as the difference between /p/ in pet and /p/ in step. For a L2 learner, who has already acquired a L1, initial L2 perception is based on the phonetic similarity of the L2 and L1 phones rather than the abstract organization of the L2 phones themselves. This means that early L2 perception clearly reflects the L1 of the learner, such that native speakers of Japanese, for example, do not perceive the difference between rock and lock in English because their L1 does not make a distinction between /r/ and /l/.
Applying the principles of vocabulary size on phonological development on the L1 to L2 learning, PAM-L2 (Best & Tyler, Reference Best, Tyler, Munro and Bohn2007) further posits that L2 vocabulary size may be directly related to the development of L2 phonology: A larger L2 vocabulary may lead to fossilization in the perception of L2 phones and curtail further reattunement and rephonologization, resulting in decades of research observing that the learner is likely to settle on an accented version of the L2 phonology (i.e., a L2 phonology that is different from that of a native speaker of the L2).
Here, this view is revised and extended by introducing the vocab model (see also Bundgaard-Nielsen, Best, & Tyler, Reference Bundgaard-Nielsen, Best and Tyler2011), which predicts that L2 reattunement and rephonologization is actually facilitated by an expanding L2 vocabulary in the beginning period of SLA, specifically when the L2 is acquired through studying and living in a L2-speaking environment. The vocab model suggests that this reattunement and rephonologization happens in the same way in which the emergence of L1 phonological function appears to be driven by the vocabulary spurt in children at around 18 months or later (Metsala & Walley, Reference Metsala, Walley, Metsala and Ehri1998), with the obvious caveat that SLA is shaped by the past language experiences and, in particular, the L1 of the learner. The vocab model specifically asserts that the establishment of an initial L2 vocabulary forces the learner to attune to articulatory, phonetic, and phonological differences in the L2 that have previously been ignored in the L1—to more efficiently and effortlessly understand L2 speakers. Individual linguistic aptitude aside, this linguistic pressure is particularly strong when several contrastive L2 phones are initially assimilated into the same L1 category. Indeed, the learner may develop his or her L2 as a result of confusions that subsequently arise from the activation of several competing lexical items in the learner’s L2 vocabulary (Cutler & Otake, Reference Cutler and Otake2004; Cutler, Weber, & Otake, Reference Cutler, Weber and Otake2006).
This reattunement of the perceptual systems ideally leads to the formation of phonological categories that correspond (closely) to those in the L2—even though it has been established that this is not always the case, due to L1-L2 interactions. PAM and its extension PAM-L2 make a series of clear predictions for how a learner will perceive nonnative and L2 contrasts. In particular, it is predicted that a learner will experience the following:
1. little difficulty when L2 contrasts are perceived as instances of two separate native phonological categories (a two-category assimilation);
2. greater difficulty when a nonnative contrast is perceived as belonging to the same L1 phonological category, but one being a better version than the other (a category goodness assimilation);
3. the greatest degree of difficulty when a nonnative contrast is perceived as equally good (or even identical) versions of a single L1 category (a single category assimilation).
It may also be the case that the reattunement of the perceptual system follows different trajectories for vowels and consonants because of differences in how they are perceived and produced.
The vocab model predicts that learners with a larger L2 vocabulary will be further along in the SLA process and thus will have better reattunement and rephonologization, such that they more consistently assimilate L2 phones to their L1 categories—or to new L2 categories—and more fully exploit their native L1 inventory in their early identification of L2 phones. Consistent assimilation refers to two behavioral measures: First, a significantly higher number of nonnative phones will be assimilated into native categories (i.e., identified as members of a specific L1 category in a forced-choice task) by learners with larger L2 vocabularies. Second, a higher assimilation score (percentage of L2-target tokens assimilated to a given L1 category) will be obtained for assimilated phones in the learners with larger vocabularies. The vocabulary-growth hypothesis (i.e., the vocab model) also predicts that learners who are further along in the SLA process will more successfully discriminate nonnative contrasts that are difficult for naïve and less proficient speakers of the L1, whose L2 perception is still dominated by superficial phonetic similarities between the L2 phones and the L1 categories. This is particularly the case for the PAM category goodness (CG) contrasts, where two phonemes are perceived as being members of the same phonological category but differing in the goodness of the category match. This could be possible for the PAM uncategorized-categorized (UC) contrasts, where one phoneme is perceived as belonging to a particular phonological category, whereas the other falls outside of the phonological inventory. Additionally, this vocab model prediction could even fit the PAM uncategorized-uncategorized (UU) contrasts where both phonemes are uncategorized. However, such a prediction may not necessarily be the case for the PAM single-category (SC) contrasts because both phonemes are perceived as equally good instances of the same phonological category. In contrast, less proficient listeners are also less likely to show difficulties for PAM two-category (TC) contrasts, where the phonemes are already perceived as belonging to separate phonological categories, which even very inexperienced learners have already successfully teased apart, simply by reference to their L1 vowel contrasts.
One recent study found preliminary support for the role of L2 vocabulary expansion in changes to L2 vowel perception (Bundgaard-Nielsen et al., Reference Bundgaard-Nielsen, Best and Tyler2011; see also Bundgaard-Nielsen, Best, & Tyler, Reference Bundgaard-Nielsen, Best and Tyler2008). In this study, native Japanese learners of Australian English (AusE; N = 11) who had spent less than 12 weeks in Australia (M = 7) mapped all 18 AusE vowels /iː, ɪ, e, eː, ɜː, ə, æ, ɐ, ɐː, oː, ʊ, ʉː, ɔ, ɪə, æɪ, ɑe, oɪ, əʉ, æɔ/ (see Cox, 2006), presented in a /hVba/ nonsense word in sentence and citation form, to their native phonological system. They were allowed to select from all possible Japanese monomoraic and bimoraic vowel categories (/i, iː, e, eː, a, aː, u, uː, o, oː/) and all permissible pairwise combinations of monomoraic vowels (/ie, ia, iu, io, ei, ea, eu, eo, ai, ae, au, ao, ui, ue, ua, uo, oi, oe, oa, ou/). This approach allowed the learners to exploit all native sensitivities in identifying the L2 vowels without making assumptions about their L2 phonology. The learners with larger L2 vocabularies (M = 7,200 words, as measured by the vocabulary size test of Nation and Beglar, 2007) showed more consistent use of their L1 categories in identifying L2 vowels (13 consistently assimilated vowels: 85% identification in sentence presentation, 80% identification in citation form), in comparison with learners with smaller vocabularies (M = 5,017 words; 12 consistently assimilated vowels: 73% identification in sentence presentation, 74% identification in citation form). The two subgroups, importantly, were otherwise comparable in terms of duration of their stay in the L2 speaking country, English instruction in Japan, age, and L1 or L2 usage patterns at the time of testing.
To confirm the relationship between L2 segmental perception and L2 vocabulary size and to further detail this developmental trajectory, two experiments are presented that probe the underpinnings of this pattern more deeply and broadly. The first experiment substantially extends the previous study (Bundgaard-Nielsen et al., Reference Bundgaard-Nielsen, Best and Tyler2011) of the relationship between L2 vocabulary size and L2 vowel assimilation in speakers of Japanese who are acquiring AusE through extended stays in Australia. The results from the previous study indicate that Japanese L2 learners of English are an extremely well-suited group to test because they (surprisingly) exploit a large number of L1 vowel categories and combinations in the assimilation of L2 English vowels. It is expected that larger vocabularies will be correlated with better L2 perception in terms of better L2 vowel contrast discrimination as well as more consistent L2 assimilation to L1 categories. Additionally, systematic relationships between assimilation patterns and discrimination, as predicted by PAM (e.g., Best, Reference Best and Strange1995), are expected.
The second experiment examines the developmental changes in L2 perception and vocabulary size in the first 6–8 months of acquisition in a group of Japanese L2 English learners in Australia. An increase in L2 vocabulary size is predicted along with associated improvements in the percentage of correctly discriminated AusE vowel contrasts and in the consistency of the L2-L1 assimilations between the two testing times.
EXPERIMENT 1: VOCABULARY SIZE AND L2 SEGMENTAL PERCEPTION IN NEWLY IMMERSED ADULT L2 LEARNERS
Method
Participants. The participant group consisted of 31 native speakers of Japanese (8 male; M = 23.8 years of age; range: 19–34 years). They were studying English as a L2 at an English college in Sydney or following a general studies course at the University of Technology or the University of New South Wales in Sydney. All had spent fewer than 3 months in Australia (M = 6 weeks; range: 1–12 weeks) but had received English instruction in Japan, typically by native speakers of Japanese (M = 9 years; range: 6–18 years) but with occasional input from native speakers of various dialects of English (Australian, American, British, Irish, and New Zealand).
Stimuli. The stimuli used in this study were the citation-form disyllables (C) used in Bundgaard-Nielsen et al. (Reference Bundgaard-Nielsen, Best and Tyler2011): Eight male L1 Western Sydney AusE speakers (M = 22.7 years of age; range: 18–25 years) produced five randomized repetitions of the AusE stressed monophthongs in a first syllable stressed /hVba/ context in isolation. The /hVba/ context was chosen to minimize any effect of consonant coarticulation on the vowels (Strange, Weber, Levy, Shafiro, Hisagi, & Nishi, Reference Strange, Weber, Levy, Shafiro, Hisagi and Nishi2007), as the glottal /h/ and bilabial /b/ do not involve the tongue. The speakers were instructed to use an informal speaking style and to speak at a normal conversational rate. Three speakers were selected on the basis of auditory judgments of similar voice quality, reading style, and speed by two phonetically trained experimenters. Three tokens of each vowel were selected for the perceptual study from each of those three speakers on the basis of similar intonation pattern and speaking rate, which yielded a total of 162 individual tokens (for acoustic details of these vowels, see Bundgaard-Nielsen et al., Reference Bundgaard-Nielsen, Best and Tyler2011). Four AusE vowel contrasts were selected for discrimination by the Japanese participants. These contrasts were selected on the basis of the assimilation results from Bundgaard-Nielsen et al. to test the discrimination predictions for four different PAM contrast types (see, e.g., Best, Reference Best and Strange1995): the SC contrast /iː/-/ɪə/, the TC contrast /iː/-/ɪ/, the UC contrast /ɜː/-/ʉː/, and the UU contrast /əʉ/-/oː/. Bundgaard-Nielsen et al. did not indicate any likely CG difference contrast for Japanese listeners, so it was not included in the present study to test the PAM-L2 and vocab model predictions for it. Stimuli were presented over headphones from a MacBook computer using PsyScope X software (Bonatti, Reference Bonatti2007).
Predictions
The general assimilation pattern of AusE vowels to Japanese vowel categories was expected to reflect the perceptual similarities between the learners’ two vowel systems. In this way, short AusE vowels (/ɪ, e, ɐ, ɔ, ʊ/) would be assimilated into perceptually similar monomoraic Japanese vowel categories (/i, e, a, o, u/, respectively). Additionally, long AusE vowels (/iː, eː, ɐː, oː, ʉː/) would most likely be assimilated into perceptually similar bimoraic Japanese vowel categories (/iː, eː, aː, oː, uː/, respectively). Additionally, in the same direction with the results from the previous study (Bundgaard-Nielsen et al., Reference Bundgaard-Nielsen, Best and Tyler2011), some AusE diphthongs (such as /eɪ, ɑe, oɪ/) were expected to be readily assimilated into Japanese bimoraic combinations (such as /ei, ai, oi/, respectively).
For this investigation, the L2-L1 assimilation consistency in terms of the number of assimilated L2 vowels and average assimilation percentage was expected to be higher for those Japanese learners who had larger L2 vocabularies than for those with smaller L2 vocabularies. Thus, participants with smaller vocabularies were expected to be at an earlier stage of their L2 perceptual reattunement and rephonologization process than learners with larger L2 vocabularies. This prediction was expected to be borne out, even though the two Japanese subgroups did not differ on any other potentially relevant dimension.
With reference to PAM, the following patterns of discrimination were expected:
1. The overall discrimination of the SC contrast /iː/-/ɪə/ was expected to be at the near-chance level. This expectation is further supported by recent evidence for a near merger of these two vowels in Western Sydney AusE (see Bundgaard-Nielsen, Best, Tyler, & Kroos, Reference Bundgaard-Nielsen, Best, Tyler and Kroos2008).
2. For the spectrally similar but durationally different TC contrast /iː/-/ɪ/, discrimination was predicted to be excellent.
3. For the UC contrast /ɜː/-/ʉː/, discrimination was expected to be good to excellent. Excellent discrimination would be expected in the case in which there is a clear native category boundary between the two phones (i.e., a L1 phonological difference). Lesser discrimination accuracy would be expected for a case in which the uncategorized vowel in both members of the pair shares some perceptual similarity with the L1 phone to which the categorized phone in the UC pair is assimilated.
4. Finally, discrimination of the UU contrast /əʉ/-/oː/ was expected to be moderate, reflecting some degree of overlap in the identification pattern for these two vowels in Bundgaard-Nielsen et al. (Reference Bundgaard-Nielsen, Best and Tyler2011).
In line with the expectation for assimilation consistency, learners with a larger L2 vocabulary were expected to display higher discrimination accuracy than those with a smaller vocabulary. This vocabulary size effect was not expected to extend to the discrimination of the SC /iː/-/ɪə/ contrast, as PAM-L2 and the vocab model predict great difficulty in reattuning to differences between the phones in a SC contrast. L2 vocabulary size was also expected to have a smaller effect on the TC /iː/-/ɪ/, as this contrast type, according to PAM-L2 as well as the vocab model, is already well differentiated by even the least experienced and smallest vocabulary L2 learners.
Procedure
All participants were tested in a quiet, sound-attenuated experiment room at MARCS Auditory Laboratories at the University of Western Sydney. The participants first heard a randomized presentation of all AusE disyllables in citation form (n = 324). They identified each AusE token’s stressed (first) vowel in terms of their L1 vowels and permissible combinations on a computer screen, using a grid of Japanese katakana symbols representing all possible short, long, and combination vowels in a /hV/ context. They also rated the goodness of fit of the AusE token to the L1 vowel selected on a scale from 1 (poor) to 7 (excellent).
Following the assimilation study, all participants discriminated the AusE contrast pairs /iː/-/ɪə/, /iː/-/ɪ/, /ɜː/-/ʉː/, and /əʉ/-/oː/ in an AXB discrimination task. In AXB discrimination, the participants are always presented with three tokens—the first and last always belong to different categories. The middle token belongs to either the first or the last category, and the participant must indicate (by pressing labeled keys) if the middle token belongs to the same category as the first or last token. The order of presentation of the four contrast pairs was counterbalanced across participants.
Upon completion of the perceptual tasks, the participants completed a multiple-choice L2 English vocabulary size test (Nation & Beglar, Reference Nation and Beglar2007).
Results
The 31 participants had a mean vocabulary size of 6,452 words (range: 4,600–8,700 words), estimated on the basis of the vocabulary size test (Nation & Beglar, Reference Nation and Beglar2007). The participants were split into a high-vocabulary (HV) and a low-vocabulary (LV) group with 6,000 words as the threshold, following evidence that comprehension of a minimum of 6,000–7,000 English words is needed to sufficiently understand spoken conversational English (Nation, Reference Nation2006). Significant vocabulary-related differences in L2 segmental perception for speakers with a L2 vocabulary above (HV) and below (LV) 6,000 words had also been found in Bundgaard-Nielsen et al. (Reference Bundgaard-Nielsen, Best and Tyler2011).
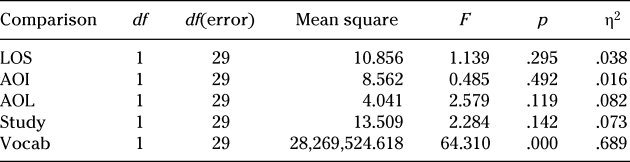
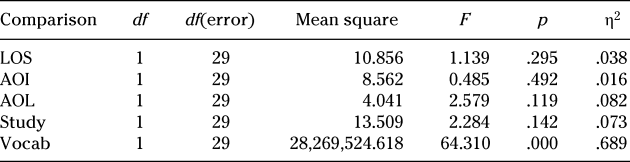
The LV L2 group consisted of 12 participants who had a mean vocabulary of 5,250 words (range: 4,600–5,900), whereas the HV L2 group consisted of 19 learners who had an average L2 vocabulary of 7,211 words (range: 6,300–8,700). A series of one-way ANOVAs (see Table 1) revealed that this difference in vocabulary size was significant, but there were no significant differences between the two groups in terms of their age of English immersion, the age at which they had started to learn English in Japan, the number of years they had studied English in Japan, or the duration of their stay in Sydney, Australia.
Vocabulary group comparisons
Note
LOS = length of stay in Australia, AOI = age of immersion in English, AOL = age of learning onset, Study = number of years of L2 study, Vocab = L2 vocabulary size, df = degrees of freedom.
Assimilation and Goodness Ratings
Assimilation Criterion of 50%. A L2 vowel was defined as categorized if it was assimilated as an instance of a particular L1 category in more than 50% of instances—a fairly lenient criterion. This 50% criterion was applied for a number of reasons: First, and despite observations that nativelike performance is often considered to be discrimination above 90%, it was hypothesized that a 90% criterion may be too strict for vowel research because of the continuous nature of vowel perception. Second, imposing a more stringent criterion may lead to even native speakers appearing to have difficulty in systematically identifying vowels in their own language (see Bundgaard-Nielsen, Best, & Tyler, Reference Bundgaard-Nielsen, Best, Tyler and Kroos2008). Third, this lenient criterion was chosen in recognition of the complexity of the task presented to the Japanese learners of selecting, for each AusE vowel, from a grid of 35 Japanese katakana symbols.
Because of the high consistency between the participants’ individual assimilation patterns, a L2 vowel was considered assimilated if the average of all participants’ assimilations reached the 50% criterion, even if not every individual participant reached the assimilation criterion (following Bundgaard-Nielsen et al., Reference Bundgaard-Nielsen, Best and Tyler2011). An assimilation matrix on the basis of all 31 participants’ responses revealed that a total of 14 out of 18 AusE vowels (/ɪ, e, ɐ, ɔ, ʊ, iː, ɪə, eː, ɐː, oː, ʉː, ɑe, æɪ, oɪ/) were successfully assimilated to Japanese vowel categories, whereas only 4 vowels (/ɜː, æ, æɔ, əʉ/) remained unassimilated (uncategorized). The average assimilation score for each assimilated vowel ranged from 63% (for AusE /ʊ/) to 92% (for AusE /ɐː/), with an average assimilation score of 75% for the 14 assimilated AusE vowels. The average goodness rating (i.e., the goodness of fit of the nonnative phone to the native category) for those assimilated vowels was 5.12 (range: 4.75–5.46) out of a maximum of 7.
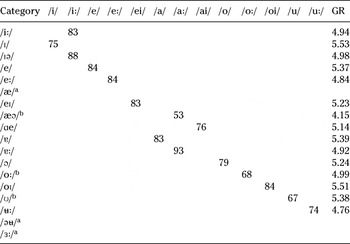
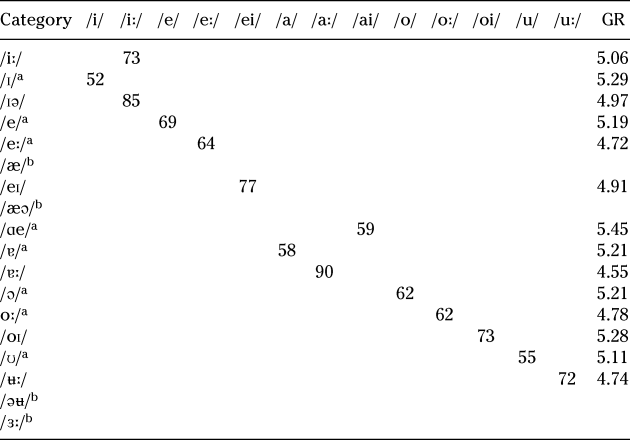
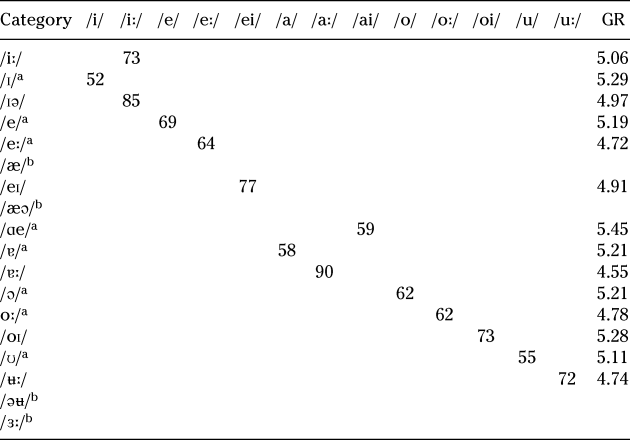
When the participants were divided into a HV and a LV group, systematic differences in the degree of success in their assimilation behavior emerged. However, the overall pattern of assimilable versus unassimilable vowels remained consistent across the two groups. The HV group (see Table 2) successfully assimilated 15 AusE vowels (/ɪ, e, ɐ, ɔ, ʊ, iː, ɪə, eː, ɐː, oː, ʉː, ɑe, æɪ, æɔ, oɪ/), with an average assimilation percentage of 77% (range: 53% for AusE /æɔ/ to 93% for AusE /ɐː/). The average goodness rating was 5.09 out of 7. Only 3 vowels remained unassimilated by the HV group (/ɜː, æ, əʉ/). The LV group assimilated 14 AusE vowels to native categories (/ɪ, e, ɐ, ɔ, ʊ, iː, ɪə, eː, ɐː, oː, ʉː, ɑe, æɪ, oɪ/ but not AusE /æɔ/; see Table 3). Nevertheless, their average assimilation percentage was significantly lower than that of the HV group, at only 68% (range: 52% for AusE /ɪ/ to 90% for AusE /ɐː/, t(13) = 3.02, p < .05). The average goodness rating for the LV group was 5.03, which was not significantly different to that of the HV group, t(13) = 0.589, p = .566.
Assimilation pattern and goodness ratings for the HV group

Note
Numbers represent the percentage of each AusE vowel assimilated to specific Japanese vowel categories, averaged over participants. Goodness ratings (GR) were ranked on a scale of 1–7.
a Uncategorized using a 50% assimilation criterion.
b Uncategorized using a 70% assimilation criterion.
Assimilation pattern and goodness ratings for the low vocabulary group
Note
Numbers represent the percentage of each AusE vowel assimilated to specific Japanese vowel categories, averaged over participants. Goodness ratings (GR) were ranked on a scale of 1–7.
a Uncategorized using a 70% assimilation criterion.
b Uncategorized using a 50% assimilation criterion.
Assimilation Criterion of 70%. Because the lenient nature of the 50% assimilation criterion differs from the approach in many other studies (Strange et al., 1998, for instance, used modal categories), the assimilation pattern of the two Japanese learner groups was reanalyzed with a more stringent 70% assimilation criterion.
Through the application of the more stringent 70% assimilation criterion (see Tables 2 and 3), the group differences in the number of L2 AusE vowels successfully assimilated are much more striking: Whereas the HV group assimilated 12 of the 18 vowels (M = 82%, range: 74% for AusE /ʉː/ to 93% for AusE /ɐː/), the LV group successfully assimilated only 6 AusE vowels (M = 78%, range: 72% for /ʉː/ to 90% for /ɐː/).
Discrimination Predictions on the Basis of the Pattern of Assimilation
On the basis of the assimilation patterns from the previous study (Bundgaard-Nielsen et al., 2011) and confirmed by the pattern of assimilation in the present study, different PAM assimilation types were identified for specific vowel pairs. The contrast /iː/-/ɪə/ was a PAM SC assimilation. For this vowel pair, very poor discriminability was predicted. The contrast /iː/-/ɪ/ was confirmed to be a TC assimilation. For this vowel pair, discrimination was expected to be excellent. The contrast /ɜː/-/ʉː/ was also confirmed to be a UC assimilation by the assimilation pattern identified in the current study. For this vowel pair, discrimination was expected to be good to excellent (depending on the perceptual distance between the two). Finally, the assimilation pattern for both subgroups of Japanese learners revealed that the predicted UU assimilation of /əʉ/-/oː/ was actually a UC contrast—henceforth UU-UC, as the long vowel /oː/ reached the 50% assimilation criterion and was categorized as long Japanese /oː/. Discrimination for this contrast was expected to be fair to good, again reflecting the perceptual distance between the two vowels.
AXB Discrimination
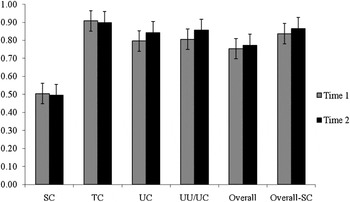
The combined discrimination results from the 31 participants are partially compatible with the predictions following from the assimilation study. The results revealed good discrimination of the TC contrast /iː/-/ɪ/ (79% correct discrimination), the UC contrast /ɜː/-/ʉː/ (83% correct discrimination), and fair discrimination of the UU-UC contrast /əʉ/-/oː/ (76% correct discrimination). The discrimination of /iː/-/ɪ/ was thus more problematic than expected, perhaps reflecting the fact that the durational relationship between the two vowels is somewhat smaller in AusE than the durational difference between a single and bimoraic vowel in Japanese. The discrimination of /ɜː/-/ʉː/ and /əʉ/-/oː/ was consistent with the PAM-L2 predictions and indicates that the perceptual distance from /ɜː/-/ʉː/ is greater than that from /əʉ/-/oː/ for native speakers of Japanese. The discrimination for the predicted SC assimilation /iː/-/ɪə/ was instead at chance level (50% correct discrimination), as predicted by PAM-L2, on the basis of the SC assimilation pattern that involved highly overlapping L1 vowel categorizations for this pair.
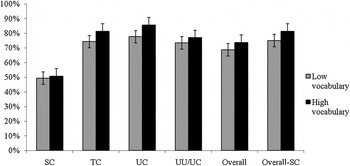
A 2 × 4 ANOVA was conducted on the percent correct discrimination scores. There was one between-group factor, L2 Vocabulary Size, with two levels (HV and LV) and one within-group factor, Contrast, with four levels (SC, /iː/-/ɪə/; TC, /iː/-/ɪ/; UC, /ɜː/-/ʉː/; and UU-UC, /əʉ/-/oː/). An alpha level of .05 was used for all analyses unless specified. Mean percent correct discrimination scores, split by L2 vocabulary size and by contrast, are presented in Figure 1. There were significant main effects of contrast, F(3,87) = 78.71, p < .001, ηp2 = .73, and L2 vocabulary size, F(1, 29) = 4.44, p < .05, ηp2 = .13, but no significant interaction, F(3, 87) = 0.90, p = .447.
Discrimination accuracy for the contrasts SC (/iː/-/ɪə/), TC (/iː/-/ɪ/), UC (/ɜː/-/ʉː/), and UU/UC (/əʉ/-/oː/), overall discrimination score, as well as overall discrimination score without the SC contrast for the HV and LV groups. Error bars reflect the standard error of the mean.

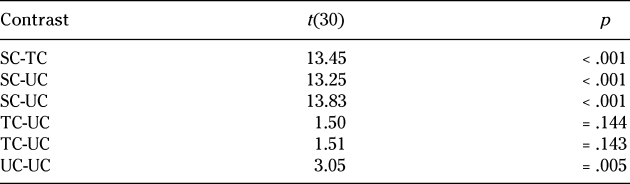
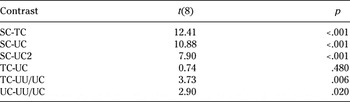
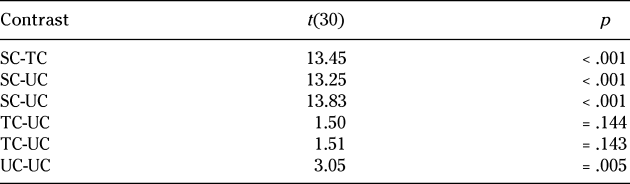
To test for differences between discrimination of the four contrasts, six post hoc paired samples t tests with a Bonferroni-adjusted alpha level of .008 were conducted. As there was no interaction between contrast and L2 vocabulary size in the 2 × 4 ANOVA, the two vocabulary groups were combined for these analyses, which are presented in Table 4. This effect of contrast was due to the difference in discrimination scores between SC /iː/-/ɪə/ and the three other contrasts TC /iː/-/ɪ/, UC /ɜː/-/ʉː/, and UU-UC /əʉ/-/oː/, as well as a difference in the discrimination of the UC /ɜː/-/ʉː/ and UU-UC /əʉ/-/oː/ contrasts but not for the TC /iː/-/ɪ/ versus UC /ɜː/-/ʉː/ contrast.
Discrimination difference of AusE vowel contrasts
Discussion
The results of Experiment 1 supported the vocab model hypothesis that L2 vocabulary drives the reattunement of the perception of L2 phones. L2 learners with larger L2 vocabularies more consistently assimilated L2 vowels to L1 vowel categories and more successfully discriminated L2 vowel contrasts.
The clear difference in assimilation consistency for the LV group and the HV group in particular, but also the difference in the number of L2 vowels assimilated to L1 categories by the HV and LV groups, is consistent with the vocabulary growth hypothesis that L2 vocabulary expansion drives changes to L2 segmental perception, which reflects better reattunement and rephonologization. An even clearer pattern of results was obtained when a more stringent 70% assimilation criterion was applied. The number of categorized AusE vowels for the LV group decreased from 14 categorized vowels to only 6, but the number of categorized vowels for the HV group only decreased from 15 to 12.
In a similar manner, the HV group scored higher on discrimination than the LV group, further supporting the PAM-L2 hypothesis about the role of L2 vocabulary expansion in L2 segmental reattunement and rephonologization. Furthermore, the overall pattern of accuracy for the four contrasts in the discrimination task reflected the PAM-based predictions for the perceived similarity of the AusE L2 phones relative to the L1 Japanese vowel inventory.
As expected, the overall assimilation pattern of AusE vowels to Japanese vowel categories reflected the perceptual similarities between the two vowel systems in which short AusE vowels were assimilated to monomoraic Japanese vowels of similar spectral qualities, whereas long AusE vowels were assimilated to bimoraic Japanese vowels of similar spectral qualities. Additionally, some AusE diphthongs were assimilated to bimoraic combinations of two Japanese monomoraic vowels. The general assimilation pattern thus reflects previous findings with Japanese learners of AusE (Bundgaard-Nielsen et al., Reference Bundgaard-Nielsen, Best and Tyler2011) and, to some extent, findings with native Japanese learners of American English (Strange et al., Reference Strange, Akahane-Yamada, Kubo, Trent, Nishi and Jenkins1998) where L2-L1 assimilation was also partially predicted by spectral similarities. Strange et al., however, had not provided the learners with the full set of native single, bimoraic, and bimoraic combinations available to the participants in the current study, perhaps limiting their responses. Strange et al. also found that their Japanese learners did not typically use bimoraic native categories for American English vowels presented in words in citation—but did in sentence presentation. This pattern was not observed for Japanese learners of AusE in the present study, in which the HV group assimilated 8 out of 18 of the AusE vowels in citation-form nonsense disyllables to Japanese bimoraic vowels or bimoraic combinations. The pattern was not observed in Bundgaard-Nielsen et al. either, in which AusE vowels were presented in disyllabic nonsense words both in citation and in sentence embeddings.
One noteworthy difference in the overall assimilation pattern presented here and in Bundgaard-Nielsen et al. (Reference Bundgaard-Nielsen, Best and Tyler2011) is that AusE /oː/ was successfully categorized as Japanese /oː/ in this study (HV 68% assimilation, LV 62% assimilation), whereas it only approached assimilation in Bundgaard-Nielsen et al. With the 70% assimilation criterion, however, AusE /oː/ is no longer categorized in either study. A likely explanation for the difference in results between the present study and the previous is a more advanced perceptual reattunement and rephonologization process in the learners of the present study, possibly due to the reported larger average L2 vocabulary of the learners in this study or to random sampling variations. This is compatible with the predictions of the vocabulary-growth hypothesis that learners with larger L2 vocabularies will perform better or more consistently on L2 segmental assimilation and L2 segmental discrimination tasks than learners with smaller L2 vocabularies.
This study supports the vocab model hypothesis that L2 vocabulary growth drives reattunement of the perception of L2 phones and the PAM prediction that L2 assimilation and relative ease of discrimination of the chosen L2 contrasts reflect the perceived similarities between the L1 and L2. However, to systematically examine change in L2 vocabulary size and L2 vocabulary in the first half-year of L2 learning in a L2-speaking environment, a longitudinal study with Japanese learners of English was also conducted.
EXPERIMENT 2: CHANGE IN L2 VOWEL PERCEPTION IN L2 LEARNERS IN THE FIRST 6 MONTHS OF L2 IMMERSION
The role of vocabulary size on segmental perception in L2 learners over the course of the first 6–8 months of L2 learning in a L2-speaking environment was tested. Two contrasting hypotheses were tested. The first hypothesis is based on previous observations that extended L2 exposure and use, along with limited L1 use, leads to improved L2 perception in the early phase of adult L2 acquisition (i.e., in the first 6–8 months of immersion; see Tsukada et al., Reference Tsukada, Birdsong, Bialystok, Mack, Sung and Flege2005). Although this definition of early phase is somewhat arbitrary and the perceptually important early phase may be much shorter in an intensive study-abroad situation, this period proposed as early is much more restricted than that typically considered in L2 research. This early-phase hypothesis predicts that L2 learners, irrespective of their L2 vocabulary size, are likely to improve their L2 perception in the first 6–12 months of L2 learning in a L2-speaking environment.
The second hypothesis is consistent with the vocab model. It predicts that improvement in L2 perception is associated with L2 vocabulary expansion in L2 learners with small L2 vocabularies. This hypothesis predicts the complementary outcome that, despite increased L2 exposure duration, L2 learners with larger L2 vocabularies (e.g., an average of more than 6,000 words) at the beginning of the intense exposure period will not improve their L2 perception.
Method
Participants. All 31 participants from Experiment 1 were invited to return to the University of Western Sydney for a second testing session approximately 6 months after their arrival in Australia and at least 3 months after the first testing session, but only 10 Japanese participants (3 male and 7 female; M = 23.2 years of age) were available to participate in a second testing session. One of these 10 participants was discarded from the analyses for not following test instructions consistently during the second test session. The 9 remaining Japanese participants had an average vocabulary size of 6,722 words (range: 5,200–8,100) in the first testing session, when they had spent an average of 5.45 weeks (range: 4–8 weeks) in Sydney. Seven of the 9 participants were from the HV group of Experiment 1.
At the time of the second testing session, the 9 participants had spent an average of 27.8 weeks (range: 22–34 weeks) in Australia and had an average L2 vocabulary size of 7,400 words (range: 5,600–8,700), with only 1 of the 9 participants still having a L2 vocabulary under 6,000 words. This reflected a significant average vocabulary gain of approximately 700 words in just over 22 weeks of additional L2 exposure and learning, t(8) = 3.52, p < .01.
Stimuli and Procedures. The stimulus materials used in Experiment 2 were identical to those in Experiment 1. All testing was conducted at MARCS Auditory Laboratories or at a quiet off-campus location.
Predictions. The general L2 assimilation pattern was expected to reflect the perceptual similarities and differences of the learners’ specific L1-L2 combination at both testing times. In line with the predictions for the HV-LV group differences in Experiment 1, poorer assimilation consistency and poorer L2 phone discrimination for learners at test time 1 than at test time 2 were expected. In other words, the learners were presumed to have acquired a larger L2 vocabulary and to have further reattuned and rephonologized, leading to improved performance on the assimilation and discrimination tests. This effect of extended intensive exposure and furthered L2 vocabulary acquisition and L2 vowel rephonologization might not improve the discrimination of the SC /iː/-/ɪə/ contrast, as PAM predicts great difficulty in reattuning to differences between the phones in a SC contrast even after extended exposure. The additional time in Australia was also expected to have a small effect on the TC /iː/-/ɪ/, as this contrast type, according to PAM, is already well differentiated (i.e., perceived as instances of two separate categories) even by beginning L2 learners.
The discrimination of the four L2 contrasts was further anticipated to follow the predictions outlined in PAM: The discrimination of the SC contrast /iː/-/ɪə/ was expected to be at chance level, the discrimination of the durationally different but spectrally similar TC contrast /iː/-/ɪ/ would be excellent, and the discrimination of the UC contrast /ɜː/-/ʉː/ would be moderate to good. Finally, the discrimination of the predicted UU contrast /əʉ/-/oː/ was expected to be either poor to moderate if both vowels were uncategorized by this particular group of learners, or moderate to good if it was indeed revealed to be another UC contrast, as was the case in Experiment 1 of the present study with the 50% assimilation criterion. The average L2 vocabulary size of the participants was anticipated to predict the classification of the /əʉ/-/oː/ contrast so that participants with a large average L2 vocabulary would be more likely to reach the criterion of 50%, and perhaps even the more demanding 70% criterion, for the vowel /oː/.
Results
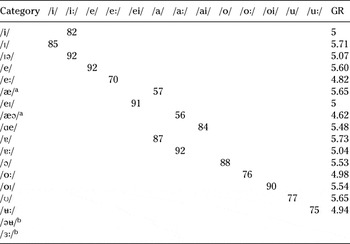
Assimilation and Goodness Rating Time 1. Using the lenient 50% assimilation criterion for the averaged participants, the responses from these 9 participants at the first test session revealed that 16 of 18 AusE vowels were successfully assimilated to Japanese vowel categories at the first testing session, whereas only 2 vowels (/ɜː, əʉ/) remained unassimilated (see Table 5 for assimilation pattern and goodness ratings). The average assimilation score ranged from 57% (for /æ/, which was uncategorized in Experiment 1) to 92% for /ɐː/, /ɪə/, and /e/, with an average assimilation score of 81% and an average goodness rating of 5.27. The assimilated vowels also included AusE /oː/, again changing the PAM contrast classification for /əʉ/-/oː/ from an UU to a second UC contrast as in Experiment 1.
Assimilation pattern and goodness rating at time 1 for the 9 participants of Experiment 2

Note
GR = goodness rating.
a Uncategorized using a 70% assimilation criterion.
b Uncategorized using a 50% assimilation criterion.
Using the more stringent 70% assimilation criterion, a total of 14 AusE vowels were successfully assimilated to Japanese vowel categories, with an average assimilation score of 84% (range: 70% for /eː/ to 92% for /ɐː/, /ɪə/, and /e/). The average goodness rating was 5.35 out of 7.
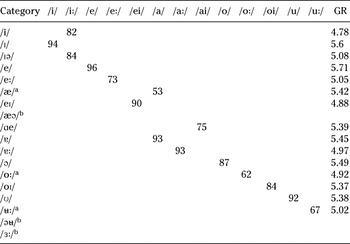
Assimilation and Goodness Rating Time 2. Applying the 50% criterion to the results from the second test session, an assimilation matrix on the basis of the responses from the 9 participants at the second test session revealed that 15 of 18 AusE were assimilated to Japanese vowel categories (see Table 6 for assimilation pattern and goodness ratings). The average assimilation score was 82% (range: 53% for /oː/ to 96% for /e/), with an average goodness rating of 5.24 out of a maximum of 7. Three AusE vowels (/ɜː, æɔ, əʉ/) were not categorized, including AusE /æɔ/, which was categorized as Japanese /ɐː/ (57%) in Experiment 1.
Assimilation pattern and goodness rating at time 2 of Experiment 2

Note
GR = goodness rating.
a Uncategorized using a 70% assimilation criterion.
b Uncategorized using a 50% assimilation criterion.
A reanalysis using the more stringent 70% assimilation criterion, however, revealed only a total of 12 AusE vowels to be successfully assimilated to Japanese categories at the second testing session, with an average assimilation score of 87% (range: /eː/ 73% to 96% for /e/) and an average goodness rating of 5.26 out of 7.
Because AusE /æɔ/ was not categorized at either testing session, the scores from that vowel were excluded from the following analyses. A series of paired samples t tests revealed that the difference in the average assimilation scores between test times 1 and 2 was not significant using the 50% assimilation criterion, t(14) = 0.431, p = .673, nor was the difference in goodness rating, t(14) = 0.561, p = .584. Likewise, the difference in the average assimilation scores between test times 1 and 2 was not significant using the 70% assimilation criterion (excluding the scores from AusE /oː/ and /ʉː/, which were not categorized at either testing session), t(11) = 0.537, p = .602. The difference in goodness rating of the vowels that were categorized using the 70% criterion was also not significant, t(11) = 1.961, p = .076.
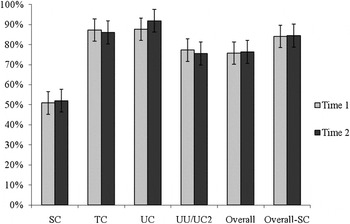
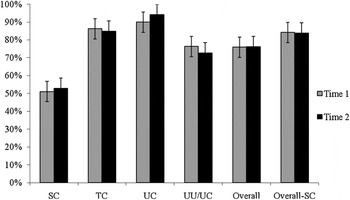
AXB Discrimination. The results from the discrimination task at test time 1 revealed a SC /iː/-/ɪə/ discrimination accuracy of 51%, a TC /iː/-/ɪ/ discrimination accuracy of 87%, a UC /ɜː/-/ʉː/ discrimination accuracy of 88%, and, finally, a UU-UC /əʉ/-/oː/ discrimination accuracy of 77% (see Figure 2). Results from the second test session revealed a SC /iː/-/ɪə/ discrimination accuracy of 52%, a TC /iː/-/ɪ/ discrimination accuracy of 86%, a UC /ɜː/-/ʉː/ discrimination accuracy of 92%, and a UU-UC /əʉ/-/oː/ discrimination accuracy of 76%. The average discrimination accuracy was 76% at both testing times. The SC vowel contrast /iː/-/ɪə/ was excluded, which is indiscriminable even to native speakers of AusE for whom it has apparently undergone a merger (see Bundgaard-Nielsen, Best, Tyler, & Kroos, 2008), the discrimination average was an impressive 84% at both testing times.
Discrimination accuracy for the SC (/iː/-/ɪə/), TC (/iː/-/ɪ/), UC (/ɜː/-/ʉː/), and UU/UC (/əʉ/-/oː/) contrasts and overall discrimination accuracy, as well as overall accuracy excluding SC. Error bars reflect the standard error of the mean.

A 4 × 2 ANOVA was conducted on the percent correct discrimination scores. There were two within-group factors: contrast, with four levels (/iː/-/ɪə/ [SC], /iː/-/ɪ/ [TC], /ɜː/-/ʉː/ [UC], and /əʉ/-/oː/ [UU-UC]), and time (1 and 2). An alpha level of .05 was used for all analyses unless specified. Mean percent correct discrimination scores, split by time and by contrast, are presented in Figure 2. There were significant main effects of contrast, F(2, 24) = 46.98, p < .001, ηp2 = .85, but not of time, F(1, 8) = 0.95, p = .358, and there was no significant interaction, F(3,24) = 1.20, p = .331. To test for differences between discrimination of the four contrasts, six post hoc paired samples t tests with a Bonferroni-adjusted alpha level of .008 were conducted. The effect of contrast was due to the difference in the average of the time 1 and time 2 discrimination scores between SC /iː/-/ɪə/ and the three other contrasts TC /iː/-/ɪ/, UC /ɜː/-/ʉː/, and UU-UC /əʉ/-/oː/, as well as a difference in the discrimination of the TC /iː/-/ɪ/ and UU-UC /əʉ/-/oː/ contrasts (see Table 7). A t test was conducted on the average L2 vocabulary sizes of the learners at test times 1 and 2, showing a marginal increase, t(8) = 3.52, p = .08.
Difference in the discrimination average of AusE contrasts at two test sessions

Discrimination in LV Versus HV Participants. To further understand the role of L2 vocabulary size in L2 perception, a closer look at the differences between the performance of the 2 LV participants and the 7 HV participants in Experiment 2 was taken. These preliminary results indicate that the 2 LV participants did improve in their L2 perception over time, but this was not the case for the 7 participants who had L2 vocabularies above 6,000 words already at the first testing session. Figure 3 indicates that the 2 LV participants improved on the contrasts UC, UU-UC, overall, and overall-SC between the two test sessions. Figure 3 also indicates that the LV participants improved in their overall performance both when the SC contrast (for which no improvement was expected over time) was included and when it was excluded in the calculation. Figure 4 indicates that the HV participants appeared to improve only in their discrimination of the UC and UU-UC contrasts—which was indeed an UC contrast for these learners, just as it had been for the partially overlapping group of HV learners in Experiment 1—and displayed no improvement in their overall performance between the two testing times. Because of the small number of participants, this interpretation must, of course, be taken cautiously.
Closer look at the change in discrimination for the four contrast types (SC, TC, UC, and UU) as well as the overall discrimination score and the overall discrimination score excluding the SC contrast between the two testing times for the 2 LV participants. Error bars reflect the standard error of the mean.

Closer look at the change in discrimination for the four contrast types (SC, TC, UC, and UU) as well as the overall discrimination score and the overall discrimination score excluding the SC contrast between the two testing times for the 7 HV participants. Error bars reflect the standard error of the mean.

Discussion
The results of Experiment 2 revealed very consistent and successful L2 vowel assimilation by the group of nine Japanese learners at both testing times, successful discrimination of three of the four L2-vowel contrasts of interest (also at both testing times), and a gain in average vocabulary size of almost 700 words, or approximately 30 words per week. The results reflect a persistent effect of the L1 background of the learners on their L2 perception similar to that evident in Experiment 1. This finding is similar to that of previous research (Bundgaard-Nielsen et al., Reference Bundgaard-Nielsen, Best and Tyler2011), but the results here differ in that the learners of the present study had larger L2 vocabularies, better L2 discrimination, and more consistent L2 assimilation behavior. This indicates that for the learners tested here, significant adjustment of their L2 perception had already taken place before the first testing time, alongside their L2 vocabulary expansion during the initial English learning and exposure in Australia. A closer look at the differences in the results for the 2 LV participants and the 7 HV participants further support the hypothesized role of L2 vocabulary acquisition in L2 perception: Even though the LV participants appeared to have improved in the discrimination of two L2 contrasts (UC and UU-UC) as well as in their overall discrimination accuracy, the HV participants, who had enjoyed a similar extended period in Australia, only improved in their discrimination of the UC contrast, not in their overall discrimination performance. Again, it is important to stress the preliminary nature of these longitudinal results and the possibility that these findings may not generalize to other L2 learners.
Even though the results support the vocab model predictions, they are not compatible with the general predictions of improved L2 perception with increased L2 exposure duration, as there was no evidence of improvement in the learners’ L2 vowel perception from testing time 1 to testing time 2. This lack of improvement is likely due to this particular group of learners who had relatively large L2 vocabularies, exhibited very successful L2-L1 vowel assimilation, and presented high levels of discrimination accuracy even at the beginning of their stay in Australia. Indeed, the learners performed on par with a group of native AusE speakers tested on those same contrasts in a previous study (Bundgaard-Nielsen, Best, Tyler, & Kroos, Reference Bundgaard-Nielsen, Best, Tyler and Kroos2008). This indicated that their L2 perception even at test time 1 (M = 7 weeks in Australia) was sufficient for their day-to-day interactions in English.
The lack of perceptual improvement from an additional 22 weeks of L2 learning in Australia and the speed with which the L2 learners have reached such a high level of reattunement to the L2 raises questions of the rate—and timing within the L2 learning process—of perceptual reorganization. Although recent research has indicated that most changes to L2 perception and production occur in the first year of exposure and learning in a L2-speaking environment (e.g., Tsukada et al., Reference Tsukada, Birdsong, Bialystok, Mack, Sung and Flege2005), few have suggested that reattunement takes place in just a few weeks. It is important to stress, however, that all but 2 of the 9 participants had a vocabulary well beyond the 6,000-word threshold already at test time 1. Additionally, the present findings may indicate that even when the learners’ vocabularies continue to expand during the period of their stay in the L2 environment, changes to their L2 segmental perception have already slowed down as they have reached a level of L2 perceptual performance that allows them to function (without too many delays in comprehension arising from accented perceptions) in their L2 environment. An alternative interpretation could be that the HV learners had less exposure to English during the period. However, the language background and language usage patterns of these participants were similar to those of the LV participants: All were living in English language environments (either in home-stay programs or with non-Japanese students in shared accommodations) and attending all-day classes in English.
Although there is no doubt that the Japanese learners of this study had existing written vocabularies in English before they arrived in Australia, it is probably uncertain that perceptual reattunement to spoken AusE vowels had already started in Japan, as their L2 instruction in Japan was mainly in written form and typically given by native speakers of Japanese. It is possible, however, that the learners may have started to reattune to Japanese-accented English vowels before their arrival in Australia, which may have further complicated the task at hand for the learners once they were exposed to native AusE vowels.
GENERAL DISCUSSION
Experiment 1 replicated and extended previous work on the role of L2 vocabulary size in L2 vowel perception (Bundgaard-Nielsen et al., Reference Bundgaard-Nielsen, Best and Tyler2011). Consistent with Bundgaard-Nielsen et al., HV learners had more consistent L2 to L1 vowel assimilation patterns than LV learners. Here, it was also found that HV learners more accurately discriminated L2 vowel contrasts than LV learners. The present report also presents a picture of an unexpectedly high level of competence in Japanese learners of AusE—in particular, when using the 50% assimilation criterion and when they are presented with the full L2 vowel system for assimilation and provided with the full set of possible Japanese vowels (both monomoraic and bimoraic) and dynamic vowel combinations as assimilation choices. This approach highlights the perceptual flexibility of L2 learners, as they are not restricted by only a small set of preselected L1 or L2 categories in the experimental setup.
The present study also suggests that future research could benefit by developing new methods to assess L2 rephonologization. If learners shift their attention from surface L2-L1 phonetic similarities to the higher order phonological properties of their L2, simply applying the task of assimilating L2 phones to L1 categories may not allow advanced or competent L2 learners to adequately display their L2 phonological competence. This scenario is particularly likely when the L1 contains a very limited number of categories and the learner has successfully established a new L2 category, although the learner may well be able to continue to assimilate the L2 phones to L1 categories on the basis of surface phonetic similarities if that is the only option provided to them in the laboratory task.
Experiment 2 extended those findings to a longitudinal examination of the effect of extended L2 exposure on L2 vocabulary size and L2 vowel perception. The results indicate that even when the L2 vocabularies of L2 learners in study-abroad situations may increase during the first 6–8 months, this is not necessarily reflected in improved L2 perception. This is, nonetheless, consistent with the findings in both Experiment 1 and Bundgaard-Nielsen et al. (Reference Bundgaard-Nielsen, Best and Tyler2011), as the learner group in Experiment 2 exhibited a large L2 vocabulary of more than an average of 6,000 words even at the first testing time and therefore should already have progressed significantly in their reattunement to the L2 vowels and subsequent phonological reorganization by that first time.
The results from both studies are compatible with the PAM-L2 prediction that the discrimination of SC and TC contrasts should not improve with extended exposure to the L2 contrast. Additionally, the findings from the two studies confirm the existing understanding that the L1 background of a learner shapes his or her L2 perception and the PAM predictions for nonnative contrast discrimination for the different contrast types SC, TC, and UC.
These two studies raise a number of important points in relation to the existing literature on L2 phonetic and phonological acquisition and the developmental trajectory of phonetic and phonological reorganization in late L2 acquisition. Although it has been suggested that the most significant changes in L2 perception may occur within the first year of L2 learning, the present study indicates that this perceptual change may indeed happen in just 12 weeks abroad. However, it is not clear whether the rapid perceptual readjustments displayed by the learners reflect a general pattern even for late L2 learners or if the particular L1-L2 pair or the typical L2 learning history of the participants in the present studies partly explains the finding. In particular, it is possible that the L2 English exposure that the Japanese learners had prior to their arrival in Australia provided them with a head start in their reattunement and rephonologization process, as it most likely did in terms of their L2 vocabulary size. This speculation must, however, be qualified, as the learners typically had mainly written English instruction and were taught by native Japanese foreign language teachers and, thus, may have attuned to Japanese-accented English more so than to native English. It is important to note, however, that the HV and LV groups did not differ in the amount of English instruction they had received prior to their AusE exposure in Australia. Future research should address the question of the role of L2 vocabulary acquisition in L2 rephonologization in learners who are truly naïve upon their arrival in the L2 language environment.
Another point to consider is that the present research also focused solely on vowel perception. Further research would do well to focus also on possible differences in reattunement and rephonologization for vowels and consonants because it is possible that the perceptual differences—and underlying articulatory differences—in vowels and consonants lead to different acquisition trajectories. Perception of vowels is more continuous rather than strictly categorical. Within-category discrimination remains possible to some extent, and vowels afford a more rapid readjustment than consonants—which are categorically perceived and for which within-category discrimination is generally much more difficult (see, e.g., Strange, Reference Strange and Pickett1998a, Reference Strange and Pickett1998b). It is possible that L2 consonant acquisition may exhibit a later reattunement and rephonologization trajectory, parallel to the observed pattern of timing differences in L1 perceptual attunement in infancy where L1 attunement to consonants occurs approximately 4 months after it is evident for vowels. Finally, future research should determine how the rapid perceptual reattunement and rephonologization affects production of L2 vowels and consonants.
In conclusion, the present study supports the vocabulary-growth hypothesis that L2 vocabulary acquisition is intimately linked to improvement in L2 segmental perception, with a further indication that the perceptual reattunement and rephonologization plateau once the learner has reached a L2 vocabulary that allows him or her to function adequately in the L2. The findings also bring out similarities between infant L1 acquisition and late SLA and thus are also consistent with the propositions of both PAM and PAM-L2 as well as the vocab model that even late SLA is analogous to L1 acquisition in that the learning mechanisms employed in L1 acquisition may be available to the late L2 learner. Finally, the studies lead to a series of unanswered questions about how L2 vocabulary may effect change in the perception of L2 consonants and questions about the role of L2 vocabulary expansion in change in L2 production.