





Policy Significance Statement
Studying averted incidents of school violence provides additional insights not available from reviewing only incidents that occur. Incidents had higher odds to be averted when schools had established active shooter protocols, multiple conspirators were involved, and suspects had undergone a traumatic life event. Policymakers should focus on expanding the detection and reporting of suspicious behavior. While physical countermeasures can delay or reduce an active threat, improved monitoring can prevent threats from materializing and provide resources to individuals facing legal consequences. The expansion of behavior detection and reporting may also increase community bonds and trust. Future research should aim to expand coverage of averted incidents to discover additional insights.
1. Introduction
School shootings remain a pervasive and uniquely American public safety challenge. Compared to other highly developed countries, the United States experiences school shootings at disproportionately high rates (Lankford, Reference Lankford2016). Recent years have been especially concerning. According to the K–12 School Shooting Database, 2024 alone saw 330 incidents in which a firearm was discharged or brandished on school grounds, an average of almost two incidents for every school day (DeSilver, Reference DeSilver2023; Riedman, Reference Riedman2024). This increase represents a dramatic shift from earlier decades. Before 2021, no year exceeded 125 incidents; however, since 2021, the annual average has consistently surpassed 300 (Riedman, Reference Riedman2024). Since the Columbine High School shooting in 1999, more than 390,000 students in the U.S. have been impacted by gun violence at school (Cox et al., Reference Cox, Rich, Chong, Trevor, Muyskens and Ulmanu2024). Beyond those physically present, large numbers of students, teachers, staff, and families experience indirect or secondary trauma following school shootings, contributing to widespread psychological, educational, and community-level harm (Bachman et al., Reference Bachman, Randolph and Brown2011).
The magnitude of this threat has resulted in substantial national investment in school safety. Federal, state, and local governments collectively spend billions of dollars each year on school security hardware, threat assessment programs, law enforcement personnel, and active shooter preparedness training (DeAngelis et al., Reference DeAngelis, Brent and Ianni2011). Schools increasingly adopt measures such as hardened entrances, surveillance systems, school resource officers, and classroom lockdown technology (Addington, Reference Addington2009; Tanner-Smith and Fisher, Reference Tanner-Smith and Fisher2016). Interventions have rapidly expanded in scope and cost over the past decade (Mowen and Freng, Reference Mowen and Freng2019). At the same time, entire industries have emerged around school security and emergency preparedness, incentivizing continual development of technologies and protocols intended to reduce the likelihood or severity of attacks (Tanner-Smith et al., Reference Tanner-Smith, Fisher, Addington and Gardella2018). Despite these investments, school shootings continue at historically high levels, suggesting the need for more insights into what prevents attacks before they occur.
A significant limitation of the current research landscape is that most empirical studies, policy reports, and media analyses overwhelmingly focus on incidents that were actually carried out (at least one victim was injured or killed). This limitation is reflected in the most widely cited school shooting databases, which systematically record completed attacks but rarely provide detailed information on the substantial number of events that were prevented before violence occurred (Rowhani-Rahbar and Moe, Reference Rowhani-Rahbar and Moe2019; Katsiyannis et al., Reference Katsiyannis, Rapa, Whitford and Scott2023; Cox et al., Reference Cox, Rich, Chong, Trevor, Muyskens and Ulmanu2024). As a result, research disproportionately centers on the characteristics of completed shootings, attacker profiles, and post-incident responses. At the same time, comparatively little attention has been devoted to the equally critical category of averted attacks. Analyses that focus solely on completed attacks create an inherently biased understanding of the threat landscape by excluding cases in which intervention, reporting, or preparedness successfully disrupted a planned attack (Comer, Reference Comer2024). The present study, therefore, aims to address the gap between research on completed versus averted school shootings by leveraging the Averted School Violence (ASV) database to determine which factors result in school shootings being carried out or averted.
1.1. Factors associated with school shootings
Often, the earliest signs of a potential school shooting are psychological and behavioral indicators exhibited by potential shooters (Borum et al., Reference Borum, Cornell, Modzeleski and Jimerson2010). Many shooters display warning behaviors before an attack, which often go unreported or are not taken seriously (Reid Meloy et al., Reference Reid Meloy, Hoffmann, Guldimann and James2012). School shooters are also more likely to have experienced traumatic life events or have been diagnosed with a mental illness (Lankford and Silva, Reference Lankford and Silva2021). Shooters are often victims of bullying or bullies themselves, often leading to instances of retaliatory violence occurring on school grounds (Wang et al., Reference Wang, Zhu, He, Yuan, Li, Xie, Wen, Tong, Zhang, Su and Wang2024). Strain theory offers a useful framework for understanding these patterns, positing that experiences such as bullying victimization, academic failure, and social exclusion generate frustration and blocked goals that, in extreme cases, can manifest as retaliatory violence (Agnew, Reference Agnew, Flannery, Vazsonyi and Waldman2007). Finally, the overwhelming majority of school shooters are male, highlighting stark sex patterns in violent offending (Riedman, Reference Riedman2024).
Typically, schools with increased countermeasures are at higher risk of violence; however, this is due to their being in less safe areas (Mowen and Freng, Reference Mowen and Freng2019). Situation crime prevention theory (SCPT) posits that countermeasures can deter attacks by increasing the effort required to carry them out (Eck and Clarke, Reference Eck, Clarke, Krohn, Hendrix, Hall and Lizotte2019). Schools with established and well-rehearsed training drills can help minimize or prevent casualties during an attack (Jonson, Reference Jonson2017). Finally, schools with supportive climates and well-implemented threat assessment programs can identify threats earlier and reduce the likelihood of violence (Byrd et al., Reference Byrd, Kapadia and John2025; Cornell et al., Reference Cornell, Kerere, Konold, Maeng, Afolabi, Huang and Cowley2025).
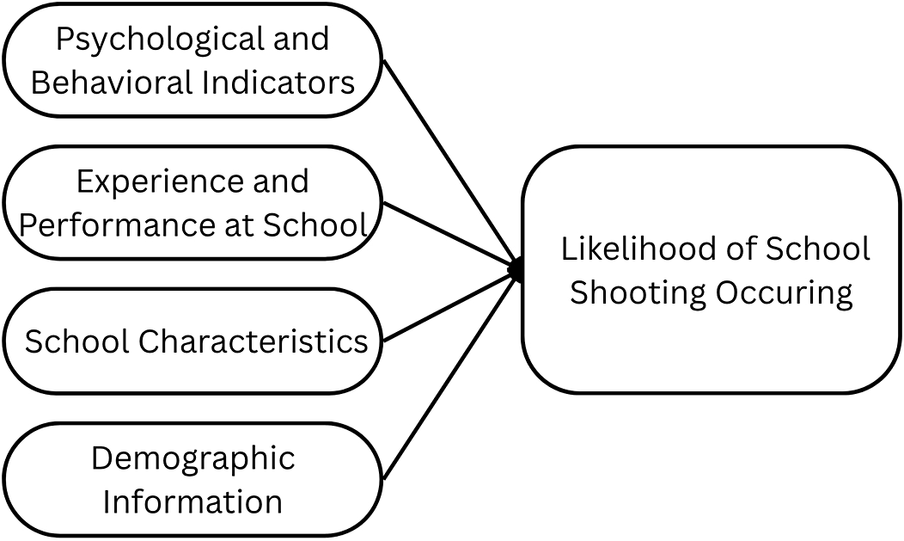
These findings collectively suggest that the likelihood of a school shooting occurring can be understood through four complementary theoretical frameworks, each capturing a distinct dimension of risk: threat assessment frameworks addressing psychological and behavioral indicators (Borum et al., Reference Borum, Cornell, Modzeleski and Jimerson2010; Cornell et al., Reference Cornell, Kerere, Konold, Maeng, Afolabi, Huang and Cowley2025), strain theory highlighting school-related experiences such as bullying and academic failure (Agnew, Reference Agnew, Flannery, Vazsonyi and Waldman2007), SCPT organizing school-level security and training characteristics (Eck and Clarke, Reference Eck, Clarke, Krohn, Hendrix, Hall and Lizotte2019), and the broader offending literature documenting demographic patterns in violent behavior (Riedman, Reference Riedman2024). As illustrated in Figure 1, the present study draws on each of these frameworks to guide variable selection, treating them as complementary pathways for predicting the likelihood of a school shooting.
Theoretical framework guiding variable selection for predicting school shooting likelihood.

Figure 1. Long description
A conceptual diagram consisting of five rounded rectangular boxes. Four boxes are arranged vertically on the left side and one box is positioned on the right. Each of the four left-hand boxes is connected to the right-hand box by a solid arrow pointing rightward, indicating a directional relationship. The four predictor boxes, from top to bottom, are labeled: Psychological and Behavioral Indicators; Experience and Performance at School; School Characteristics; and Demographic Information. The single outcome box on the right is labeled Likelihood of School Shooting Occurring. The diagram represents a theoretical model in which each of the four categories of factors independently contributes to the likelihood of a school shooting.
1.2. Impacts of school shootings and violence
School shootings have lasting consequences for students, staff, and the affected communities. Such incidents are often associated with significant psychological trauma and increased rates of anxiety, depression, and post-traumatic stress disorder (Lowe and Galea, Reference Lowe and Galea2017). These effects are not limited to those directly involved; exposure to school shootings is also linked to worse academic performance, increased absenteeism, and long-term educational and economic outcomes (Beland and Kim, Reference Beland and Kim2016). Schools and their surrounding communities also experience heightened fear, disrupted school environments, and significant financial costs associated with security measures (Tanner-Smith et al., Reference Tanner-Smith, Fisher, Addington and Gardella2018). Early threat detection plays a critical role in preventing school shootings and avoiding the individual and societal trauma they cause.
1.3. Previous studies regarding averted incidents at schools
Several studies have reported insights from averted school incidents. Cowan et al. (Reference Cowan, Tedeschi, Corbin and Cole2022) also utilized the ASV database to examine the most prevalent themes in averted incidents. They discovered that most threats were averted in the planning and preparation phase of the potential attack, usually through verbal leakage (telling others about their plan). However, only averted incidents were analyzed in this paper. Also, using the ASV database, Winch et al. (Reference Winch, Alexander, Bowers, Straub and Beidel2024) analyzed whether the suspect’s motives, leakage behavior, and the presence of co-conspirators influenced whether the attack was averted or carried out. They found incidents were more likely to be carried out if suspects had a suicide-related motive and did not leak their plans before the attack. This study did not include other factors related to the suspect, such as academic/disciplinary issues, diagnosed mental illness, previously exhibited warning behaviors/characteristics, or information related to the targeted school. Langman and Straub (Reference Langman and Straub2018) provided a comprehensive overview of the ASV database, including the methodology and summary statistics for all recorded variables. However, the report does not include any inferential statistics.
Additionally, studies have leveraged other data sources to gather information on averted threats of school shootings. Peterson et al. (Reference Peterson, Densley, Riedman, Spaulding and Malicky2024) examined 1039 school shooting threats made between 2018 and 2022. They found that most of the threats were made by males at large public high schools, but nearly one-fifth were made by females. In 40% of cases, it could not be determined if the threat was real or bogus. Cohen-Almagor & Haleva-Amir (Reference Cohen-Almagor and Haleva-Amir2012) showed that multiple school shootings could have been prevented if online threats made before the attack were taken seriously. Finally, Madfis (Reference Madfis2014) found that students were more likely to report threats if they were personally threatened or deflecting blame, rather than out of an altruistic concern for others’ safety. This paper aims to build upon previous analyses using the ASV dataset to identify factors associated with whether a school shooting is averted or carried out.
2. Methods
The ASV database, currently hosted by Safe and Sound Schools, was created to identify incidents of averted and carried out school violence after the Sandy Hook Elementary School shooting. Initially, the Department of Justice Office of Community Oriented Policing Services provided funding to the National Policing Institute to establish and maintain the ASV database. As of 2023 (after the data were provided and analyzed for this project), the ASV database is maintained by Safe and Sound Schools. The transfer, improvement in functionality, and expansion from the National Policing Institute to Safe and Sound Schools were made possible by Prevent 2 Protect, a Michigan Department of Education Pilot project.
Data for the ASV database are submitted through reports by the public, law enforcement officers, school administrators, mental health professionals, or Safe and Sound Schools staff. Individuals submit reports on the ASV website and are guided through a series of questions about the incident. Each question asks whether a specific variable was observed in any reputable source. For example, a specific question may ask whether the suspect’s parents were separated. To answer yes, submitters must provide a source, such as court documents showing the parents’ divorce. Therefore, factor variables reflect confirmed, documented evidence rather than the submitter’s subjective judgment. For example, a suspect could not be coded as having a mental illness unless the submitter cited an external source confirming a diagnosis. External sources include, but are not limited to, police reports, news articles, school records, diagnoses, and so forth. After submission, each report is verified by a panel of school violence and law enforcement subject-matter experts before being published to the database. While this process provides safeguards against unsupported or inconsistent coding, the method’s limitations are discussed further in the limitations section.
The categories and inclusion criteria are defined by Safe and Sound Schools and provided to respondents to help guide their reporting. Since the ASV database is constructed from public volunteers, it does not capture every incident of school violence, but it can be used to identify patterns and trends. All data obtained from the ASV database are the property of Safe and Sound Schools and may only be used or distributed in accordance with their stated data-use guidelines https://www.avertedschoolviolence.org/legal.
At the time of analysis, there were a total of 278 incidents in which a firearm was threatened to be used against a school, including 184 classified as being averted (no victims were injured or killed) and 94 as carried out (at least one victim was injured or killed). Only the primary shooter for each report was used in our analysis, as 87% of reports contained only one shooter, and many reports with multiple shooters had large percentages of missing data for the additional shooters. Instead, the presence of multiple shooters is included as a factor variable indicating coordinated behavior and social cohesion among perpetrators. In the analysis below, only incidents with no missing data were included.
The primary outcome variable for this analysis was whether the attack was averted or carried out, a unique feature of this dataset that can provide insights into the factors that lead to attacks being stopped before they occur. As mentioned above, the factor variables were created and organized by Safe and Sound Schools. Each factor (except age) contained multiple sub-components recorded as present or not by the respondent. Whether a sub-component was recorded as present or not was dependent on cited evidence, not the respondent’s opinion. For example, the respondent was required to provide evidence (such as a school record showing the suspect had been suspended) that the suspect had engaged in misconduct at school before checking any sub-component in the “Disciplinary Issues” factor. This conclusion could not have been made solely from the respondent’s examination of the situation.
We categorized the factor variables into four groups, motivated by the theoretical framework introduced earlier: (1) psychological and behavioral indicators, (2) school-related factors, (3) demographic information about the suspect, and (4) school characteristics. Psychological and behavioral indicators included negative characteristics exhibited by the suspect, display of documented warning behavior, a traumatic life event experience, possession of violent material, multiple suspects per incident (indicating coordinated behavior and social cohesion), controlled substance abuse, and mental illness. School-related factors included a record of the suspect having academic issues, a record of disciplinary issues, a record of being bullied, and a record of bullying. Demographic information about the suspect included the suspect’s sex and age. Finally, school characteristics included whether security countermeasures were deployed and whether response and training protocols were in place.
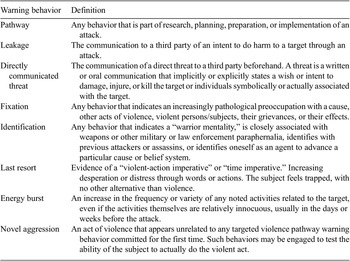
If any sub-component of the factor was present, the factor was coded 1; otherwise, it was coded 0. For example, if the suspect had been recorded as socially withdrawn or isolated before the incident, “Negative Characteristics” would be coded 1 for that incident. The specific sub-components of each factor are summarized in Table 1. Sub-components are ordered from most to least common for each factor. More precise definitions for the sub-components of “Warning Behaviors” are included in Table A2.
Groups and components of factors from the averted school violence database

Table 1. Long description
The table is organized into four primary Factor variable groups.
1. Psychological and behavioral indicators:
- Negative characteristics: includes depressed mood, social withdrawal, and disregard for authority.
- Warning behaviors: includes pathway, leakage, fixation, and identification behaviors.
- Traumatic event: includes parental separation, abuse, and domestic violence.
- Violent materials: includes social media, internet, and video games.
- Multiple suspects: No or Yes.
- Substance abuse: No or Yes.
- Mental illness: includes depression, suicidal thoughts, anxiety, schizophrenia, autism, A D H D, and delusions.
2. School-related factors:
- Academic issues: includes failing grades or sudden performance decline.
- Disciplinary issues: includes history of problems or being disruptive.
- Was bullied: verbal, physical, or cyber.
- Was bully: verbal, physical, or cyber.
3. Demographic information:
- Sex: Male or Female.
- Age: Numeric factor.
4. School characteristics:
- School security: includes S R O s, cameras, controlled access, and threat assessment teams.
- Training: includes hazard, lockdown, active shooter, and evacuation drills.
3. Results
3.1. Summary of factors from ASV database
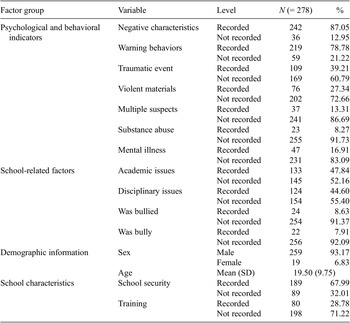
Table 2 summarizes the factors identified above. The majority of incidents contained a primary suspect who had recorded negative characteristics, warning behaviors, and possession of violent materials. Fewer than half of the incidents contained a suspect who had been recorded experiencing a traumatic life event, owned violent materials, collaborated with other suspects, had a substance abuse problem, had a mental illness, was experiencing academic or disciplinary issues, and was being bullied or bullying others. The overwhelming majority of suspects were male. The mean age of suspects was 19.5 years old. Finally, the majority of schools had recorded security measures but lacked a protocol and response training plan.
Summary of suspect and school characteristics recorded in sample
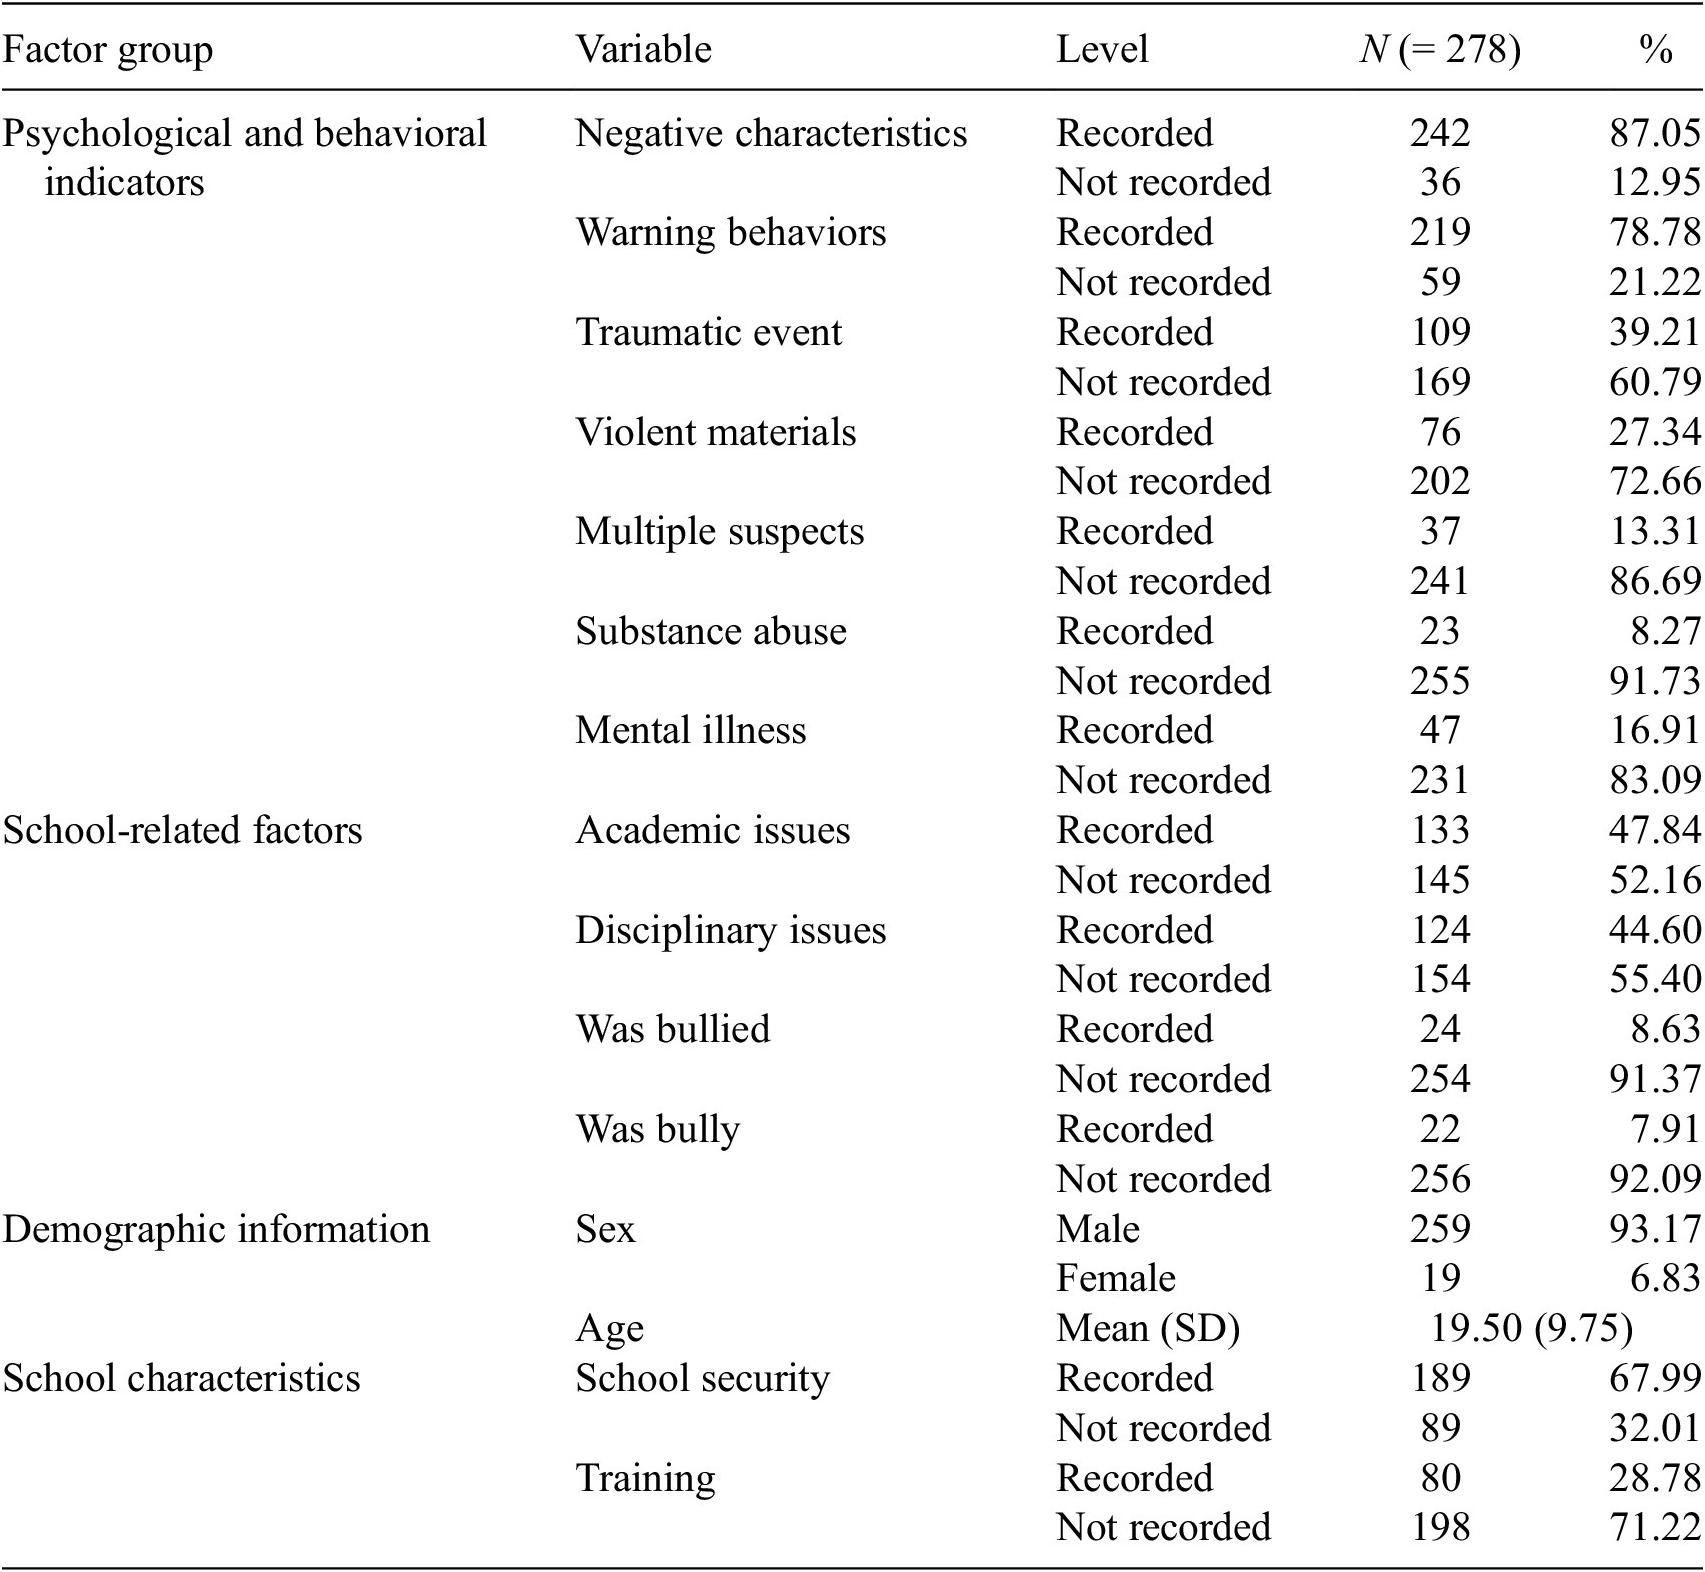
Table 2. Long description
The table consists of five columns: Factor group, Variable, Level, N (total 278), and percentage.
1. Psychological and behavioral indicators:
- Negative characteristics: Recorded 242 (87.05%), Not recorded 36 (12.95%).
- Warning behaviors: Recorded 219 (78.78%), Not recorded 59 (21.22%).
- Traumatic event: Recorded 109 (39.21%), Not recorded 169 (60.79%).
- Violent materials: Recorded 76 (27.34%), Not recorded 202 (72.66%).
- Multiple suspects: Recorded 37 (13.31%), Not recorded 241 (86.69%).
- Substance abuse: Recorded 23 (8.27%), Not recorded 255 (91.73%).
- Mental illness: Recorded 47 (16.91%), Not recorded 231 (83.09%).
2. School-related factors:
- Academic issues: Recorded 133 (47.84%), Not recorded 145 (52.16%).
- Disciplinary issues: Recorded 124 (44.60%), Not recorded 154 (55.40%).
- Was bullied: Recorded 24 (8.63%), Not recorded 254 (91.37%).
- Was bully: Recorded 22 (7.91%), Not recorded 256 (92.09%).
3. Demographic information:
- Sex: Male 259 (93.17%), Female 19 (6.83%).
- Age: Mean 19.50 with a standard deviation S D of 9.75.
4. School characteristics:
- School security: Recorded 189 (67.99%), Not recorded 89 (32.01%).
- Training: Recorded 80 (28.78%), Not recorded 198 (71.22%).
3.2. Association of factors with averted and carried-out events
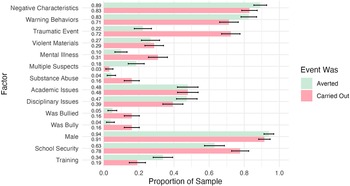
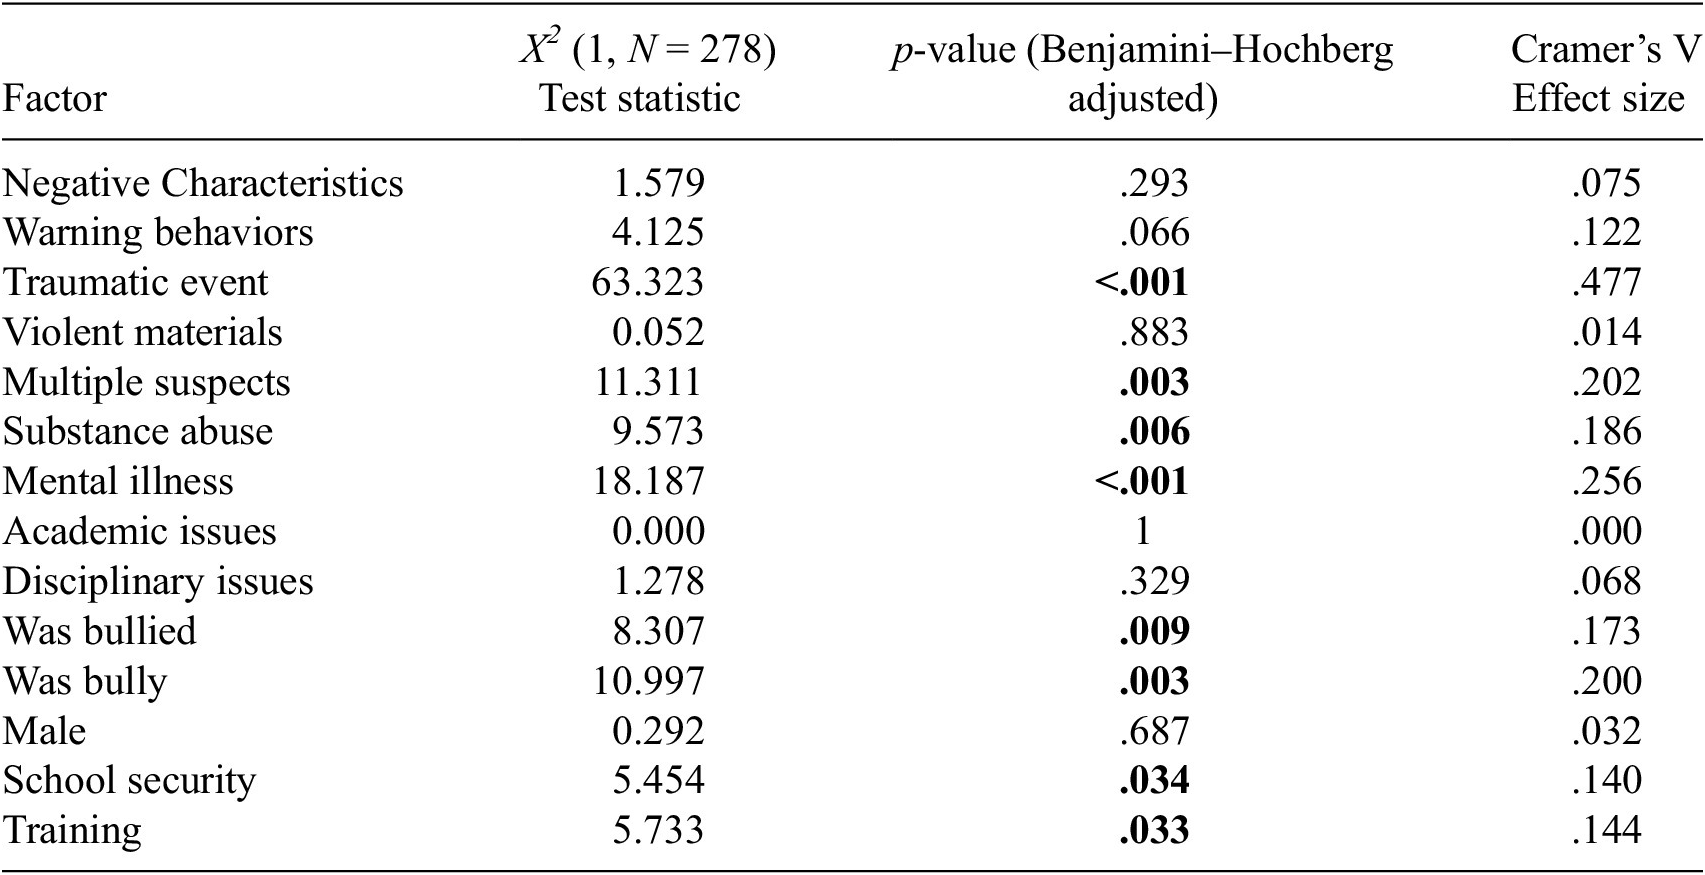
Using the information recorded in the Averted School Shooting database, we can identify factors associated with whether a school shooting plan was carried out. Figure 2 plots the proportion of incidents in which at least one of the components for each factor was present for averted and carried-out school shootings. Table 3 summarizes the results of 2 × 2 chi-squared tests between each factor and whether the incident was averted or carried out from Figure 1. To account for multiple comparisons across the 14 chi-square tests, p-values were corrected using the Benjamini–Hochberg false discovery rate method. Incidents that were carried out had a significantly higher proportion of school security countermeasures; the shooters were associated with having experienced a traumatic event, had a mental illness, had a history of substance abuse, had been bullied, and had bullied others. Incidents that were averted had a significantly higher proportion of schools with response protocols and training in place.
Proportion of averted and carried-out incidents involving one or more components of each risk factor. Note: The error bars represent 95% confidence intervals. There were 184 averted and 94 carried-out incidents for each factor. The dashed lines represent which group factors belong to.

Figure 2. Long description
A horizontal bar chart with the x-axis labeled “Proportion of Sample” (0 to 1.0) and the y-axis labeled “Factor” listing 14 factors. For each factor, two bars are shown: a green bar representing attacks that were averted and a pink bar representing attacks that were carried out. All bars include error bars. The 14 factors are: Negative Characteristics, Warning Behaviors, Traumatic Event, Violent Materials, Mental Illness, Multiple Suspects, Substance Abuse, Academic Issues, Disciplinary Issues, Was Bullied, Was Bully, Male, School Security, and Training. Key patterns include: Negative Characteristics and Warning Behaviors show high prevalence in both groups (approximately 0.71–0.89), with the averted group slightly higher. Male shows very high proportions in both groups (approximately 0.91–0.94). Traumatic Event, Violent Materials, Mental Illness, and Multiple Suspects show noticeably lower proportions in the averted group compared to the carried-out group. Was Bullied and Was Bully also show lower prevalence in averted attacks. Training and School Security show higher proportions in averted attacks than in carried-out attacks. Substance Abuse and Academic Issues show modest differences between the two groups.
Chi-squared tests between factors and incident being averted or carried out

Table 3. Long description
The table consists of four columns: Factor, X super 2 (1, N = 278) Test statistic, p-value (Benjamini–Hochberg adjusted), and Cramer’s V Effect size.
* Negative Characteristics: 1.579, .293, .075.
* Warning behaviors: 4.125, .066, .122.
* Traumatic event: 63.323, less than .001, .477.
* Violent materials: 0.052, .883, .014.
* Multiple suspects: 11.311, .003, .202.
* Substance abuse: 9.573, .006, .186.
* Mental illness: 18.187, less than .001, .256.
* Academic issues: 0.000, 1, .000.
* Disciplinary issues: 1.278, .329, .068.
* Was bullied: 8.307, .009, .173.
* Was bully: 10.997, .003, .200.
* Male: 0.292, .687, .032.
* School security: 5.454, .034, .140.
* Training: 5.733, .033, .144.
Note: All tests have one degree of freedom and a sample size of 278. Significant p-values (less than .05) are highlighted in bold in the source data.
Note: The dashed lines represent which group factors belong to. All chi-squared tests are conducted with one degree of freedom, a sample size of 278, and have a Benjamini–Hochberg adjustment applied. For binary factors, these tests are equivalent to comparing proportions across two independent groups. The bold-faced p-values indicate values lower than 0.05.
There were no significant differences between the proportions of incidents averted and carried out in which the primary shooter was male. A Wilcoxon rank-sum test indicated that age did not significantly differ between averted (M = 18.26, SD = 8.25) and carried-out (M = 21.68, SD = 11.67) incidents, W = 8072.5, p = .126.
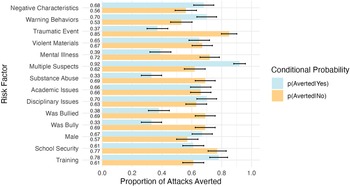
Figure 3 presents the inverse probabilities (proportions) corresponding to those in Figure 2 and is used to identify factors associated with averted school shooting incidents. For each factor, Figure 3 plots the proportion of shooting incidents that were averted in the database, conditional on whether the factor was present (Yes) or absent (No). Figure 2 indicates that school shooting incidents had higher rates of being averted when the potential shooter has exhibited negative characteristics, demonstrated suspect behavior, not experienced a traumatic event, and not had a history of substance abuse or mental illness. School shooting incidents were also more likely to be averted when the shooter had never been bullied or bullied others. Finally, incidents were more likely to be averted when school security was absent and when the school had provided training on responding to a school shooting.
Proportion of attacks averted conditional on the presence/absence of each factor. Note: The error bars represent 95% confidence intervals. There were 184 averted incidents and 94 carried-out incidents for each factor. The dashed lines indicate which group each factor belongs to.

Figure 3. Long description
A horizontal bar chart with the x-axis labeled “Proportion of Attacks Averted” (0 to 1.0) and the y-axis labeled “Risk Factor” listing 14 factors. For each factor, two bars are shown: a blue bar representing the probability of aversion given the factor is present [p(Averted|Yes)], and an orange bar representing the probability of aversion given the factor is absent [p(Averted|No)]. All bars include error bars indicating uncertainty. The 14 factors are divided into three groups separated by dashed horizontal lines. The first group includes Negative Characteristics, Warning Behaviors, Traumatic Event, Violent Materials, Mental Illness, Multiple Suspects, and Substance Abuse. The second group includes Academic Issues, Disciplinary Issues, Was Bullied, and Was Bully. The third group includes Male, School Security, and Training. For most factors, the blue and orange bars are of similar length, with conditional probabilities roughly between 0.5 and 0.8. A notable exception is Traumatic Event, where p(Averted|Yes) is substantially lower than p(Averted|No), indicating that the presence of a traumatic event is associated with a lower probability of aversion. School Security and Training show higher conditional probabilities of aversion when the factor is present compared to absent.
3.3. Factors associated with whether a school shooting was averted
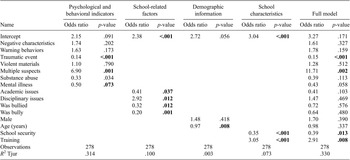
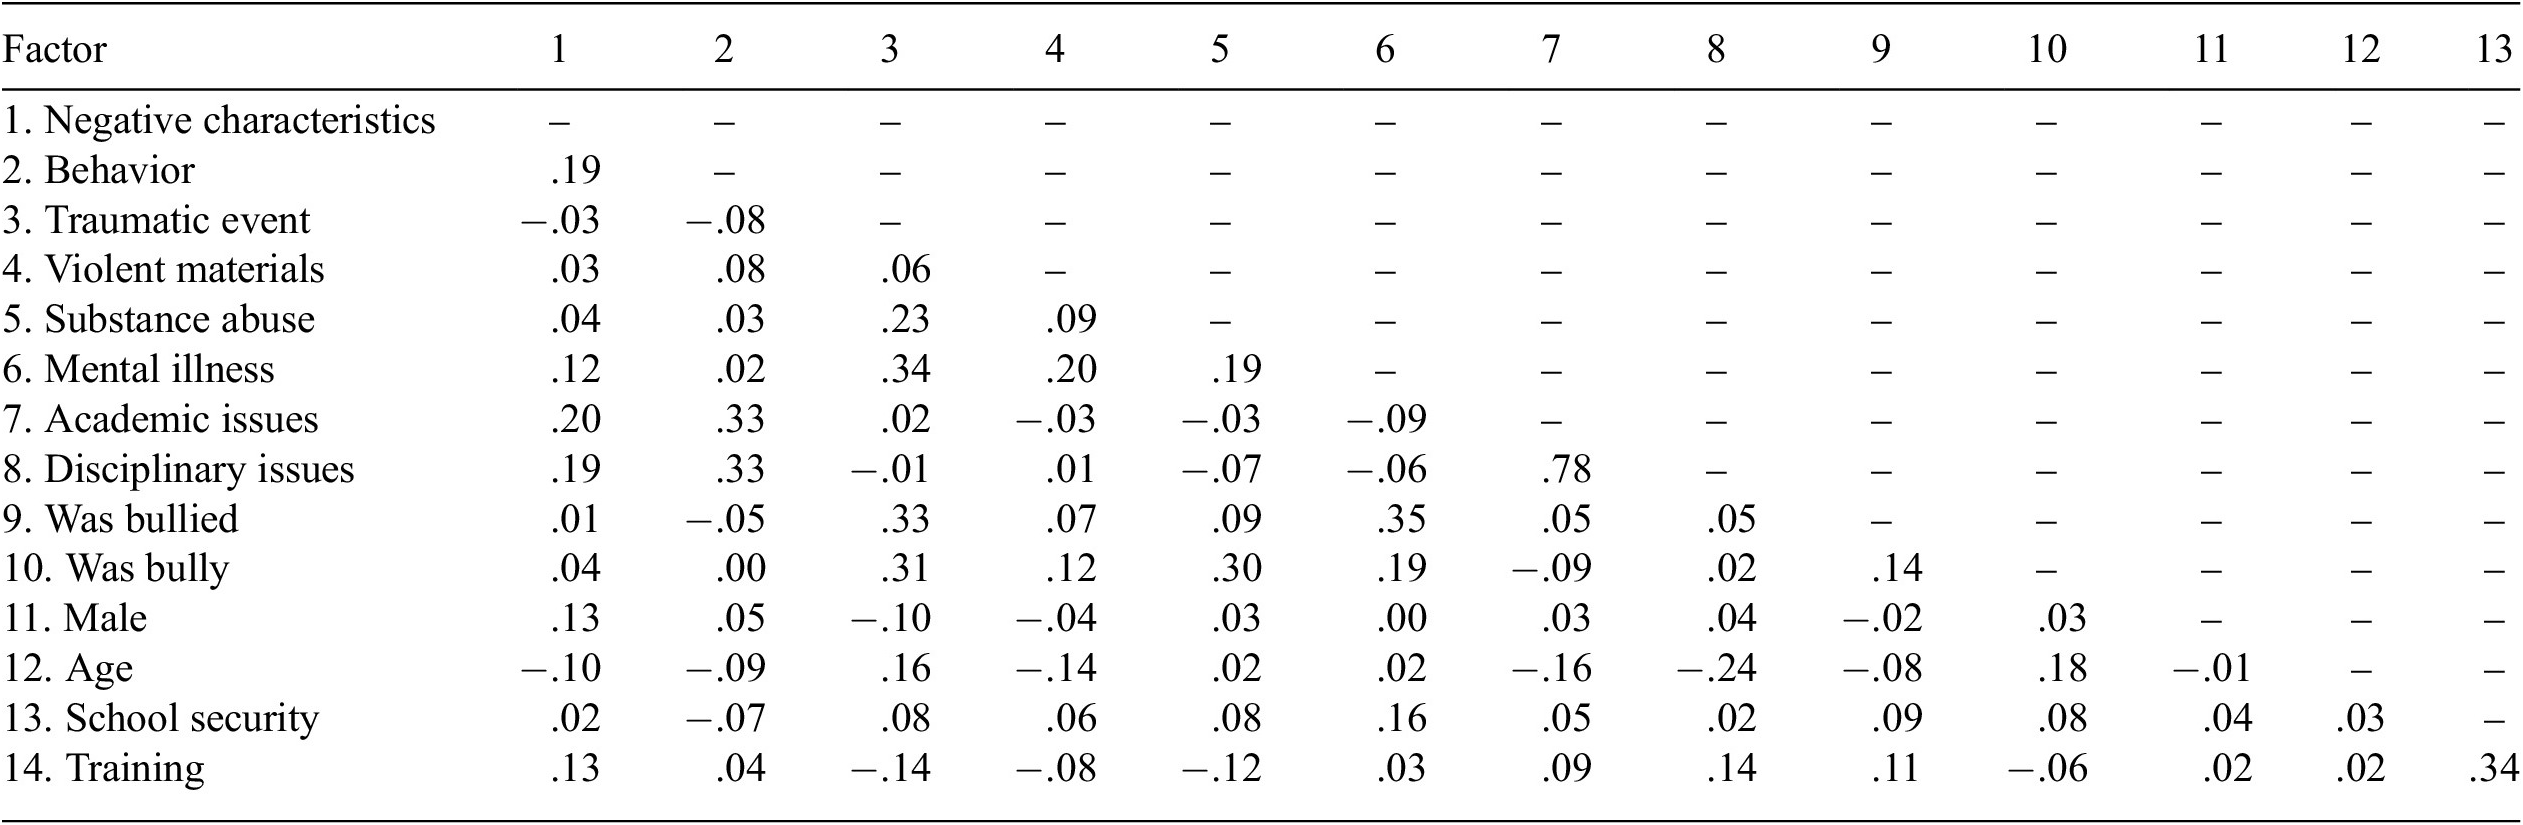
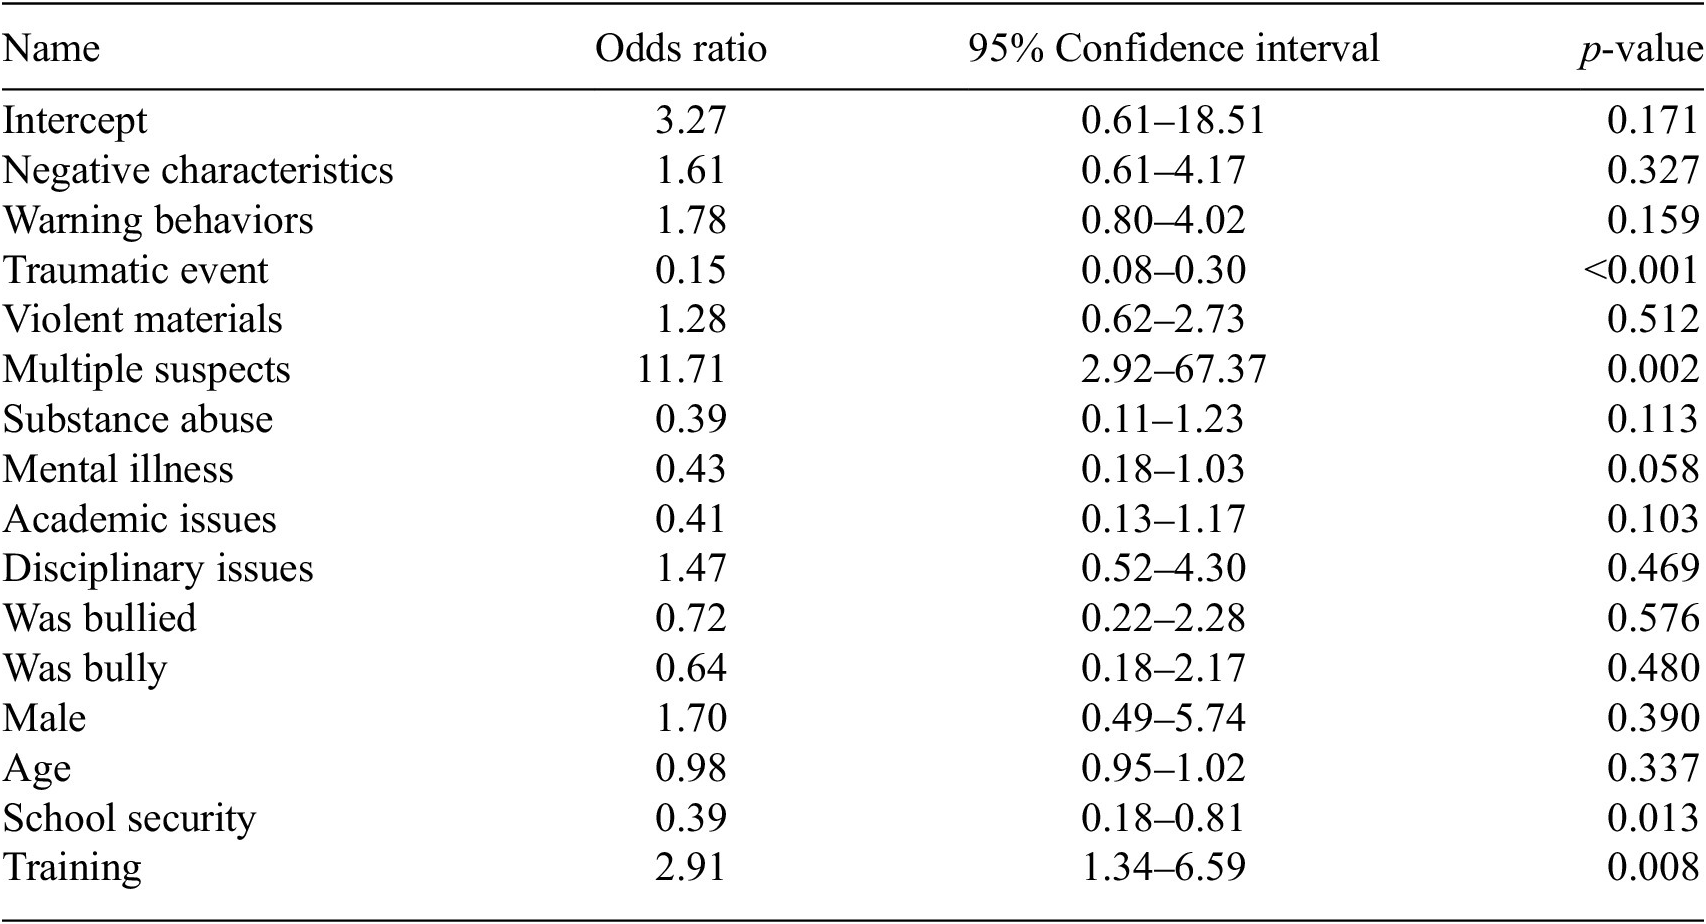
Table 4 summarizes a series of binary logistic regression models examining factors associated with whether a school shooting was averted (1) or carried out (0). The first model presents only the psychological and behavioral indicator group of variables; the second model presents only the school-related factor variables; the third model presents only the suspect’s demographic variables; the fourth model presents only the school characteristics variables; and the fifth model presents all of the variables. The correlations among all variables are reported in Table A1. The 95% confidence intervals for the odds ratios from the full (fifth) model are reported in Table A3.
Binary logistic regression models examining associations with whether an incident was averted or carried out

Table 4. Long description
The table presents Odds Ratios and p-values for five models: Psychological and behavioral indicators, School-related factors, Demographic information, School characteristics, and a Full model.
Key findings include:
* Traumatic event: Significant negative association in the Psychological model (Odds ratio 0.14, p < .001) and Full model (Odds ratio 0.15, p < .001).
* Multiple suspects: Strong positive association in the Psychological model (Odds ratio 6.90, p = .001) and Full model (Odds ratio 11.71, p = .002).
* School security: Significant negative association in the School characteristics model (Odds ratio 0.35, p < .001) and Full model (Odds ratio 0.39, p = .013).
* Training: Significant positive association in the School characteristics model (Odds ratio 3.05, p < .001) and Full model (Odds ratio 2.91, p = .008).
* Academic and disciplinary issues, as well as bullying history, show significant associations in the School-related factors model but lose significance in the Full model.
* Age (years) is significant in the Demographic model (Odds ratio 0.97, p = .008) but not in the Full model.
The total number of observations for all models is 278. The R super 2 Tjur values range from .003 in the Demographic model to .330 in the Full model.
Note: The bold-faced p-values indicate values lower than 0.05.
In our logistic regression models, the odds ratio shows how the odds of an incident being averted change for a one-unit increase in a factor, holding other variables constant. For numeric variables, this is a one standard deviation increase, and for binary predictors this is whether the predictor was present in the data or not (coded as 1 for present and 0 for absent). Odds ratios greater than 1.0 indicate that the factor is associated with higher odds of averting an incident. For example, an odds ratio of 2.5 means the odds of an incident being averted are 2.5 times greater when that factor is present. Odds ratios below 1.0 indicate lower odds of an incident being averted. These are easier to interpret in terms of the reciprocal odds. For instance, an odds ratio of 0.25 means the odds of an incident being averted are only one-quarter as high, that is, the odds of the incident being carried out are 4.00 times higher (1/0.25 = 4). An odds ratio of 1.00 indicates no relationship with whether an incident is averted or carried out.
In the psychological and behavioral indicators model, incidents in which the suspect had experienced a traumatic life event had 7.14 times higher odds of being carried out, and incidents in which the suspect had a recorded mental illness had 2.00 times higher odds of being carried out. Alternatively, incidents with multiple suspects had 6.90 times higher odds of being averted. The psychological and behavioral indicators model demonstrated a discrimination value of 0.314, indicating that predicted probabilities for averted versus carried-out incidents differed by about 31.4 percentage points on average.
In the school-related factors model, incidents in which the suspect had recorded academic issues had 2.44 times higher odds of being carried out, incidents in which the suspect had been bullied had 3.13 times higher odds of being carried out, and incidents in which the suspect was a bully had 5.00 times higher odds of being carried out. In contrast, incidents involving a suspect with a disciplinary record had 2.92 times higher odds of being averted. The school-related factors model demonstrated a discrimination value of 0.100, indicating that predicted probabilities for averted versus carried-out incidents differed by about 10.0 percentage points on average.
In the demographic information model, incidents in which the suspect was 1 year older had 1.03 times higher odds of being carried out. The demographic information model demonstrated a discrimination value of 0.031, indicating that predicted probabilities for averted versus carried-out incidents differed by about 3.1 percentage points on average.
In the school characteristics model, incidents in which schools had recorded security countermeasures had 2.86 times higher odds of being carried out, and incidents in which schools had a response protocol or training plan had 3.05 times higher odds of being averted. The school characteristics model demonstrated a discrimination value of 0.075, indicating that predicted probabilities for averted versus carried-out incidents differed by about 7.5 percentage points on average.
In the full model, incidents in which the suspect had experienced a traumatic life event had 6.67 times higher odds of being carried out, and incidents in which the school had recorded security countermeasures had 2.56 times higher odds of being carried out. Alternatively, incidents with multiple suspects had 11.71 times higher odds of being averted, and incidents in which the school had a response protocol or training plan had 2.91 times higher odds of being averted. There was no significant interaction between having a recorded mental illness and experiencing a traumatic life event; therefore, the interaction was not included in the model. The full model demonstrated a discrimination value of 0.360, indicating that predicted probabilities for averted versus carried-out incidents differed by about 36.0 percentage points on average.
4. Discussion
4.1. Psychological and behavioral indicators
Overall, several psychological and behavioral indicators in this study were associated with whether an incident was averted or carried out. If shooters had experienced a traumatic life event, they had over six times higher odds of carrying out their attack compared to suspects with no record of a traumatic life event. In over 70% of carried-out incidents, the primary shooter had experienced a traumatic life event, in contrast to under 25% of averted events. While the exact reasoning is unknown, it is possible that shooters in the database who have experienced traumatic life events feel as though they have less to lose in carrying out their attack. In many police reports of averted incidents in the ASV database, a teacher or school resource officer de-escalated the situation by talking with the shooter.
Furthermore, Winch et al. (Reference Winch, Alexander, Bowers, Straub and Beidel2024) found that suspects in the ASV database were more likely to carry out their attacks if they had a suicide-related motive. Additionally, incidents had 11.71 times higher odds of being averted when multiple shooters were involved. While multiple coordinated offenders pose a greater risk, group dynamics increase the likelihood of detection, leakage, or a third-party reporting suspicious behavior. Co-conspirators may express doubts, leak plans to peers or adults, or engage in behaviors that raise suspicion.
Based on these results, interpretations for broader contexts suggest that school administrators should establish policies that prioritize the investigation of suspicious behavior of those known to have experienced traumatic life events. Monitoring at critical intervention points can help disrupt possible attacks and provide support to struggling students. Likewise, our results suggest that school administrators should be hypervigilant in responding to reports of suspicious behavior involving groups of students. Incidents with multiple conspirators simultaneously elevate risk but also increase the likelihood of detection through leakage. Reports on social media involving suspicious communications suggesting violence among groups of students should also be prioritized for investigation.
4.2. School-related factors
All four school-related factor variables (academic/disciplinary issues, bullying/bullied) were significantly associated with the odds of an incident being averted or carried out in the school-related factors-only model. However, in the full model, none of these variables was significant. Additionally, none of these variables were correlated with any variable from another group at greater than .35, indicating that multicollinearity is unlikely.
It appears that while these variables can partially explain the odds that an incident is averted or carried out, factors such as whether suspects have experienced a traumatic event or the presence of multiple conspirators are still more important drivers of an incident being carried out than averted. Nonetheless, school staff are more likely to notice if a student has academic/disciplinary issues or is a bully/being bullied, as these factors are directly observable at school. Since staff may be unaware if a student has suffered a traumatic event recently or become diagnosed with a mental illness, if any previously mentioned school-related factor is observed, a trained staff member should follow up with the student, both for the safety of the student in question and their peers.
In general, bullying is a persistent problem in schools that deserves greater attention. Aside from the direct negative consequences of bullying, we observed that bullying is associated with the odds of a school violence threat being carried out. This finding suggests that deterring bullying may also improve the odds of a school violence threat resulting in actual violence. One implication for school fiscal policy is to prioritize funding for programs that aim to reduce bullying and mitigate its impacts. Beyond general anti-bullying programs, the observed associations suggest schools should treat bullying, whether as a victim or perpetrator, as a potential behavioral indicator warranting follow-up, within a threat assessment framework, rather than addressing it solely as a disciplinary matter.
4.3. Demographic information
While neither the suspect’s sex nor age was significant in the final model, age was significant in the demographic information-only regression model. It has been well documented in relevant databases (including this one) that the majority of school shooters are male (Riedman, Reference Riedman2024), likely leading to no significant differences in the sex of suspects between averted and carried-out incidents. Older suspects had higher odds of “successfully” carrying out their attacks, likely because of greater cognitive ability to plan attacks. Additionally, individuals over the age of 21 can often legally purchase their own firearms to commit an attack with and are not therefore hindered by having to borrow or steal one.
Whether or not an act of school violence is ultimately carried out is weakly associated (at best) with individual characteristics such as sex and age. Even the weak associations for age reported in these data were overwhelmed when other variables were included in the model. Our results suggest that school administrators should promote policies involving the investigation of threats of school violence that are blind to individual characteristics such as sex and age. Policies should be implemented that remind students, school faculty, and staff to report suspicious behavior, regardless of individual characteristics such as sex and age.
4.4. School characteristics
While there were only two variables related to school characteristics in our study, school security countermeasures and training protocols, they were significant in both regression models in which they were included. While incidents in which schools had a response plan for active shooters had lower odds for the shooting to be carried out, incidents in which schools had security countermeasures had higher odds of being carried out. We do not believe that schools with security countermeasures encourage attacks; rather, this finding is a by-product of confounding variables, such as school location and indicators of pre-existing threats. While we cannot directly test this with the data in this study, the proposed confounding explanation is consistent with previous research (Tanner-Smith and Fisher, Reference Tanner-Smith and Fisher2016; Mowen and Freng, Reference Mowen and Freng2019). The finding that the presence of countermeasures is associated with school shootings is the product of current policy that prioritizes the use of countermeasures in schools with the greatest perceived threat and with available resources to fund the procurement and operation of countermeasures. It is important to realize that perceived threats may not coincide with actual threats of school violence. It would be a mistake to use the results of this study to argue for fiscal policies that curtail the use of school countermeasures.
In general, schools with response protocols and training for active shooters may be better equipped to de-escalate an active shooter and convince them to stand down. Furthermore, if students and staff know what to do during an active shooter scenario, casualties can be reduced even if the attack occurs. Given that training protocols were significantly associated with averted incidents in both the school characteristics-only and full models, resource allocation decisions should prioritize implementing and regularly rehearsing active shooter response training. This recommendation is particularly important for schools that may already have security hardware in place but lack accompanying procedural preparation.
5. Limitations
While interpreting the findings from this study, several limitations should be considered. The ASV database is not a comprehensive account of all averted and carried-out school shootings in the United States. Incidents must be submitted through volunteer reports and then verified by Safe and Sound Schools staff. Incidents that receive little media attention are more likely to go unrecorded. Similarly, the completeness of each incident depends on the available documentation that records evidence for the included variables. Many variables, including mental illness, traumatic life events, and substance abuse, are likely underreported, especially in averted events where police investigation and media coverage are likely less extensive. Furthermore, because factor variables depend entirely on what was documented and submitted, variables that are inherently difficult to verify, such as home environment or substance abuse, may reflect documentation availability as much as true prevalence. Additionally, because reports are submitted voluntarily by individuals with direct knowledge of the incident, the database may disproportionately reflect cases in which intervention was considered successful or instructive.
Additionally, due to the limited confirmed evidence in the data, factors were collapsed across categories, thereby limiting the nuance of their individual components. For example, mental illness was coded as present if any one of seven possible diagnoses was recorded. While this precludes determining which specific mental illness was associated with an incident being averted or not, this approach still permits identification of which broader variable groups are associated with averted or carried-out incidents. Finally, all data presented in this paper are observational, which precludes any causal inference. While factors may be associated with higher or lower odds of an incident being averted, we cannot determine whether a factor directly causes an incident to be averted. The cross-sectional nature of these data means that temporal ordering between factors and outcomes cannot be established.
6. Conclusions
This study evaluated which factors were associated with school shooting incidents being carried out or averted. Data were obtained from the ASV database, which verifies reports of averted and carried-out school shooting incidents. Results showed that incidents had higher rates of being averted when potential perpetrators had not experienced a traumatic life event or had co-conspirators. Similarly, incidents were more likely to be averted when schools had active shooter protocols or lacked security countermeasures. School shooting prevention measures should focus on improving identification of struggling students, both within school due to academic performance or bullying, and in their home life. Identifying warning behaviors before an attack occurs is often the most effective method for preventing a school shooting from occurring.
Acknowledgments
This material is based on work supported by the U.S. Department of Homeland Security under Grant Award Number 17STQAC00001-08-03.
Author contribution
Conceptualization: K.K., K.B., R.J.; Data Curation: K.K.; Formal Analysis: K.K.; Investigation: K.K.; Methodology: K.K., K.B., R.J.; Project Administration: K.K.; Supervision: R.J.; Visualization: K.K.; Writing Original Draft: K.K.; Writing Review and Editing: K.K., K.B., R.J.
Competing interests
The authors declare none.
Data availability statement
Due to the sensitive nature of the topic discussed in this paper, data are available upon reasonable request from the corresponding author, kevinkap@usc.edu.
Funding statement
This work was supported by the U.S. Department of Homeland Security. The views and conclusions contained in this document are those of the authors and should not be interpreted as necessarily representing the official policies, either expressed or implied, of the U.S. Department of Homeland Security.
Appendix A
Correlations between all variables in the study

Table A1. Long description
The table presents Pearson correlation coefficients between 14 factors. The factors are: 1. Negative characteristics, 2. Behavior, 3. Traumatic event, 4. Violent materials, 5. Substance abuse, 6. Mental illness, 7. Academic issues, 8. Disciplinary issues, 9. Was bullied, 10. Was bully, 11. Male, 12. Age, 13. School security, and 14. Training.
Key correlations include:
* A strong positive correlation between Academic issues and Disciplinary issues (0.78).
* Moderate positive correlations between Mental illness and Traumatic event (0.34), Mental illness and Was bullied (0.35), and School security and Training (0.34).
* Behavioral factors show a positive correlation with Academic issues (0.33) and Disciplinary issues (0.33).
* Traumatic event is positively correlated with Substance abuse (0.23), Mental illness (0.34), Was bullied (0.33), and Was bully (0.31).
* Negative correlations are generally weak, with the strongest being between Age and Disciplinary issues (-0.24).
Definitions of warning behaviors

Table A2. Long description
The table consists of two columns titled Warning behavior and Definition.
* Pathway. Any behavior that is part of research, planning, preparation, or implementation of an attack.
* Leakage. The communication to a third party of an intent to do harm to a target through an attack.
* Directly communicated threat. The communication of a direct threat to a third party beforehand. A threat is a written or oral communication that implicitly or explicitly states a wish or intent to damage, injure, or kill the target or individuals symbolically or actually associated with the target.
* Fixation. Any behavior that indicates an increasingly pathological preoccupation with a cause, other acts of violence, violent persons/subjects, their grievances, or their effects.
* Identification. Any behavior that indicates a warrior mentality, is closely associated with weapons or other military or law enforcement paraphernalia, identifies with previous attackers or assassins, or identifies oneself as an agent to advance a particular cause or belief system.
* Last resort. Evidence of a violent-action imperative or time imperative. Increasing desperation or distress through words or actions. The subject feels trapped, with no other alternative than violence.
* Energy burst. An increase in the frequency or variety of any noted activities related to the target, even if the activities themselves are relatively innocuous, usually in the days or weeks before the attack.
* Novel aggression. An act of violence that appears unrelated to any targeted violence pathway warning behavior committed for the first time. Such behaviors may be engaged to test the ability of the subject to actually do the violent act.
Full regression model with all factors

Table A3. Long description
The table consists of four columns: Name, Odds ratio, 95 percent Confidence interval, and p-value.
* Intercept: Odds ratio 3.27, Confidence interval 0.61 to 18.51, p-value 0.171.
* Negative characteristics: Odds ratio 1.61, Confidence interval 0.61 to 4.17, p-value 0.327.
* Warning behaviors: Odds ratio 1.78, Confidence interval 0.80 to 4.02, p-value 0.159.
* Traumatic event: Odds ratio 0.15, Confidence interval 0.08 to 0.30, p-value less than 0.001.
* Violent materials: Odds ratio 1.28, Confidence interval 0.62 to 2.73, p-value 0.512.
* Multiple suspects: Odds ratio 11.71, Confidence interval 2.92 to 67.37, p-value 0.002.
* Substance abuse: Odds ratio 0.39, Confidence interval 0.11 to 1.23, p-value 0.113.
* Mental illness: Odds ratio 0.43, Confidence interval 0.18 to 1.03, p-value 0.058.
* Academic issues: Odds ratio 0.41, Confidence interval 0.13 to 1.17, p-value 0.103.
* Disciplinary issues: Odds ratio 1.47, Confidence interval 0.52 to 4.30, p-value 0.469.
* Was bullied: Odds ratio 0.72, Confidence interval 0.22 to 2.28, p-value 0.576.
* Was bully: Odds ratio 0.64, Confidence interval 0.18 to 2.17, p-value 0.480.
* Male: Odds ratio 1.70, Confidence interval 0.49 to 5.74, p-value 0.390.
* Age: Odds ratio 0.98, Confidence interval 0.95 to 1.02, p-value 0.337.
* School security: Odds ratio 0.39, Confidence interval 0.18 to 0.81, p-value 0.013.
* Training: Odds ratio 2.91, Confidence interval 1.34 to 6.59, p-value 0.008.


 Open access


Comments
No Comments have been published for this article.