1. Introduction
Shear flows are ubiquitous in fluid systems, and shear flow instability, nonlinear development and its transition into turbulence remains an active area of research to the present day. We focus here on magnetohydrodynamic (MHD) shear instabilities, relevant to astrophysical systems such as, for example, the solar tachocline, the magnetopause and the atmospheres of hot exoplanets. In particular, we are interested in the physical mechanisms leading to ideal parallel shear instabilities in MHD.
The argument generally is that, in the presence of a background magnetic field that has a component parallel to the background flow, fluid instabilities have to do work to bend field lines; thus the presence of a background magnetic field should be stabilising. This is generally found to be true in planar geometry when the background magnetic field is uniform (e.g. Chandrasekhar Reference Chandrasekhar1981; Biskamp Reference Biskamp2003). However, this argument does not account for the observed destabilisation of hydrodynamically stable flows in the presence of spatially varying background magnetic fields (e.g. Stern Reference Stern1963; Kent Reference Kent1966, Reference Kent1968; Chen & Morrison Reference Chen and Morrison1991; Tatsuno & Dorland Reference Tatsuno and Dorland2006; Lecoanet et al. Reference Lecoanet, Zweibel, Townsend and Huang2010), or the fact that a uniform field can destabilise some wavenumbers that are hydrodynamically stable (e.g. Kent Reference Kent1966, Reference Kent1968; Ray & Ershkovich Reference Ray and Ershkovich1983). Further, in two-dimensional spherical geometry (no radial motion), a flow close to the observed solar differential rotation is hydrodynamically stable, but is destabilised by the presence of an azimuthal background magnetic field varying in latitude (e.g. Gilman & Fox Reference Gilman and Fox1997; Gilman & Cally Reference Gilman, Cally, Hughes, Rosner and Weiss2007). To reconcile these contrasting effects, the negative-energy wave interpretation (e.g. Cairns Reference Cairns1979), based on wave resonance and energetic arguments, is sometimes invoked (e.g. Ruderman & Belov Reference Ruderman and Belov2010). The aim here is to provide an intuitive mechanistic interpretation that reconciles the contrasting influences of the magnetic field on MHD shear instabilities.
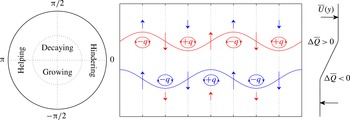
We present here an interpretation of shear instabilities in terms of interacting vorticity waves. This interpretation includes as a special case the counter-propagating Rossby waves (CRW) mechanism (e.g. Bretherton Reference Bretherton1966; Hoskins, McIntyre & Robertson Reference Hoskins, McIntyre and Robertson1985), a mechanism well known in geophysical fluid dynamics, and which has been argued by Baines & Mitsudera (Reference Baines and Mitsudera1994) to be an equivalent approach to the negative-energy wave explanation for shear instability. A basic schematic of the mechanism is recalled here for the Rossby wave case in figure 1, with a description of the mechanism given in the caption.
A pictorial representation of the wave interaction mechanism for the case of two Rossby waves. Here,
 $q\sim -{\rm\Delta}\overline{Q}{\it\eta}$
, where
 $q$
is vorticity,
 ${\it\eta}$
is displacement, and
 ${\rm\Delta}\overline{Q}$
is the magnitude of the vorticity jump of the background flow profile. Taking into account the sign of
 ${\rm\Delta}\overline{Q}$
at each jump, the
 $q$
anomalies resulting from the
 ${\it\eta}$
distribution are labelled accordingly. The top wave has a self-induced propagation to the left relative to the mean flow, and vice versa for the bottom wave, and both waves propagate counter to the mean flow. The waves interact with each other via the non-local velocity field induced by local vorticity anomalies, and the induced velocities decay with distance from vorticity anomalies, represented here by the length of the arrows. The waves may be held steady owing to counter-propagation relative to the mean flow, together with the mutual interaction between the waves, resulting in a phase-locked configuration. The waves can then constructively interfere and lead to instability. A phase difference regime diagram is given on the left, where the phase difference is defined as
 ${\rm\Delta}{\it\epsilon}={\it\epsilon}_{2}-{\it\epsilon}_{1}$
, the lower wave displacement relative to the upper wave; the configuration here has
 ${\rm\Delta}{\it\epsilon}=-{\rm\pi}/2$
.

The main ingredients required for instability in this interpretation are phase locking and constructive interference, achieved via counter-propagation of waves relative to the mean flow, action at a distance by the non-local velocity field induced by local vorticity anomalies, and an appropriate phase shift between the two waves. Normal mode instability may also occur whenever the waves are phase-locked with relative phase difference (defined here in terms of wave displacement) satisfying
 ${\rm\Delta}{\it\epsilon}\in (-{\rm\pi},0)$
. If the self-propagation speed of each wave is large compared to its local mean flow, the action-at-a-distance interaction should hinder the waves’ propagation speed to maintain phase locking. This occurs when
 ${\rm\Delta}{\it\epsilon}\in (-{\rm\pi}/2,0)$
, and generally characterises long wavelength dynamics. By contrast, the self-propagation speed of short wavelength waves counter to the mean flow is generally weak, hence instability is obtained when the waves help each other’s propagation to overcome the background flow while growing, and this occurs when
 ${\rm\Delta}{\it\epsilon}\in (-{\rm\pi},-{\rm\pi}/2)$
. Essentially, the mechanism may be summarised as ‘the induced velocity field of each Rossby wave keeps the other in step, and makes the other grow’ (Hoskins et al.
Reference Hoskins, McIntyre and Robertson1985). For more details, we refer the reader to the recent review of Carpenter et al. (Reference Carpenter, Tedford, Heifetz and Lawrence2013) and references therein.
In the case of figure 1, we have illustrated the fundamental mechanism using Rossby waves, but this is not the only possibility. As long as we have wave modes that counter-propagate against the mean flow, and they propagate vorticity, it is perfectly possible for a configuration displayed in figure 1 to occur. Harnik et al. (Reference Harnik, Heifetz, Umurhan and Lott2008), Rabinovich et al. (Reference Rabinovich, Umurhan, Harnik, Lott and Heifetz2011) and Guha & Lawrence (Reference Guha and Lawrence2013) have shown that, in the context of shear instabilities in stratified fluids, displacement of an interface leads to an induced buoyancy field, which in turn induces an appropriate vorticity field via baroclinic torque; thus Rossby–gravity waves may also propagate vorticity. When two vorticity and/or density interfaces are present, the interaction of the relevant wave modes leads to instability of the Kelvin–Helmholtz type (two vorticity interfaces; e.g. Drazin & Reid Reference Drazin and Reid1981; Baines & Mitsudera Reference Baines and Mitsudera1994), Holmboe type (essentially one vorticity and one density interface; Holmboe Reference Holmboe1962; Baines & Mitsudera Reference Baines and Mitsudera1994) and the Taylor–Caulfield type (two density interfaces; Taylor Reference Taylor1931; Caulfield Reference Caulfield1994). For recent reviews and studies of shear instabilities in stratified fluids and their interpretation in terms of wave interactions, see Balmforth, Roy & Caulfield (Reference Balmforth, Roy and Caulfield2012), Carpenter, Balmforth & Lawrence (Reference Carpenter, Balmforth and Lawrence2010), Carpenter et al. (Reference Carpenter, Tedford, Heifetz and Lawrence2013) and Guha & Lawrence (Reference Guha and Lawrence2013).
We show here that a similar interpretation holds in MHD. Wave displacement changes the magnetic field configuration, and since the Lorentz force is generally rotational, this in turn generates vorticity anomalies, so Alfvén waves may propagate vorticity. We can thus use the vorticity wave interaction framework as an interpretation for MHD shear instabilities. Furthermore, this dynamical framework explains why we have stabilisation or destabilisation by the magnetic field: the choice of basic state and parameter values affects the properties of the wave modes, and the presence of instability depends on whether supported wave modes can phase-lock and achieve mutual amplification.
Previous works on this topic have, for elucidation purposes, mainly considered piecewise-linear basic states with interfacial wave solutions of the form
 $q(x,y,t)=\hat{q}{\it\delta}(y-L)\text{e}^{\text{i}k(x-ct)}$
, where
 $y=L$
is the location of ‘jump’ in the profile. If one can show that the vorticity generation is non-zero only at these jumps, then interfacial wave solutions are exact solutions. A small number of jumps in the basic state results in a dispersion relation that is a low-order algebraic equation with closed-form solutions. Further analysis of the solutions may be carried out in a relatively straightforward manner (e.g. Rabinovich et al.
Reference Rabinovich, Umurhan, Harnik, Lott and Heifetz2011). One notable exception to this exactness in the hydrodynamic setting is the Charney problem (e.g. Heifetz et al.
Reference Heifetz, Methven, Hoskins and Bishop2004b
), where the presence of differential rotation
 ${\it\beta}$
results in non-localised vorticity generation. A similar phenomenon occurs for the MHD case. Although this does not pose a problem for the numerical computation of the eigenvalues and eigenfunctions, extra care is required when interpreting the results and the physical mechanism. This subtlety is explained in detail here, and the regimes where the interfacial wave assumption is a reasonable approximation to the full solution are explored accordingly for the instability problems we consider.
The layout of this article is follows. We provide the mathematical set-up in § 2, and explain how even simple Alfvén waves propagate vorticity via the Lorentz force. Additionally, we demonstrate the non-local nature of vorticity generation. For conceptual understanding of how waves in the system propagate vorticity, we consider the dynamics of interfacial waves in § 3. To demonstrate the instability mechanism, we solve the instability problem for two piecewise-linear basic states, for comparison with previous work employing the interacting vorticity wave formalism, and to test the performance of the interfacial wave assumption. In § 4, we consider the case where a background magnetic field stabilises the flow, taking the background flow to be the Rayleigh profile demonstrated in figure 1, together with a uniform background magnetic field. We first give details for the numerical method we employ, then analyse in some detail the full solution, providing plots of eigenfunctions and showing how the schematic in figure 1 is modified by MHD effects. Analytic solutions resulting from the interface assumption are derived, compared with the full solutions, and analysed accordingly. We give a similar account in § 5 for the case where a linear shear flow is destabilised by a spatially varying background magnetic field. We conclude and discuss our results in § 6.
2. Mathematical formulation
The crux of the mechanism displayed in figure 1 is that waves supported by the system and choice of basic state propagate vorticity, and their interaction leads to instability. In this section, we provide the general mathematical formulation, and explain how even simple Alfvén waves, supported when the background flow and field are uniform, may propagate vorticity via the Lorentz force. We consider the dynamics of waves when the flow and field are sheared in the next section.
2.1. Two-dimensional MHD and action of Lorentz force
We are interested here in ideal MHD instabilities. The homogeneous incompressible MHD equations are
 $$\begin{eqnarray}\displaystyle & \displaystyle \frac{\partial \boldsymbol{u}}{\partial t}+\boldsymbol{u}\boldsymbol{\cdot }\boldsymbol{{\rm\nabla}}\boldsymbol{u}=-\frac{1}{{\it\rho}_{0}}\boldsymbol{{\rm\nabla}}p+\frac{1}{{\it\mu}_{0}{\it\rho}_{0}}\boldsymbol{j}^{\ast }\times \boldsymbol{B}^{\ast }, & \displaystyle\end{eqnarray}$$
 $$\begin{eqnarray}\displaystyle & \displaystyle \frac{\partial \boldsymbol{B}^{\ast }}{\partial t}+\boldsymbol{u}\boldsymbol{\cdot }\boldsymbol{{\rm\nabla}}\boldsymbol{B}^{\ast }=\boldsymbol{B}^{\ast }\boldsymbol{\cdot }\boldsymbol{{\rm\nabla}}\boldsymbol{u}, & \displaystyle\end{eqnarray}$$
 $$\begin{eqnarray}\boldsymbol{{\rm\nabla}}\boldsymbol{\cdot }\boldsymbol{u}=0,\quad \boldsymbol{{\rm\nabla}}\boldsymbol{\cdot }\boldsymbol{B}^{\ast }=0.\end{eqnarray}$$
Here,
 $\boldsymbol{j}^{\ast }=\boldsymbol{{\rm\nabla}}\times \boldsymbol{B}^{\ast }$
is the current. In Cartesian coordinates, an analogue of Squire’s theorem holds (see e.g. Hughes & Tobias Reference Hughes and Tobias2001, and discussion therein), and thus we may formulate the problem in two dimensions. The domain is taken to be the
 $(x,y)$
plane, with periodicity in
 $x$
, and as yet unspecified in
 $y$
. The incompressibility condition allows us to write the velocity
 $\boldsymbol{u}$
and magnetic field
 $\boldsymbol{B}=\boldsymbol{B}^{\ast }/\sqrt{{\it\mu}_{0}{\it\rho}_{0}}$
(where
 ${\it\mu}_{0}$
is the permeability of free space and
 ${\it\rho}_{0}$
is the constant density) in terms of a streamfunction
 ${\it\psi}$
and magnetic potential
 $A$
, defined here as
 $\boldsymbol{u}=\boldsymbol{e}_{z}\times \boldsymbol{{\rm\nabla}}{\it\psi}$
and
 $\boldsymbol{B}=\boldsymbol{e}_{z}\times \boldsymbol{{\rm\nabla}}A$
. From this, the vorticity
 $q=\boldsymbol{e}_{z}\boldsymbol{\cdot }\boldsymbol{{\rm\nabla}}\times \boldsymbol{u}$
and current
 $j=\boldsymbol{e}_{z}\boldsymbol{\cdot }\boldsymbol{{\rm\nabla}}\times \boldsymbol{B}$
satisfy the relations
 $q={\rm\nabla}^{2}{\it\psi}$
and
 $j={\rm\nabla}^{2}A$
, and (2.1) take the equivalent form
 $$\begin{eqnarray}\frac{\text{D}q}{\text{D}t}=\boldsymbol{{\rm\nabla}}\boldsymbol{\cdot }(\,j\boldsymbol{B}),\quad \frac{\text{D}A}{\text{D}t}=0.\end{eqnarray}$$
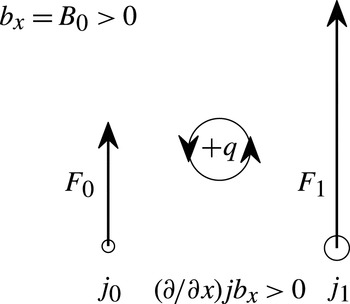
To see how the Lorentz force
 $\boldsymbol{{\rm\nabla}}\boldsymbol{\cdot }(\,j\boldsymbol{B})$
results in rotational motion, we suppose that we have, for the sake of argument,
 $B_{0}\boldsymbol{e}_{x}$
with
 $B_{0}=\text{const.}>0$
, and
 $$\begin{eqnarray}j(x_{0},y_{0})\boldsymbol{e}_{z}=j_{0}\boldsymbol{e}_{z},\quad j(x_{1},y_{1})\boldsymbol{e}_{z}=j_{1}\boldsymbol{e}_{z},\end{eqnarray}$$
where
 $j_{1}>j_{0}$
,
 $x_{1}>x_{0}$
and
 $y_{1}=y_{0}$
. This is a scenario where
 $\partial (\,jb_{x})/\partial x>0$
, and note here that
 $j$
and
 $b_{x}$
are ‘full’ quantities, as we have not yet linearised about a basic state. In general, the Lorentz term is
 $\boldsymbol{F}=\boldsymbol{j}\times \boldsymbol{B}$
, and, with the right-hand-screw convention, the current distribution above produces
 $$\begin{eqnarray}\boldsymbol{F}(x_{0},y_{0})=F_{0}\boldsymbol{e}_{y},\quad \boldsymbol{F}(x_{1},y_{1})=F_{1}\boldsymbol{e}_{y},\end{eqnarray}$$
with
 $F_{1}>F_{0}>0$
. A material line connecting
 $(x_{0},y_{0})$
and
 $(x_{1},y_{1})$
is rotated anticlockwise, i.e. this gives us a positive vorticity anomaly, and is consistent with positive forcing in (2.2); this is shown pictorially in figure 2. An analogous interpretation explains how
 $\partial (\,jb_{y})/\partial y>0$
results also in positive vorticity (e.g. rotate figure 2 anticlockwise by
 ${\rm\pi}/2$
).
A pictorial representation of how the vorticity is generated by the Lorentz term
 $\boldsymbol{j}\times \boldsymbol{B}=\boldsymbol{{\rm\nabla}}\boldsymbol{\cdot }(\,j\boldsymbol{B})$
in two-dimensional incompressible MHD; see text for details.

2.2. Linearisation and Alfvén wave dynamics
We now linearise (2.2) about a general basic state
 $\overline{U}(y)\boldsymbol{e}_{x}$
and
 $\overline{B}(y)\boldsymbol{e}_{x}$
(and thus
 $\overline{Q}=-\partial \overline{U}/\partial y$
and
 $\overline{J}=-\partial \overline{B}/\partial y$
), which results in the system of equations
 $$\begin{eqnarray}\displaystyle & \displaystyle \left(\frac{\partial }{\partial t}+\overline{U}\frac{\partial }{\partial x}\right)q=-\frac{\partial \overline{Q}}{\partial y}\frac{\partial {\it\psi}}{\partial x}+\overline{B}\frac{\partial j}{\partial x}+\frac{\partial \overline{J}}{\partial y}\frac{\partial A}{\partial x}, & \displaystyle\end{eqnarray}$$
 $$\begin{eqnarray}\displaystyle & \displaystyle \left(\frac{\partial }{\partial t}+\overline{U}\frac{\partial }{\partial x}\right)A=\overline{B}\frac{\partial {\it\psi}}{\partial x}, & \displaystyle\end{eqnarray}$$
 $\overline{B}(\partial j/\partial x)$
and
 $(\partial \overline{J}/\partial y)(\partial A/\partial x)$
are the linearised forms of
 $\partial (\,jb_{x})/\partial x$
and
 $\partial (\,jb_{y})/\partial y$
, respectively, so they result in vortical motion as in figure 2. The cross-stream displacement
 ${\it\eta}$
is given by
 $$\begin{eqnarray}v=\frac{\partial {\it\psi}}{\partial x}=\left(\frac{\partial }{\partial t}+\overline{U}\frac{\partial }{\partial x}\right){\it\eta},\end{eqnarray}$$
and, substituting this into (2.5b ) and integrating results in the relation
 $$\begin{eqnarray}A=\overline{B}{\it\eta}+A_{0}(y).\end{eqnarray}$$
We will take the non-advective contribution
 $A_{0}$
associated with non-conservative effects to be zero for the rest of this work.
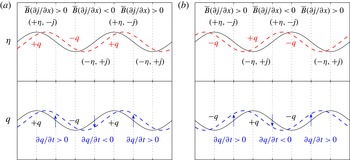
Pictorial representation for wave dynamics associated with
 $\overline{B}(\partial j/\partial x)$
, with
 $\overline{B}>0$
without loss of generality. The upper and lower panels are the
 ${\it\eta}$
and
 $q$
initial conditions, where (a)
 ${\it\eta}\sim q$
and (b)
 ${\it\eta}\sim -q$
. The solid black line shows tendencies associated with the chosen initial condition; grey dashed line (blue online; lower panels) is the influence of the
 ${\it\eta}$
profile on
 $q$
; and grey dashed line (red online; upper panels) is the influence of the
 $q$
profile on
 ${\it\eta}$
. See text for description.

For simple Alfvén waves (e.g. Biskamp Reference Biskamp2003), we take the case
 $\overline{U}=0$
and
 $\overline{B}=\text{constant}>0$
without loss of generality. With this, the governing equations become
 $\partial q/\partial t=\overline{B}(\partial j/\partial x)$
and
 $\partial {\it\eta}/\partial t=\partial {\it\psi}/\partial x$
. We observe that
 ${\it\eta}\sim A$
from relation (2.7), i.e. a positive displacement is correlated with a positive
 $A$
anomaly. Furthermore, since
 ${\rm\nabla}^{2}A=j$
and the Laplacian is a negative definite operator, this implies the relation
 ${\it\eta}\sim -j$
.
One main difference between Alfvén waves and Rossby waves is that the former are governed by a second-order rather than a first-order differential equation. Thus two initial conditions need to be specified, in this case on
 $q$
and
 ${\it\eta}$
. In figure 3 we consider the cases where the initial conditions (in black solid) are in phase and in antiphase. Focusing on figure 3(a) where
 ${\it\eta}\sim q$
, since
 ${\it\eta}\sim -j$
, we have the appropriate
 $\overline{B}(\partial j/\partial x)$
at the wave nodes, which thus results in the appropriate
 $\partial q/\partial t$
tendencies for the
 $q$
configuration in the lower panel (in grey dashed; blue dashed online); this moves the
 $q$
profile to the right. At the same time, the
 $q$
initial condition together with the relation
 ${\it\psi}\sim -q$
implies a velocity field that moves the
 ${\it\eta}$
profile also to the right (see also the waves in figure 1), and thus the whole wave propagates in concert to the right. An analogous argument for figure 3(b) where the initial condition has
 ${\it\eta}\sim -q$
shows the wave propagating instead to the left. A superposition of these equal-amplitude right- and left-going waves results in a standing wave configuration (see e.g. appendix B of Harnik et al.
Reference Harnik, Heifetz, Umurhan and Lott2008). It may be seen from the resulting linearised equations that if we consider modal solutions of the form
 $\text{e}^{\text{i}k(x-ct)}$
(we take the
 $y$
wavenumber to be zero for simplicity),
 $c_{\mathit{a}}=\pm \overline{B}$
for Alfvén waves, and
 $c>0$
implies we have
 ${\it\eta}\sim -j\sim q$
, whilst
 $c<0$
implies that
 ${\it\eta}\sim -j\sim -q$
. These relations are consistent with the schematic presented in figure 3(a,b) respectively. More generally, as long as the
 ${\it\eta}$
and
 $q$
initial conditions are not in quadrature with each other, we obtain travelling wave solutions associated with the
 $\overline{B}(\partial j/\partial x)$
term.
2.3. Green’s function formulation
Wave interaction via action at a distance may be represented mathematically by a Green’s function formalism, employed by previous authors (e.g. Harnik et al.
Reference Harnik, Heifetz, Umurhan and Lott2008). Noting that
 $j={\rm\nabla}^{2}A$
and
 ${\it\psi}={\rm\nabla}^{2}q$
, and taking the domain to be
 $x$
-periodic, a Fourier transform leads to
 $$\begin{eqnarray}j=\left(-k^{2}+\frac{\partial ^{2}}{\partial y^{2}}\right)A,\quad q=\left(-k^{2}+\frac{\partial ^{2}}{\partial y^{2}}\right){\it\psi},\end{eqnarray}$$
where
 $k$
denotes the
 $x$
wavenumber. Equations (2.8) may be formally inverted to give
 $$\begin{eqnarray}\left(\begin{array}{@{}c@{}}A(y)\\ {\it\psi}(y)\end{array}\right)=\int G(y,y^{\prime })\left(\begin{array}{@{}c@{}}j(y^{\prime })\\ q(y^{\prime })\end{array}\right)\!\text{d}y^{\prime },\end{eqnarray}$$
where
 $G(y,y^{\prime })$
is a Green’s function chosen to satisfy the boundary conditions. Then, with the governing equations (2.5a
) and (2.6), and substituting for the appropriate terms using relations (2.7) and (2.9), the problem is completely specified in terms of
 $q$
and
 ${\it\eta}$
, and all intermediate effects from changes in
 $A$
and
 $j$
are implicit.
For the piecewise-linear profiles that we consider in the subsequent sections, we note that this approach of using Green’s functions guarantees the continuity of the total pressure and displacement everywhere. The kinematic condition for the continuity of the interface is already invoked in (2.6). From the
 $y$
component of the linearised momentum equation, we observe that the inverted
 $v$
and
 $b_{y}$
from
 $q$
and
 $j$
are guaranteed to be continuous by properties of the Green’s function, so the total pressure
 $p$
is also continuous since
 $\overline{U}$
and
 $\overline{B}$
are continuous.
2.4. Generation of vorticity away from interfaces
If the background profiles are piecewise-linear, and, without loss of generality, a ‘jump’ is located at
 $y=L$
, then
 $q\sim \hat{q}{\it\delta}(y-L)$
is exact if it can be shown that vorticity generation is non-zero only at that location. One notable exception, however, is the Charney problem (e.g. Heifetz et al.
Reference Heifetz, Methven, Hoskins and Bishop2004b
), where vorticity generation is non-local, and we demonstrate here that this occurs in the MHD case also. To show this, we take the Laplacian of (2.5b
), and the resulting linearised equation for
 $j$
is given by
 $$\begin{eqnarray}\left(\frac{\partial }{\partial t}+\overline{U}\frac{\partial }{\partial x}\right)j=\left(\frac{\partial \overline{Q}}{\partial y}+2\overline{Q}\frac{\partial }{\partial y}\right)\frac{\partial A}{\partial x}+\overline{B}\frac{\partial q}{\partial x}-\left(\frac{\partial \overline{J}}{\partial y}+2\overline{J}\frac{\partial }{\partial y}\right)\frac{\partial {\it\psi}}{\partial x}.\end{eqnarray}$$
Then, even if
 $(\partial \overline{Q}/\partial y,\partial \overline{J}/\partial y)=({\rm\Delta}\overline{Q},{\rm\Delta}\overline{J}){\it\delta}(y-L)$
, with
 $(\,j,q)\sim (\,\hat{\jmath },\hat{q}){\it\delta}(y-L)$
at
 $t=0$
, if
 $\overline{Q}$
and
 $\overline{J}$
are non-zero at
 $y\neq L$
, this generates non-zero
 $j$
away from
 $y=L$
, which in turn results in non-zero
 $q$
away from
 $y=L$
from the vorticity equation. So
 ${\it\delta}$
-function solutions are generically not self-consistent solutions (one example where
 ${\it\delta}$
-function solutions are exact solutions is when
 $\overline{B}$
is zero everywhere except at isolated locations, e.g. current sheet profiles), thus interfacial wave solutions fail to capture all the dynamics, since we are setting to zero contributions away from the interfaces and we do not know a priori whether the neglected contributions are significant to the dynamics. Further, non-local generation of vorticity implies that critical layers will play a role in the dynamics (e.g. Rabinovich et al.
Reference Rabinovich, Umurhan, Harnik, Lott and Heifetz2011).
Although we will choose
 $q$
and
 ${\it\eta}$
as the fundamental variables for the bulk of the discussion, this is not the only possibility. It turns out there are some numerical advantages in utilising
 $q$
and
 $j$
as the variables when computing for the full numerical solutions. The two choices are of course equivalent as far as the full solution is concerned. A brief discussion of the (
 $q,j$
) equations is given in appendix B and shows how they differ when interfacial wave dynamics are the focus.
3. Interfacial wave dynamics
In this section, we assume solutions in
 $q$
and
 $j$
take the form of
 ${\it\delta}$
-functions to elucidate how we may expect waves to propagate vorticity. We do this primarily for conceptual progress, to provide links between the wave eigenstructure and the underlying physics.
We consider an unbounded
 $y$
domain; the Green’s function for this setting is given by
 $$\begin{eqnarray}G(y,y^{\prime })=-\frac{1}{2k}\text{e}^{-k|y-y^{\prime }|}.\end{eqnarray}$$
We take piecewise-linear
 $\overline{U}$
and
 $\overline{B}$
(thus piecewise-constant
 $\overline{Q}$
and
 $\overline{J}$
), with
 $$\begin{eqnarray}\frac{\partial \overline{Q}}{\partial y}={\rm\Delta}\overline{Q}{\it\delta}(y-L),\quad \frac{\partial \overline{J}}{\partial y}={\rm\Delta}\overline{J}{\it\delta}(y-L).\end{eqnarray}$$
Equations (2.5a ) and (2.6) then become
 $$\begin{eqnarray}\displaystyle & \displaystyle \left(\frac{\partial }{\partial t}+\text{i}k\overline{U}\right)q=\text{i}k[-{\rm\Delta}\overline{Q}{\it\psi}{\it\delta}(y-L)+\overline{B}j+{\rm\Delta}\overline{J}A{\it\delta}(y-L)], & \displaystyle\end{eqnarray}$$
 $$\begin{eqnarray}\displaystyle & \displaystyle \left(\frac{\partial }{\partial t}+\text{i}k\overline{U}\right){\it\eta}=\text{i}k{\it\psi}. & \displaystyle\end{eqnarray}$$
Bearing in mind the limitations already discussed in § 2.4, we consider solutions of the form
 $$\begin{eqnarray}q=\hat{q}\,\text{e}^{-\text{i}kct}{\it\delta}(y-L),\quad j=\hat{\jmath }\,\text{e}^{-\text{i}kct}{\it\delta}(y-L).\end{eqnarray}$$
With the inversion relation (2.9), the Green’s function (3.1) for this domain, and taking modal solutions for
 ${\it\psi}$
and
 $A$
, we obtain the relations
 $$\begin{eqnarray}{\it\psi}(L)=-\frac{\hat{q}}{2k},\quad A(L)=-\frac{{\hat{j}}}{2k}.\end{eqnarray}$$
Using
 $A=\overline{B}{\it\eta}$
from (2.7), this results in
 $\hat{\jmath }=-2k\overline{B}(L){\it\eta}(L)$
. Together, equations (3.3) become
 $$\begin{eqnarray}(\overline{U}-c)\hat{q}=\frac{{\rm\Delta}\overline{Q}}{2k}\hat{q}-2k\overline{B}\left(\overline{B}-\frac{{\rm\Delta}\overline{J}}{2k}\right){\it\eta},\quad (\overline{U}-c){\it\eta}=-\frac{1}{2k}\hat{q},\end{eqnarray}$$
where all the functions associated with the basic state are taken to be evaluated at
 $y=L$
. Combining the two equations in (3.6) and solving the resulting quadratic equation in
 $(\hat{q}/{\it\eta})$
, the eigenstructure and the dispersion relation read
 $$\begin{eqnarray}\hat{q}^{\pm }=2k(c^{\pm }-\overline{U}){\it\eta}^{\pm },\quad (c^{\pm }-\overline{U})=-\frac{{\rm\Delta}\overline{Q}}{4k}\pm \sqrt{\left(\frac{{\rm\Delta}\overline{Q}}{4k}\right)^{2}+\overline{B}\left(\overline{B}-\frac{{\rm\Delta}\overline{J}}{2k}\right)}.\end{eqnarray}$$
The ‘plus’ branch is the one where the plus sign is taken, and analogously for the ‘minus’ branch. We observe that, when the waves are neutral, the plus branch is associated with a wave propagating to the right, relative to the mean flow, and vice versa for the minus branch.
3.1. A physical description of interfacial wave dynamics
The eigenstructure (3.7) tells us how
 $q$
is related to
 ${\it\eta}$
directly from the equations. To understand the relation in terms of changes in the magnetic field configuration and how it results in vorticity anomalies and wave propagation, it is informative to consider how the individual components act. In (3.7), the presence of the
 ${\rm\Delta}\overline{Q}$
,
 $\overline{B}^{2}$
and
 $\overline{B}{\rm\Delta}\overline{J}$
terms is associated with the first, second and third terms on the right-hand side of (2.5a
), respectively. The first term of the three is the standard Rossby wave mechanism, for which the restoring force comes from the background vorticity gradient. The wave propagation is that already described in figure 1. The second term is essentially the Alfvén wave case described in the previous subsection; the eigenstructure relation (3.7) may be seen to be consistent with the schematic presented in figure 3.
The third term on the right-hand side of (2.5a ) is
 $$\begin{eqnarray}\frac{\partial \overline{J}}{\partial y}\frac{\partial A}{\partial x}=\frac{\partial \overline{J}}{\partial y}b_{y}=\overline{B}\frac{\partial \overline{J}}{\partial y}\frac{\partial {\it\eta}}{\partial x},\end{eqnarray}$$
upon using the relation (2.7); we again take
 $\overline{B}\geqslant 0$
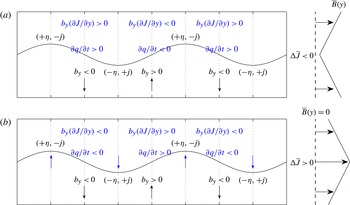
without loss of generality. We show in figure 4 a schematic depiction of how the
 $b_{y}(\partial \overline{J}/\partial y)$
term acts from the
 ${\it\eta}$
initial condition. In figure 4(a), we have a case where
 $\overline{B}{\rm\Delta}\overline{J}<0$
. We still have
 ${\it\eta}\sim -j$
(see paragraph just after (2.7)), and the distribution of
 $b_{y}$
at the nodes of the wave (in black) then follows from the relation
 $b_{y}=\overline{B}(\partial {\it\eta}/\partial x)$
. With this, the initial condition results in a
 $b_{y}(\partial \overline{J}/\partial y)$
distribution that in turn implies
 $\partial q/\partial t$
tendency at the nodes (in grey; blue online). This configuration is exactly like the one in figure 3, and thus we have travelling wave solutions. If instead we have
 $\overline{B}{\rm\Delta}\overline{J}>0$
as in figure 4(b), the
 $\partial q/\partial t$
tendencies at the nodes are reversed. Arguments similar to those used in figure 3 then show that the
 ${\it\eta}$
and
 $q$
initial conditions propagate in opposite directions to each other unless they are in quadrature, for which no travelling wave configuration is possible.
Pictorial representation for wave dynamics associated with
 $b_{y}(\partial \overline{J}/\partial y)$
, the third term on the right-hand side of (2.5a
), with (a)
 $\overline{B}{\rm\Delta}\overline{J}<0$
and (b)
 $\overline{B}{\rm\Delta}\overline{J}>0$
; without loss of generality,
 $\overline{B}>0$
. The initial conditions are given in black; and the resulting tendencies arising from the choice of initial conditions are given in grey (blue online). See text for more details.

When the
 ${\it\eta}$
and
 $q$
initial conditions are in quadrature, this implies that we have a growing/decaying standing wave configuration. For the hydrodynamic stratified setting, the schematic presented in figure 4(b) is formally similar to an interpretation of Rayleigh–Taylor instability (e.g. Harnik et al.
Reference Harnik, Heifetz, Umurhan and Lott2008). Although this suggests a local instability even in the absence of a background flow (this is not impossible, since magnetostatic profiles can suffer ideal MHD instabilities, e.g. chapter 19 of Goldston & Rutherford (Reference Goldston and Rutherford1995)), a theorem due to Lundquist states that, in the case where the background magnetic field in magnetohydrostatic equilibrium has straight field lines, the perturbation energy cannot grow, and the background state is stable (Lundquist Reference Lundquist1951, paragraph of equation 29). This stability condition is satisfied in planar geometry by
 $\overline{B}(y)$
. The prediction of instability at the local level when the state is globally stable presumably stems from the fact that we are considering isolated
 ${\it\delta}$
-function solutions for the purposes of elucidating the physics linking vorticity anomalies with wave displacement. The neglected contributions and the resulting mutual interactions will presumably suppress this apparent instability.
In the presence of a background shear flow, however, instability is possible. As highlighted in Stern (Reference Stern1963), taking a profile with
 $\overline{B}{\rm\Delta}\overline{J}<0$
everywhere in the domain results in instability when the background flow is stable in the hydrodynamic setting. Similar investigations in planar geometry of the destabilising nature of the magnetic field have mainly considered profiles where
 $\overline{B}{\rm\Delta}\overline{J}<0$
in the domain, so here, for one of the examples, we also take a basic state that satisfies this condition.
4. Unstable profile stabilised by uniform magnetic field
Having demonstrated how we expect waves to propagate vorticity anomalies, we now consider two instability problems to demonstrate the instability mechanism, one where the field stabilises an unstable flow, and the other where the field destabilises a stable flow. The two basic states are chosen so that there is only one non-dimensional parameter, given by
 $M=\tilde{B}/\tilde{U}$
, where the tildes denotes the relevant Alfvén speed and velocity scales. We note that, from linear analysis, there is a stability theorem that states that
 $|\overline{B}|\geqslant |\overline{U}|$
pointwise everywhere guarantees the absence of exponentially growing instabilities (e.g. Hughes & Tobias Reference Hughes and Tobias2001); the basic states are tailored so that the case
 $M\geqslant 1$
is equivalent to the aforementioned condition, with
 $M=1$
the case where we have equality.
We first provide details of the numerical method we employ to obtain our full solutions, then analyse these solutions and explain how the instability mechanism detailed in figure 1 is modified by MHD effects. To test the validity of taking only a small number of interfaces, we consider the approximated problem where only two interfaces are taken; closed-form solutions may be obtained from the resulting low-order algebraic system, and these are compared with the full solutions accordingly.
4.1. Numerical method
The governing equations depend on the choice of variables we employ for the numerical scheme. If we describe the dynamics in terms of
 $q$
and
 ${\it\eta}$
, the governing equations are (2.5a
) and (2.6). Upon using
 $j={\rm\nabla}^{2}A={\rm\nabla}^{2}(\overline{B}{\it\eta})$
, where we have used the identity (2.7), and with
 ${\it\psi}=\int q(y^{\prime })G(y,y^{\prime })\text{d}y^{\prime }$
, the resulting system of equations (2.5a
) and (2.6) may be written in discretised form as
 $$\begin{eqnarray}\frac{\partial }{\partial t}\left(\begin{array}{@{}c@{}}q\\ {\it\eta}\end{array}\right)=-\text{i}k\left(\begin{array}{@{}cc@{}}\overline{\unicode[STIX]{x1D61C}}+\overline{\unicode[STIX]{x1D618}}^{\prime }\unicode[STIX]{x1D60E} & -\overline{\unicode[STIX]{x1D609}}^{2}(-k^{2}\unicode[STIX]{x1D610}+\unicode[STIX]{x1D60B}_{2})+2\overline{\unicode[STIX]{x1D609}}\overline{\unicode[STIX]{x1D611}}\unicode[STIX]{x1D60B}_{1}\\ -\unicode[STIX]{x1D60E} & \overline{\unicode[STIX]{x1D61C}}\end{array}\right)\left(\begin{array}{@{}c@{}}q\\ {\it\eta}\end{array}\right),\end{eqnarray}$$
where, for example,
 $\overline{\unicode[STIX]{x1D61C}}=\overline{U}(y_{i})\times \unicode[STIX]{x1D610}$
, a prime denotes a
 $y$
derivative, and
 $\unicode[STIX]{x1D60B}_{1,2}$
are the appropriate discretised differential operators for
 $y$
derivatives. Taking uniform grid spacing
 ${\rm\Delta}y$
, we take, for example,
 $\partial \overline{Q}/\partial y={\rm\Delta}\overline{Q}/{\rm\Delta}y$
at the
 $y_{j}$
entry when
 $\partial \overline{Q}/\partial y={\rm\Delta}\overline{Q}{\it\delta}(y-y_{j})$
. If a quantity
 $\overline{J}$
is discontinuous at
 $y_{j}$
, we take
 $\overline{J}(y_{j})=[\overline{J}(y_{j-1})+\overline{J}(y_{j+1})]/2$
. The discretised Green’s function is given by (Harnik et al.
Reference Harnik, Heifetz, Umurhan and Lott2008)
 $$\begin{eqnarray}\unicode[STIX]{x1D60E}_{m,n}=-\frac{{\rm\Delta}y}{2k}\text{e}^{-k|y_{m}-y_{n}|};\end{eqnarray}$$
this is a dense matrix. The system may be advanced in time accordingly if one considers an initial value problem in the context of non-modal instabilities (e.g. Constantinou & Ioannou Reference Constantinou and Ioannou2011). For
 $(q,{\it\eta})=(\tilde{q},\tilde{{\it\eta}})\,\text{e}^{-\text{i}k(x-ct)}$
, the eigenvalues and eigenvectors of the system (4.1) are the normal mode solutions.
It turns out that it is numerically more stable to solve the problem in (
 $q,j$
) variables; thus we couple (2.5a
) with (2.10) instead of (2.6). A similar manipulation using
 $A=\int j(y^{\prime })G(y,y^{\prime })\,\text{d}y^{\prime }$
results in
 $$\begin{eqnarray}\frac{\partial }{\partial t}\left(\begin{array}{@{}c@{}}q\\ j\end{array}\right)=-\text{i}k\left(\begin{array}{@{}cc@{}}\overline{\unicode[STIX]{x1D61C}}+\overline{\unicode[STIX]{x1D618}}^{\prime }\unicode[STIX]{x1D60E} & -\overline{\unicode[STIX]{x1D609}}-\overline{\unicode[STIX]{x1D611}}^{\prime }\unicode[STIX]{x1D60E}\\ -\overline{\unicode[STIX]{x1D609}}+\overline{\unicode[STIX]{x1D611}}^{\prime }\unicode[STIX]{x1D60E}+2\overline{\unicode[STIX]{x1D611}}\unicode[STIX]{x1D60E}^{\prime } & \overline{\unicode[STIX]{x1D61C}}-\overline{\unicode[STIX]{x1D618}}^{\prime }\unicode[STIX]{x1D60E}-2\overline{\unicode[STIX]{x1D618}}\unicode[STIX]{x1D60E}^{\prime }\end{array}\right)\left(\begin{array}{@{}c@{}}q\\ j\end{array}\right),\end{eqnarray}$$
where, in this case,
 $\unicode[STIX]{x1D60E}^{\prime }$
is the derivative of the Green’s function, with discretised form defined to be
 $$\begin{eqnarray}\unicode[STIX]{x1D60E}_{m,n}^{\prime }=\left\{\begin{array}{@{}ll@{}}+({\rm\Delta}y/2)\text{e}^{-k(y_{m}-y_{n})},\quad & y_{m}>y_{n},\\ -({\rm\Delta}y/2)\text{e}^{+k(y_{m}-y_{n})},\quad & y_{m}<y_{n},\\ 0,\quad & y_{m}=y_{n}.\end{array}\right.\end{eqnarray}$$
The value of 0 is taken at
 $y_{m}=y_{n}$
because the wave supported on
 $y_{m}$
does not induce any
 $u$
or
 $b_{x}$
at
 $y_{m}$
. The lack of derivative operators in this latter matrix (4.3) results in a lower condition number when compared to the (
 $q,{\it\eta}$
) formulation in the test examples we have considered. The two formulations are of course equivalent, and the relevant eigenfunctions may be obtained from both formulations; here, the numerical results presented were obtained by solving (4.3).
Results presented here have been subjected to domain size and resolution tests. A domain size of
 $y\in [-5,5]$
was employed. A resolution of
 ${\rm\Delta}y=10^{-2}$
(in non-dimensional units) was found to be sufficient for modes away from marginality, while for modes close to marginality, a resolution of
 ${\rm\Delta}y=5\times 10^{-3}$
was employed instead to avoid the appearance of spurious instabilities. The linear algebra problem was solved using the eig(A) command in MATLAB, and we pick out the mode with the largest imaginary part. Sample tests shows the most unstable eigenvalues obtained are well separated from the rest of the spectrum and, further, occur in conjugate pairs (a more general result for ideal instabilities, which may be shown via consideration of the adjoint form of the governing equation (see e.g. Drazin & Reid Reference Drazin and Reid1981)).
4.2. Basic state and full numerical solution
We consider first the Rayleigh profile as the background flow, with a uniform background magnetic field. In dimensional form, we take
 $$\begin{eqnarray}\overline{U}(y)=\left\{\begin{array}{@{}ll@{}}{\it\Lambda}L,\quad & y>L,\\ {\it\Lambda}y,\quad & |y|<L,\\ -{\it\Lambda}L,\quad & y<-L,\end{array}\right.\quad \overline{B}(y)=B_{0}.\end{eqnarray}$$
For this problem,
 $\overline{J}=0$
and
 $\partial \overline{J}/\partial y=0$
. Scaling by
 $$\begin{eqnarray}\tilde{B}=B_{0},\quad \tilde{T}=\frac{1}{{\it\Lambda}},\quad \tilde{L}=L,\quad \tilde{U} ={\it\Lambda}L,\end{eqnarray}$$
the resulting non-dimensional parameter is
 $M=\tilde{B}/\tilde{U}$
, a ratio of the typical Alfvén velocity and the shear velocity, effectively a measure of the field strength, and
 $\overline{B}\rightarrow M$
and
 $j\rightarrow Mj$
in (4.3) (as well as (4.1)) upon rescaling. Values
 $M\geqslant 1$
correspond to the regime where there are no linear normal mode instabilities. The linear stability properties of this basic state have been studied by Ray & Ershkovich (Reference Ray and Ershkovich1983), who focused on computation of the growth rates of the instabilities via a shooting method, but not on the structure of the eigenfunctions.
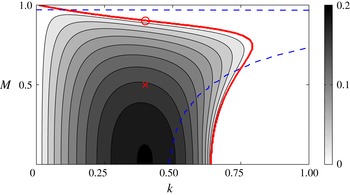
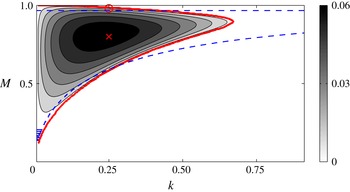
We show in figure 5 the growth rates of the full solution
 $(kc_{i})_{\mathit{full}}$
over parameter space; we note that
 $c_{r}=0$
for all unstable modes here, a result arising from the symmetries possessed by the basic state. The calculated growth rates are in agreement with the results documented in Ray & Ershkovich (Reference Ray and Ershkovich1983) after taking into account the different scalings used. The explanation for the shape of the instability region is that, at
 $M=0$
, there is no phase locking for short waves since they are too slow to overcome the background advection. At moderate
 $M$
, these short waves are now sufficiently fast (from the non-dimensional version of (3.7)) to overcome the background advection, become phase-locked and constructively interfere. At large enough
 $M$
, all waves become too fast, and phase locking is not possible.
Growth rates
 $(kc_{i})_{\mathit{full}}$
of the full numerical solution associated with the basic state (4.5), with the thick (red online) curve denoting the stability boundary. Here,
 $c_{r}=0$
for all unstable modes. The (red online) cross and circle correspond to the parameter location associated with the eigenfunction displayed in figure 6(a,b) respectively. The resonance condition is plotted as the dashed (blue online) line.

Sometimes it is informative in such investigations to plot the so-called resonance conditions (e.g. Carpenter et al.
Reference Carpenter, Tedford, Heifetz and Lawrence2013). These are the locations where the counter-propagating interfacial waves have matching phase speeds, taking into account advection by the background flow. In this setting, these are the values of
 $k$
where
 $$\begin{eqnarray}c_{1}^{-}(M,k)=1+c_{\mathit{ra}}^{-}(M,k)\quad \text{and}\quad c_{2}^{+}(M,k)=-1-c_{\mathit{ra}}^{-}(M,k)\end{eqnarray}$$
are equal for some given
 $M$
, with
 $c_{\mathit{ra}}^{-}=-(1/4k)-\sqrt{(1/4k)^{2}+M^{2}}$
the non-dimensional phase speed of the counter-propagating waves; the signs in (4.7) take into account the fact that
 $c_{\mathit{ra}}^{-}$
is negative. The idea is that, if interacting interfacial counter-propagating waves are the only things contributing to the dynamics, then the location where the resonance condition is satisfied should be near to the location of optimal growth; if this is not the case, it shows that other dynamics (e.g. critical layers, pro-propagating modes) are important. It also gives an indication of where in parameter space the interaction required for instability can be expected, especially at large
 $k$
. We overlay the location where the resonance condition is satisfied in figure 5, and we see that the agreement with the location of optimal growth is only reasonable for small
 $M$
, so we expect dynamics away from the interface not to be negligible at larger
 $M$
and also at larger
 $k$
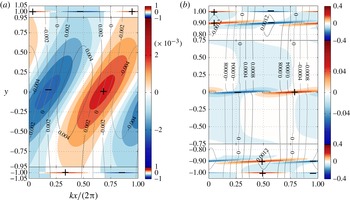
. This is confirmed by plots of the eigenfunctions; we show in figure 6 two eigenfunctions, one configuration that is generic for parameter values away from the stability boundary, and one at the same wavenumber, but at increased
 $M$
, and is a sample configuration for a case close to marginality. The parameter choices are given by the (red online) cross and circle in figure 5, respectively.
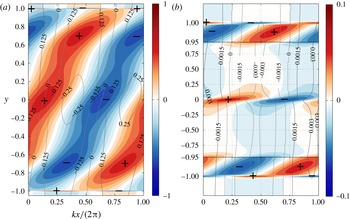
Representative eigenfunctions (normalised by the maximum absolute value of
 $q$
) of the profile given in (4.5), both for
 $k=0.4$
, but with (a)
 $M=0.5$
and (b)
 $M=0.9$
. The shading (red and blue online) is for positive and negative
 $q$
(respectively), and
 ${\it\eta}$
is plotted as labelled contours; note the difference in the colour scales used between the panels. The
 $y$
scale is continuous between the panels (note the displacement contours are continuous in magnitude) but is not linear for display purposes.

In figure 6(a), the eigenfunction configuration is generic in that the dominant contributions to vorticity come from the two interfaces at
 $y=\pm 1$
, and the contributions in the
 $|y|\neq 1$
region are comparatively small (note the greyscale (colour) axis scales of the corresponding panels). The outer two vorticity contributions have a phase shift that is close to
 ${\rm\pi}/2$
(0.25 in the normalised units used in the figure), and the middle tilted structure has vorticity contributions that have opposite signs in between two like-signed vorticity contributions from the interface. The vorticity eigenfunction is, going from top to bottom, in antiphase, in quadrature and in phase with displacement, i.e.
 $q\sim (-{\it\eta},-\text{i}{\it\eta},+{\it\eta})$
, respectively. The outer two waves are really counter-propagating vorticity waves, and the inner wave resembles a standing wave. We have further carried out a decomposition of the vorticity eigenfunction into its constituents using (2.5a
); in this case, the non-zero terms are
 $-(\partial {\it\psi}/\partial x)(\partial \overline{Q}/\partial y)$
and
 $\overline{B}(\partial j/\partial x)$
, divided by
 $\overline{U}-c$
. At the interface locations, the vorticity contribution comes from both terms, with the
 $-(\partial {\it\psi}/\partial x)(\partial \overline{Q}/\partial y)$
term being the dominant contribution; the effect of the
 $\overline{B}(\partial j/\partial x)$
contribution is to alter the magnitude and the phase difference between the two waves.
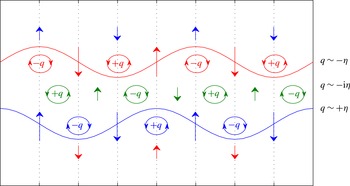
Figure 6(a) is represented schematically in figure 7. With the configuration depicted, we see that the presence of the middle standing wave counteracts the effects of the vorticity anomalies associated with the outer counter-propagating waves. If we were to make the interface assumption, we would neglect the contributions away from the interfaces and remove this centre contribution, and we would expect to over-estimate (i) the growth rates and (ii) the propagation speed, the region where phase locking is possible, and thus the size of the instability region. We would expect the over-estimation to be most significant when the field strength is large, and for short waves. This is because the interaction decreases exponentially with wavenumber, so the overall constructive interference between the counter-propagating waves is weaker for short waves than for long waves, and it is short waves that are too slow to overcome the background advection.
Schematic of how the critical layer contribution plays a role in the dynamics. Without the centre contribution (denoted online by the green parts), the dynamics of the two waves (
 $q\sim -{\it\eta}$
and
 $q\sim +{\it\eta}$
) are as in figure 1. The centre wave acts as a standing wave with
 $q\sim -\text{i}{\it\eta}$
, with a resulting vorticity configuration as depicted in the figure. Then it is seen that the extra contributions act against the vorticity anomalies associated with the counter-propagating waves, and is thus a stabilising effect.

The phase relation for the middle contribution
 $q\sim -\text{i}{\it\eta}$
may be obtained by considering the vorticity equation (2.5a
). Away from
 $y=\pm 1$
, we have, for this problem,
 $$\begin{eqnarray}q=\frac{M^{2}j}{(\overline{U}-c_{r})-\text{i}c_{i}}.\end{eqnarray}$$
We may suppose that
 $q$
is likely to be maximised at the location where
 $\overline{U}-c_{r}=0$
, which is
 $y=0$
here since
 $c_{r}=0$
, resulting in the relation
 $q\sim \text{i}M^{2}j/c_{i}$
. From relation (2.7), we have
 $j\sim {\rm\nabla}^{2}{\it\eta}$
, and so
 $q\sim -\text{i}M^{2}{\it\eta}/c_{i}$
, as required. This is analogous to what was found in the stratified setting for Rabinovich et al. (Reference Rabinovich, Umurhan, Harnik, Lott and Heifetz2011). The effect of the critical level is expected to be more pronounced when we are near marginality.
As we approach marginality via increasing
 $k$
and/or increasing
 $M$
, the tilting of the middle structure increases, becomes thinner in the cross-stream extent, and eventually splits into three tilted structures. A sample case for which we approach marginality by increasing
 $M$
is shown in figure 6(b). The first thing to note is that vorticity generation is significant at the location where
 $\overline{U}(y)-c_{r}=0$
, but also at around
 $y=\pm M$
. The mechanistic interpretation for instability and stabilisation, however, is not significantly altered. There is perhaps some cancellation of the contributions due to the tilted structures, but, schematically, we still have two counter-propagating waves, with a standing wave in between that counteracts the vorticity contributions associated with the counter-propagating waves, again as in figure 7.
The structures at
 $y=\pm M$
are perhaps not too surprising once we note that Alfvén waves are non-dispersive and have non-dimensional phase speed
 $c_{\mathit{a}}=\pm M$
in our setting, regardless of the wavenumber. Thus, from a physical point of view, we have forced short-wavelength standing Alfvén waves since
 $\overline{U}(y)-c_{\mathit{a}}=0$
at these locations. From a mathematical point of view, we recall that, equivalently, the modal problem with general basic state in two-dimensional incompressible MHD in non-dimensional form is governed by the second-order differential equation (e.g. Hughes & Tobias Reference Hughes and Tobias2001)
 $$\begin{eqnarray}\frac{\text{d}}{\text{d}y}\left(S^{2}(y)\frac{\text{d}{\it\eta}}{\text{d}y}\right)-k^{2}S^{2}(y){\it\eta}=0,\quad S^{2}(y)=(\overline{U}(y)-c)^{2}-M^{2}\overline{B}^{2}(y).\end{eqnarray}$$
If we take the view that critical levels are where the governing eigenvalue differential equations break down, the critical levels can occur when
 $\overline{U}(y)-c=0$
and also where
 $\overline{U}(y)-c=\pm M\overline{B}(y)$
, with the latter associated with Alfvén waves. The appearance of multiple critical levels is not an isolated feature in MHD, and appears for example in shear flow problems on the
 $f$
plane (e.g. appendix B of Lott (Reference Lott2003)).
The second point to note for figure 6(b) is the change in the phase shift of the counter-propagating components compared to figure 6(a), even though the same wavenumber was chosen. The stabilisation does not come solely from increasing the strength of the centre contribution, unlike in one of the examples considered by Rabinovich et al. (Reference Rabinovich, Umurhan, Harnik, Lott and Heifetz2011). By changing the field strength, we change both the strength of the critical layer contribution and the wave properties at the interfaces. Although the critical layer contribution is now stronger, the phase shift between the vorticity contributions of the outer waves is also approaching an antiphase configuration, so both effects contribute to the reduction in growth rate. It is also interesting to recall that, when the two outer vorticity contributions are in antiphase, this implies that the corresponding displacement is in phase (e.g. Heifetz et al.
Reference Heifetz, Bishop, Hoskins and Methven2004a
), as seen in the
 ${\it\eta}$
eigenfunction. In other words, the whole region is undulating as one; this is physically consistent in that, as we increase the field strength, the magnetic field imparts more ‘stiffness’ to the fluid, and the fluid is forced to undulate as a whole.
As a final point, figure 6(b) is generic for eigenfunctions near marginal stability in the sense that, as
 $c_{i}$
goes to zero, the tilted structures become thinner and the configuration goes to one where there is no longer constructive interference due to the vorticity associated with the counter-propagating modes being in phase or in antiphase. We have shown here the case where vorticity becomes increasingly out of phase, but of course they may also become increasingly in phase, depending on where we are on the stability boundary. There is an intermediate region where the stabilisation is solely due to the strengthening of the centre contribution, but this is a somewhat special case and, generically, both the changes to phase shift and strengthening of the critical layer contribute to the neutralisation of the instability.
4.3. Interfacial wave dynamics
From figure 6(a), we observe that the contribution in the centre can be small, so we may suppose that taking solutions of the form
 $$\begin{eqnarray}q=\hat{q}_{1}{\it\delta}(y-1)+\hat{q}_{2}{\it\delta}(y+1),\quad j=\hat{\jmath }_{1}{\it\delta}(y-1)+\hat{\jmath }_{2}{\it\delta}(y+1)\end{eqnarray}$$
has the potential to be a reasonable approximation to the full solution, at least away from marginality. Since this neglects the standing wave contribution that counteracts the two counter-propagating waves, we expect the resulting solutions to have, compared to the solutions presented in figure 5, larger growth rates and a larger region of instability.
We start from the (
 $q,{\it\eta}$
) formulation with (2.5a
) and (2.6). From the inversion relation (2.9), we have, in non-dimensional form,
 $$\begin{eqnarray}A_{1,2}=-\frac{1}{2k}(\,\hat{\jmath }_{1,2}+\hat{\jmath }_{2,1}\text{e}^{-2k}),\quad {\it\psi}_{1,2}=-\frac{1}{2k}(\hat{q}_{1,2}+\hat{q}_{2,1}\text{e}^{-2k}).\end{eqnarray}$$
Our vorticity equation (2.5a
) will have
 $\hat{\jmath }$
involved so we also need expressions for
 $\hat{\jmath }_{1,2}$
. Using
 $A=\overline{B}{\it\eta}$
from (2.7), we obtain from (4.11)
 $$\begin{eqnarray}\hat{\jmath }_{1,2}=-\frac{2k}{1-\text{e}^{-4k}}({\it\eta}_{1,2}-{\it\eta}_{2,1}\text{e}^{-2k}).\end{eqnarray}$$
Substituting accordingly, the governing equations (2.5a ) and (2.6) become
 $$\begin{eqnarray}\displaystyle & \displaystyle \left(\frac{\partial }{\partial t}\pm \text{i}k\right)\hat{q}_{1,2}=\pm \frac{\text{i}}{2}(\hat{q}_{1,2}+\hat{q}_{2,1}\text{e}^{-2k})-\frac{2kM^{2}}{1-\text{e}^{-4k}}({\it\eta}_{1,2}-{\it\eta}_{2,1}\text{e}^{-2k}), & \displaystyle\end{eqnarray}$$
 $$\begin{eqnarray}\displaystyle & \displaystyle \left(\frac{\partial }{\partial t}\pm \text{i}k\right){\it\eta}_{1,2}=-\frac{\text{i}}{2}(\hat{q}_{1,2}+\hat{q}_{2,1}\text{e}^{-2k}). & \displaystyle\end{eqnarray}$$
 $(1-\text{e}^{-4k})^{-1}$
multiplying some of the
 ${\it\eta}$
terms. This is unlike the stratified case considered in Rabinovich et al. (Reference Rabinovich, Umurhan, Harnik, Lott and Heifetz2011). Although the displacement is related to the perturbation magnetic potential and buoyancy for the respective cases, in the MHD case the current also appears in the vorticity equation; there is no analogue of this in the stratified case.
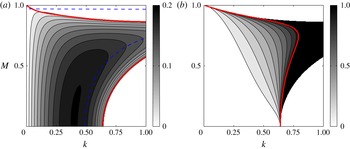
Results from taking only two interfaces, for the profile given in (4.5): (a) shows the growth rates
 $(kc_{i})_{\mathit{int}}$
of the approximated solution from (4.14); (b) shows the weighted error
 $E=1-(kc_{i})_{\mathit{full}}/(kc_{i})_{\mathit{int}}$
. The thick (red online) line here is the stability boundary of the full solution in figure 5, while the resonance condition from (4.7) is shown as the dashed (blue online) curve.

Considering modal solutions, the system (4.13) has closed-form solutions given by
 $$\begin{eqnarray}c=\pm \sqrt{1-\frac{1}{2k}+\frac{1-\text{e}^{-4k}}{8k^{2}}+M^{2}\pm \sqrt{\frac{1}{4k^{2}}\left(1-\frac{1-\text{e}^{-4k}}{4k}\right)^{2}+2M^{2}{\it\xi}}},\end{eqnarray}$$
where
 $$\begin{eqnarray}{\it\xi}=1-\frac{1}{k}+\frac{1-\text{e}^{-4k}}{8k^{2}}+\frac{1+\text{e}^{-4k}}{1-\text{e}^{-4k}}.\end{eqnarray}$$
When
 $M=0$
, (4.14) reduces to the hydrodynamic solutions
 $c=\pm \sqrt{(1-2k)^{2}-\text{e}^{-4k}}/2k$
(e.g. Drazin & Reid Reference Drazin and Reid1981). For
 $k\ll 1$
, a straightforward asymptotic analysis of (4.14) yields
 $c=\text{i}\sqrt{1-M^{2}}$
, which is the vortex sheet result in incompressible MHD (e.g. Chandrasekhar Reference Chandrasekhar1981).
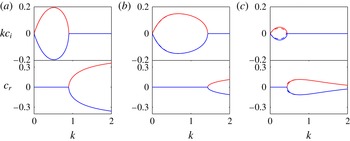
Figure 8(a) shows the growth rates
 $(kc_{i})_{\mathit{int}}$
of the unstable branch of (4.14). Like the full solution, the unstable modes here have
 $c_{r}=0$
. In figure 8(b) we show contours of the weighted error
 $E=1-(kc_{i})_{\mathit{full}}/(kc_{i})_{\mathit{int}}$
; when
 $E=0$
, the approximated solution (4.14) agrees completely with the full solution, whilst
 $E=1$
shows that the approximated solution predicts instability when it is otherwise absent in the full solution. In agreement with the hypotheses, we over-estimate growth rates as well as regions of instability, with the over-estimation being most significant in the short-wave regime and near the stability boundary. In this instance, the resonance condition from (4.7) shows better qualitative agreement with the location of optimal growth, which is to be expected since we have artificially removed the contributions away from the interfaces.
Previous authors analysing the stratified problem (Harnik et al. Reference Harnik, Heifetz, Umurhan and Lott2008; Rabinovich et al. Reference Rabinovich, Umurhan, Harnik, Lott and Heifetz2011) have observed that, since there are two wave branches, the modal solutions will have a pro- and counter-propagating component. The existence of the two components is due to the fact that there is an intermediate step linking displacement with vorticity. In our schematic presented above in figure 7, the instability results from the interaction of counter-propagating modes, so it is informative to investigate the role of the pro-propagating mode. A similar analysis to Rabinovich et al. (Reference Rabinovich, Umurhan, Harnik, Lott and Heifetz2011) may be carried out here, by taking into account the asymmetric non-dimensional eigenstructure given by
 $$\begin{eqnarray}\hat{q}_{1}^{\pm }=2kc_{\mathit{ra}}^{\pm }{\it\eta}_{1}^{\pm },\quad \hat{q}_{2}^{\pm }=-2kc_{\mathit{ra}}^{\mp }{\it\eta}_{2}^{\pm },\quad c_{\mathit{ra}}^{\pm }=-\frac{1}{4k}\pm \sqrt{\left(\frac{1}{4k}\right)^{2}+M^{2}}.\end{eqnarray}$$
We may transform the system of equations (4.13) into a system of equations in terms of (
 ${\it\eta}_{1}^{\pm },{\it\eta}_{2}^{\pm }$
) via a direct substitution, a self-similarity transform (e.g. Harnik et al.
Reference Harnik, Heifetz, Umurhan and Lott2008), or otherwise. We come to essentially the same conclusions as Rabinovich et al. (Reference Rabinovich, Umurhan, Harnik, Lott and Heifetz2011), where, when there is an instability, the pro-propagating mode should satisfy the relation
 $({\it\eta}_{1}^{+},{\it\eta}_{2}^{-})=-{\it\chi}({\it\eta}_{2}^{+},{\it\eta}_{1}^{-})$
, where
 ${\it\chi}\in [0,1]$
, i.e. the pro-propagating mode on one flank is smaller by a factor of
 ${\it\chi}$
and in antiphase with the counter-propagating mode on the other flank. The existence of the pro-propagating mode provides extra hindrance to the counter-propagating modes, with its effect being most significant in the
 $k\ll 1$
regime. One could consider taking the
 ${\it\chi}=0$
approximation that artificially removes the pro-propagating mode; the resulting analytical solution is
 $$\begin{eqnarray}c=\pm \sqrt{\left(1+c_{\mathit{ra }}^{-}+\frac{M^{2}\text{e}^{-4k}}{(1-\text{e}^{-4k})(c_{\mathit{ra}}^{+}-c_{\mathit{ra}}^{-})}\right)^{2}-\left(c_{\mathit{ra}}^{-}-\frac{2kM^{2}}{1-\text{e}^{-4k}}\right)^{2}\left(\frac{\text{e}^{-2k}}{c_{\mathit{ra}}^{+}-c_{\mathit{ra}}^{-}}\right)^{2}}.\end{eqnarray}$$
We show in figure 9 several line plots of the analytical solution (4.14) and the
 ${\it\chi}=0$
solution (4.17). The differences between the solutions in this case are so slight that they are only distinguishable at high values of
 $M$
. This points to the scenario that, although the pro-propagating mode must exist as part of the physics, its effect on the instability for this profile is almost negligible compared to the counter-propagating mode. One may obtain the numerical values of
 ${\it\chi}$
by computing the eigenfunctions (which are just complex numbers in this case), and taking
 ${\it\chi}=|{\it\eta}_{1}^{+}|/|{\it\eta}_{2}^{+}|=|{\it\eta}_{2}^{-}|/|{\it\eta}_{1}^{-}|$
; although not shown here, we have
 ${\it\chi}\lesssim 0.1$
over most of the region where there is instability.
Line plots of the growth rate
 $kc_{i}$
(upper row) and the phase speed
 $c_{r}$
(lower row) associated with the growing and decaying solutions of the full solution (4.14), denoted by solid lines, and the
 ${\it\chi}=0$
solutions (4.17), denoted by dashed lines. These are evaluated at fixed
 $M$
, with (a)
 $M=0.5$
, (b)
 $M=0.75$
and (c)
 $M=0.9$
. The
 ${\it\chi}=0$
solution is, for the most part, indistinguishable from the analytical solution.

5. Stable profile destabilised by a spatially varying magnetic field
We now carry out a similar investigation for the case where a stable flow is destabilised by a spatially varying magnetic field. We consider the dimensional basic state
 $$\begin{eqnarray}\overline{U}(y)={\it\Lambda}y,\quad \overline{B}(y)=\left\{\begin{array}{@{}ll@{}}+{\it\Gamma}y,\quad & y>L,\\ +{\it\Gamma}L,\quad & |y|<L,\\ -{\it\Gamma}y,\quad & y<-L,\end{array}\right.\end{eqnarray}$$
and
 $\partial \overline{Q}/\partial y=0$
here. Scaling by
 $$\begin{eqnarray}\tilde{B}={\it\Gamma}L,\quad \tilde{T}=\frac{1}{{\it\Lambda}},\quad \tilde{L}=L,\quad \tilde{U} ={\it\Lambda}L,\end{eqnarray}$$
the non-dimensional parameter is again
 $M=\tilde{B}/\tilde{U}$
, and
 $(\overline{B},\overline{J},j)\rightarrow M(\overline{B},\overline{J},j)$
after rescaling. This piecewise-linear magnetic field profile (resembling a wake) is chosen so that it satisfies
 $\overline{B}{\rm\Delta}\overline{J}<0$
. This profile choice is inspired partly by the parabolic magnetic field profiles
 $\overline{B}\sim y^{2}$
considered by Chen & Morrison (Reference Chen and Morrison1991) and Tatsuno & Dorland (Reference Tatsuno and Dorland2006) and the single interface profile considered by Stern (Reference Stern1963). One notable difference however is that this profile has a well-defined region of maximum
 $|\partial \overline{J}/\partial y|$
, whilst the profiles considered previously generally have
 $\partial \overline{J}/\partial y=\text{const.}$
throughout the domain, so this profile is not intended to be directly comparable to those previous studies. This case also has some similarities to the problem where there is a linear shear with two density jumps (the Taylor–Caulfield type instability), considered previously by, for example, Rabinovich et al. (Reference Rabinovich, Umurhan, Harnik, Lott and Heifetz2011); we have here instead two jumps in the current profile. Again,
 $M=1$
is the cutoff for linear normal mode instability.
Figure 10 shows contours of
 $(kc_{i})_{\mathit{full}}$
for this instability problem, and, again,
 $c_{r}=0$
for the unstable modes because of the symmetries possessed by the basic state. The shape of the instability region in parameter space may again be appropriately justified. At small
 $M$
, waves are too slow to overcome the background advection except at
 $k\ll 1$
. As
 $M$
increases, waves become sufficiently fast, overcome the background advection and achieve phase locking. For large enough
 $M$
, all waves are too fast to phase-lock. The resonance condition in this case are the locations where
 $$\begin{eqnarray}c_{1}^{-}(M,k)=1-c_{\mathit{A}}(M,k),\quad c_{2}^{+}(M,k)=-1+c_{\mathit{A}}(M,k),\quad c_{\mathit{A}}=M\sqrt{1+\frac{1}{2k}}\end{eqnarray}$$
are equal to each other. The conclusion is similar to the previous problem shown in figure 5, where we expect dynamics away from the interfaces to be significant.
Growth rates
 $(kc_{i})_{\mathit{full}}$
of the full numerical solution associated with the basic state (5.1). Here,
 $c_{r}=0$
for all unstable modes. The (red online) cross and circle correspond to the parameter location associated with the eigenfunction displayed in figure 11(a,b) respectively. The thick (red online) line is the stability boundary, and the dashed (blue online) curve is the resonance condition given in (5.3); numerical noise is present at small
 $k$
partly due to the form of the phase speed
 $c_{\mathit{A}}$
.

In figure 11 we show two eigenfunctions, one that is representative of a growing mode away from the stability boundary, and one for a case close to marginality; again, the parameter locations are given respectively by the (red online) cross and circle in figure 10. For both cases, we notice that the same contour levels are used for all three sections, unlike the previous instability problem displayed in figure 6. This immediately reinforces the suggestion that considering interfacial wave solutions only at
 $y=\pm 1$
as in (4.10) is going to be an overly drastic approximation, since we will be neglecting contributions that are comparable in size to those at the interface.
Representative eigenfunctions (normalised by the maximum absolute value of the vorticity) of the profile given in (5.1), both for
 $k=0.25$
, but with (a)
 $M=0.8$
and (b)
 $M=0.98$
. The shading (red and blue online) is for positive and negative vorticity (respectively), and the displacement is plotted as labelled contours. In (b), the
 $y$
scale is continuous between the panels (note the displacement contours are continuous in magnitude) but is not linear for display purposes.

Like the previous case, we have significant structures appearing at
 $y=\pm M$
, the locations where we have forced stationary Alfvén waves with
 $c_{\mathit{a}}=\pm M$
(note that this is not
 $c_{\mathit{A}}$
given in (5.3)). What is different in this case is that the schematic presented in figure 7 applies for the inner tilted structures, and so it is Alfvén waves at
 $y=\pm M$
rather than the waves supported by the interfaces that drive the instability. There are several extra interactions between the structures (affecting wave propagation and interaction) that lead to the overall instability eigenfunction in figure 11. Comparing between figure 11(a,b), we observe again that it is a mix of changes to the overall phase shift between the structures that lead to the neutralisation of the instability. Notice also that, since we are approaching marginality by increasing
 $M$
in figure 11(b), the displacement contours become increasingly in phase, as in the previous example in figure 6(b).
We should stress here that the instability in figure 11 really does require the presence of two current jumps to operate, while the
 $\overline{B}(\partial j/\partial x)$
term acts to modify the resulting interaction. To support this claim, we have carried out calculations for which we only have one jump. In this setting there is no instability, since the contributions on the other interface, its adjacent tilted structure and the standing wave in the centre are absent. The resulting vorticity eigenfunction has the interface and adjacent tilted structure in antiphase, and there is no constructive interference there. Removing both the jumps (i.e. linear shear flow with a uniform background magnetic field) also does not result in instability. For the profile (5.1) we consider here, the strength of the current gradient and background magnetic field are simultaneously controlled by
 $M$
. We considered a modified problem where the two parameters may be varied independently; we also arrive at similar conclusions to the one presented here.
We may take a similar approach to the work detailed in § 4.3, by neglecting contributions away from the interfaces, which results in analytical solutions that may be analysed accordingly. However, we do not expect this to provide an accurate approximation for this particular choice of basic state, since we are neglecting contributions that are of the same order of magnitude as the ones at the interface. A comparison of the full numerical solutions with the resulting analytical solution shows that the analytical solution grossly over-estimates growth rates and the region of instability. In light of the poor comparison of the analytical result with the correct full numerical solution, we omit here the results that are counterparts to those presented in § 4.3.
6. Conclusion and discussion
We have extended the interacting vorticity wave formalism to the MHD setting to provide a physical interpretation of the instability mechanism for MHD shear instabilities. In this framework, the existence of instability depends on whether the choice of basic state allows vorticity waves to resonate; whether the field stabilises or destabilises is dependent on how the resulting configuration affects wave properties. We have demonstrated that vorticity generation occurs at the locations where the background magnetic field and the background shear are both non-zero so, unlike certain hydrodynamic cases, critical layers must play a role in the dynamics even for piecewise-linear basic states.
To demonstrate the modifications to the underlying instability mechanism by MHD effects, and to compare with previous results and to evaluate the limitations of the interfacial wave assumption, we considered the instability characteristics of two piecewise-linear basic states, one where the field stabilises the unstable flow, and the other where the field destabilises the stable flow. The first example considered is the Rayleigh profile. The growth rate contours of the full solution agree with the previous results of Ray & Ershkovich (Reference Ray and Ershkovich1983); our contribution here is to rationalise the shape of the instability region via the properties of the phase speeds of the wave propagation. The resonance condition and its lack of agreement with the locations of optimal growth suggests that dynamics away from the interfaces are important; this is confirmed by plots of the eigenfunctions, which shows that we effectively have a standing wave structure at
 $\overline{U}(y)-c=0$
in between two counter-propagating modes, schematically represented by figure 7. Additionally, we are able to predict the phase relations of this standing wave contribution from the equations. As we approach marginality, one interesting feature is that we have additional structures appearing at the levels where
 $\overline{U}(y)-c=\pm M\overline{B}(y)$
; these are critical levels that correspond to locations where we have forced stationary Alfvén waves. Changing the field strength affects both the strength of the critical layer and phase shifts of the waves. Although there will be special cases where marginality is achieved when the critical layer contribution overwhelms the other contributions, generically speaking, it is a combination of the two effects that leads to neutralisation of the instability. In this example, we argued that the dynamics of two interfacial waves can serve as a reasonable approximation to the full problem. We predicted and found that such an approximation over-estimates the growth rate and the region of instability. Appropriate analyses in the manner of Rabinovich et al. (Reference Rabinovich, Umurhan, Harnik, Lott and Heifetz2011) were performed to explore the instability characteristics under the interfacial wave assumption.
The second example we considered is a linear shear flow destabilised by a spatially varying background magnetic field. The magnetic field profile was inspired by the parabolic profile
 $\overline{B}(y)\sim y^{2}$
considered by both Chen & Morrison (Reference Chen and Morrison1991) and Tatsuno & Dorland (Reference Tatsuno and Dorland2006), although we stress that the results are not entirely comparable since
 $\partial \overline{J}/\partial y$
is constant throughout the domain for the parabolic profiles. With regards to the eigenfunction, a robust feature is that, like the previous example, tilted structures with significant contributions of vorticity exist at the critical levels. The schematic in figure 7, however, applies instead to the forced stationary Alfvén waves located at
 $\overline{U}(y)-c=\pm M\overline{B}(y)$
counteracted by the standing wave contribution associated with the critical level
 $\overline{U}(y)-c=0$
. The principal interactions driving the instability are from these stationary Alfvén waves away from the interfaces, rather than from interfacial waves.
Part of the reason for employing piecewise-linear profiles is to obtain a simplified problem for understanding the dynamics leading to instability, as well as for comparison with previous works on a similar topic. One important point we highlighted is that one needs to be careful when making the interfacial wave assumption, since vorticity generation is generally not localised in the MHD case. The non-local generation of vorticity occurs more generally when considering the instability problem for smooth basic states (arguably more realistic for modelling purposes), and the resulting eigenstructure generically has a spatial dependence on the cross-stream coordinate. Although waves are then not as well defined, one may wonder whether the same mechanistic interpretation summarised by figure 7 here is schematically correct. One study that supports this was reported in the PhD thesis of one of the authors (Mak Reference Mak2013). For calculations of the profile
 $\overline{U}(y)=\tanh (y)$
and a uniform background magnetic field, plots of the eigenfunction showing structures similar to figure 6(a) here were found. We expect analogous structures to appear in eigenfunctions from calculations with other smooth basic states, demonstrating that shear instabilities may be interpreted as the mutual interaction of vorticity regions. One other possible scenario for smooth profiles is that the overall eigenfunction could look schematically like figure 4(b), occurring for example when the basic state gradients are weak/non-existent, although this has not been found for the examples considered here.
Beyond incompressible MHD, this wave interaction framework, together with previous work on the stratified case (Harnik et al. Reference Harnik, Heifetz, Umurhan and Lott2008; Carpenter et al. Reference Carpenter, Balmforth and Lawrence2010, Reference Carpenter, Tedford, Heifetz and Lawrence2013; Rabinovich et al. Reference Rabinovich, Umurhan, Harnik, Lott and Heifetz2011; Guha & Lawrence Reference Guha and Lawrence2013) may perhaps explain the observations made in the previous work of Lecoanet et al. (Reference Lecoanet, Zweibel, Townsend and Huang2010), where they consider the shear instability problem in a stratified fluid, with a background magnetic field. The field in that case can stabilise or destabilise. We suspect that this is most likely to be due to whether the vorticity wave modes supported by the choice of the basic state can interact accordingly, leading to instability. We suspect that this is why the Richardson number or Miles–Howard criterion (e.g. Miles Reference Miles1961) is not necessarily applicable to stratified MHD shear flows.
Although we have focused on modal instabilities here, the formulation is kept in the
 $\partial \boldsymbol{{\it\eta}}/\partial t=\unicode[STIX]{x1D63C}\boldsymbol{{\it\eta}}$
form (where
 $\boldsymbol{{\it\eta}}$
denotes the state vector and
 $\unicode[STIX]{x1D63C}$
denotes the appropriate operator) so that it may also be used to investigate non-normal mode instabilities and transient growth (e.g. Constantinou & Ioannou Reference Constantinou and Ioannou2011; Guha & Lawrence Reference Guha and Lawrence2013). Further, our profiles were chosen so that, when
 $M\geqslant 1$
,
 $|B|\geqslant |U|$
pointwise everywhere, and a stability theorem forbids normal mode instabilities. Profiles violating this condition locally do suffer instabilities, and, in particular, have been found for studies in both two-dimensional, spherical, incompressible and shallow-water MHD (see the recent review by Gilman & Cally (Reference Gilman, Cally, Hughes, Rosner and Weiss2007)). Although this particular scenario is not one we have addressed here, a extension of our interpretation to spherical MHD appears possible (a hydrodynamic extension in spherical coordinates was given by Methven et al. (Reference Methven, Heifetz, Hoskins and Bishop2005)). These instabilities may be explained by energetic arguments, and an extension of our mechanistic interpretation will serve to complement the existing explanation. Further, shallow-water MHD simulations on a rotating spherical planet show the emergence of stable compact monopolar vortex structures of nested patches of opposite-signed vorticity whose stability is maintained by a strong vertical current (Cho Reference Cho2008). This is noteworthy since the same monopolar vortex structure in the absence of the aforementioned confining magnetic effects are otherwise unstable (e.g. van Heijst & Clercx Reference van Heijst and Clercx2009). It is conjectured here that the instability characteristics of such structures may also be attributed to interacting vorticity waves. A formulation of the problem in spherical MHD allows for a more appropriate comparison to the existing results, and this is currently under investigation by the authors.
Acknowledgements
This work was initiated whilst J.M. and E.H. were visiting MISU, with E.H. supported by the Rossby visiting fellowship of the International Meteorological Institute of Sweden. E.H. is grateful to M. Mond for fruitful discussion and to his teacher Alexander Ershkovich for his insight and wisdom. J.M. thanks T. Wood, A. Gilbert, D. Hughes and S. Griffiths for comments and pointing out some references. O.M.U. thanks J. Cho, P. Read and P. Dellar for enlightening conversations on the matter of magnetic vortex generation. Constructive comments from the three anonymous referees are gratefully acknowledged. The order of authorship is alphabetical.
Appendix A. Some formal analogies with the stratified problem
Using (2.7) to rewrite (2.5a ), the linearised vorticity equation in MHD is given by
 $$\begin{eqnarray}\left(\frac{\partial }{\partial t}+\overline{U}\frac{\partial }{\partial x}\right)q=-\frac{\partial \overline{Q}}{\partial y}\frac{\partial {\it\psi}}{\partial x}+\overline{B}\frac{\partial j}{\partial x}+\left(\overline{B}\frac{\partial \overline{J}}{\partial y}\right)\frac{\partial {\it\eta}}{\partial x},\end{eqnarray}$$
coupled accordingly by the kinematic condition;
 ${\it\eta}$
and
 ${\it\psi}$
here are, respectively, the horizontal displacement and streamfunction in the
 $(x,y)$
plane. For the analogous problem in the Boussinesq system, using the fact that
 $(\partial /\partial t+\overline{U}\partial /\partial x)b=-wN^{2}(z)$
and
 $(\partial /\partial t+\overline{U}\partial /\partial x){\it\zeta}=w$
, integrating yields the relation that
 $b=-{\it\eta}N^{2}(z)$
, where
 $N^{2}(z)$
is the background buoyancy frequency. The resulting vorticity equation reads
 $$\begin{eqnarray}\left(\frac{\partial }{\partial t}+\overline{U}\frac{\partial }{\partial x}\right)q=-\frac{\partial \overline{Q}}{\partial z}\frac{\partial {\it\phi}}{\partial x}-N^{2}\frac{\partial {\it\zeta}}{\partial x}.\end{eqnarray}$$
Here,
 ${\it\zeta}$
and
 ${\it\phi}$
are respectively the vertical displacement and streamfunction in the
 $(x,z)$
plane. Then the formal similarity is that
 $-\overline{B}(\partial \overline{J}/\partial y)\leftrightarrow N^{2}$
. The analogy is not entirely complete here because of the
 $\overline{B}(\partial j/\partial x)$
term. Further, one may use the identity
 $j={\rm\nabla}^{2}A={\rm\nabla}^{2}(\overline{B}{\it\eta})$
in (A 1) and observe that the final term disappears, and instead we have
 ${\rm\nabla}^{2}{\it\eta}$
terms (see also (4.1)). This does not invalidate the physical interpretation presented in § 3 since we are merely looking at different forms of the same terms describing the physics. Indeed, if there was no cancellation, then one may suppose there is some region where
 $|B(\partial j/\partial x)|\ll |(\partial A/\partial x)(\partial \overline{J}/\partial y)|$
, and then the analogy with the stratified problem holds, although the physics of the two systems are fundamentally different.
We note that, in the stratified problem, without assuming interfacial waves, the evolution equation for the perturbation energy is given by
 $$\begin{eqnarray}\frac{1}{2}\frac{\partial }{\partial t}\langle (u^{2}+w^{2})+N^{2}{\it\zeta}^{2}\rangle =-\left\langle uw\frac{\partial \overline{U}}{\partial z}\right\rangle ,\end{eqnarray}$$
where the angle bracket denotes a domain integral. So if
 $N^{2}<0$
, it is still possible for the perturbation kinetic energy to grow even in the absence of a background flow. In the MHD case, a similar manipulation leads first to
 $$\begin{eqnarray}\frac{\partial u}{\partial t}+\overline{U}\frac{\partial u}{\partial x}=-v\frac{\partial \overline{U}}{\partial y}-\frac{\partial }{\partial x}(\cdots ),\quad \frac{\partial v}{\partial t}+\overline{U}\frac{\partial v}{\partial x}=\overline{B}\left(\frac{\partial \overline{J}}{\partial y}{\it\eta}+j\right)-\frac{\partial }{\partial y}(\cdots ),\end{eqnarray}$$
where the terms
 $(\cdots )$
between the two equations are the same. Again, it is the appearance of the perturbation current that makes the analogy incomplete. If we however assume that
 $\partial \overline{J}/\partial y={\rm\Delta}\overline{J}{\it\delta}(y-L)$
and
 $j=\hat{\jmath }\text{e}^{\text{i}kx}{\it\delta}(y-L)$
, then it may be shown that, at
 $y=L$
,
 $$\begin{eqnarray}\frac{1}{2}\frac{\partial }{\partial t}\langle (u^{2}+v^{2})+\overline{B}(2k\overline{B}-{\rm\Delta}\overline{J}){\it\eta}^{2}\rangle =-\left\langle uv\frac{\partial \overline{U}}{\partial y}\right\rangle ,\end{eqnarray}$$
and, in the absence of a background flow, if
 $\overline{B}{\rm\Delta}\overline{J}>0$
, it is still possible for the perturbation kinetic energy to grow at the expense of magnetic energy, resulting in instability.
With regards to the non-dimensional units, we recall that, in the stratified case, the governing non-dimensional parameter is
 $\mathit{Ri}=N^{2}/(\partial \overline{U}/\partial z)^{2}$
. In MHD, the governing non-dimensional number is
 $$\begin{eqnarray}M^{2}=\frac{B_{0}^{2}}{U_{0}^{2}}\sim \frac{\overline{B}(L^{2}\overline{B})}{L^{2}\overline{U}^{2}}\sim \frac{-\overline{B}(\partial \overline{J}/\partial y)}{(\partial \overline{U}/\partial y)^{2}},\end{eqnarray}$$
and so
 $M^{2}$
has a formal analogy with
 $\mathit{Ri}$
. We should stress that this is only a formal analogy, since it does not take into account of the
 $\overline{B}(\partial j/\partial x)$
term, which results in wave modes that are fundamentally different from the gravity wave modes. We note that, in a similar vein, Stern (Reference Stern1963) defines what he calls the magnetic Richardson number as (translated into our notation)
 $\mathit{Ri}_{m}=(\partial \overline{B}/\partial y)^{2}/(\partial \overline{U}/\partial y)^{2}$
.
Appendix B. Formulation in terms of
 $q$
and
$j$
variables


One alternative approach is to use
 $q$
and
 $j$
as the fundamental variable over
 $q$
and
 ${\it\eta}$
when considering interface solutions. One immediate issue is that, from the current perturbation equation (2.10),
 $\overline{Q}$
and
 $\overline{J}$
are not well defined at the interface locations. A further approximation that one might make is that the terms with the coefficient
 $\overline{Q}$
and
 $\overline{J}$
are small compared to
 $\partial \overline{Q}/\partial y$
and
 $\partial \overline{J}/\partial y$
. This may be appropriate if we have reason to believe that interfacial waves are the most important aspect to the dynamics, perhaps when the basic state gradients are strong. With this assumption, we obtain the system of equations
 $$\begin{eqnarray}\displaystyle & \displaystyle \left(\frac{\partial }{\partial t}+\overline{U}\frac{\partial }{\partial x}\right)q=-\frac{\partial \overline{Q}}{\partial y}\frac{\partial {\it\psi}}{\partial x}+\overline{B}\frac{\partial j}{\partial x}+\frac{\partial \overline{J}}{\partial y}\frac{\partial A}{\partial x}, & \displaystyle\end{eqnarray}$$
 $$\begin{eqnarray}\displaystyle & \displaystyle \left(\frac{\partial }{\partial t}+\overline{U}\frac{\partial }{\partial x}\right)j=+\frac{\partial \overline{Q}}{\partial y}\frac{\partial A}{\partial x}+\overline{B}\frac{\partial q}{\partial x}-\frac{\partial \overline{J}}{\partial y}\frac{\partial {\it\psi}}{\partial x}. & \displaystyle\end{eqnarray}$$
 ${\it\phi}^{\pm }=({\it\psi}\pm A)/2$
and
 $\mathscr{Q}^{\pm }=(q\pm j)/2$
, then we have
 ${\rm\nabla}^{2}{\it\phi}^{\pm }=Q^{\pm }$
and that
 $$\begin{eqnarray}\left[\frac{\partial }{\partial t}+(\overline{U}\mp \overline{B})\frac{\partial }{\partial x}\right]\mathscr{Q}^{\pm }=-\left(\frac{\partial \overline{Q}}{\partial y}\pm \frac{\partial \overline{J}}{\partial y}\right)\frac{\partial {\it\phi}^{\mp }}{\partial x}.\end{eqnarray}$$
This has some formal similarities to employing Elsasser variables (e.g. Biskamp Reference Biskamp2003) in writing the MHD equations, although this is of course different since we have made an approximation by dropping certain terms in the
 $j$
equation.