1 Introduction
Since July 1994, the Argentine retirement system experienced a structural reform. By virtue of Law No. 24241 the Integrated Pension and Retirement System (Sistema Integrado de Jubilaciones y Pensiones, SIJP) came into force. It is comprised of two regimes: the old public regime, organized in the form of a pay-as-you-go system managed by the State, and a new regime based on individual capitalization and managed by private companies – the Pension and Retirement Fund Management Companies (Administradoras de Fondos de Jubilaciones y Pensiones, AFJPs).
The main purpose of the SIJP is to cover the contingencies of old age, disability, and death. Under this common goal, the purpose of the private capitalization system is to manage the contributions made by affiliates by investing them in a number of assets, in consideration of a compensation. AFJPs established a non-linear price until December 2001, consisting of a fixed price in pesos and a variable component proportional to the affiliate's taxable income. From that date, the charge of a fixed component was forbidden.
All persons over 18 years of age are under a duty to pay contributions to the system, whether they are employed or self-employed. Regulations require workers to choose either one of the two retirement systems available (the pay-as-you-go system or the capitalization system), automatically transferring those who fail to make a choice to the latter system. Those who have chosen to remain under the pay-as-you-go system still have the possibility of changing their minds and switching to the private individual capitalization system. However, those who opted for the individual capitalization system are barred from making a change, although they can still switch to another AFJP.
As of December 2006, about 82% of potential contributors had exercised their option right and switched to the private regime.
Initially, the introduction of a private pillar within the Argentine retirement system was intended to create a competitive market where AFJPs would strive for efficiency by competing through prices, thus maximizing consumers' surplus and outperforming the traditional pay-as-you-go system. Nevertheless, competitive balance is rarely achieved as a result of the actions taken by participating firms to differentiate their services and capture a loyal portion of the demand.
In this context, the purpose of this paper is to study the determinants of the market share of each AFJP by share of positive transfer of workers and the sources of product differentiation, in terms of the number of positive contributors they receive quarterly. In other words, the parameters of the demand function may be estimated by taking into consideration not only the price offered by the AFJPs for their services but also the characteristics of their vertical and/or horizontal product differentiation policy.
For this purpose, the following section presents a discussion of the theoretical framework and recent empirical literature. In the third section a discrete choice logit and nested logit model is developed, based on the random utility or stochastic theory, in order to derive the functional form of demand. Subsequently, the demand function is estimated, together with their corresponding direct and cross elasticities, on the basis of a panel of quarterly data for the period December 1995–June 2006. Finally, the main conclusions reached will be presented.
2 Theoretical framework
Traditionally, supply-and-demand studies have occupied a large part of empirical economics. Such analyses focused on covering cost and demand information, using aggregate data on the assumption of static and perfectly competitive balance conditions. However, attention has recently shifted to the estimation of the demand and cost function parameters on the assumption of non-perfectly competitive balance conditions.
One of the basic premises of the models reflecting consumer behavior is that individuals choose the available consumption basket that allows to maximize its utility level. In this sense, all decisions adopted by individuals show their preference for one basket over any other basket available.
Based on this premise, the revealed preference theory enables the study of consumers' preferences that are not directly observable on the basis of consumer demand information.
To that end, the concept of utility relates an index to the relative satisfaction level with respect to the consumption of a specific good, considering that the good produces no utility per se, but that utility rather derives from the services associated with such a good and that these services can be described by a given set of features, such as price, real or perceived quality, location, etc.
The level of utility derived by an individual from a particular choice is a combination of the good's features, weighted by their relative importance.
According to McFadden (Reference McFadden and Zarembka1974), the neoclassical theory draws on consumer rationality, so that each individual makes the choice which maximizes their utility. However, both the existence of imperfect perception and optimization, as well as the lack of information on the significantly relevant variables, restrict this approach.
In this sense, according to Hotellin (Reference Hotelling1929), Chamberlin (Reference Chamberlin1929–Reference Chamberlin1962) and Lancaster (Reference Lancaster1966), a good or service can be described as a set of features such as quality, location, time, availability, consumer information about existence and quality, etc. The introduction of all potential features provides a satisfactory description of the motive driving a consumer's choice.
Product differentiation can be conceived from two non-exclusive approaches: vertical and horizontal differentiation. The first one considers that consumers agree on the order of preference between different options, based on the existence of real or perceived quality differences.
Horizontal differentiation takes place where the choice is not associated with quality perceptions but with preferences based on consumers' likings, which vary across the population. A common example is location. Where quality is similar, consumers will prefer a product available near their place of residence (Hottelling, Reference Hotelling1929; Cremer and Thisse, Reference Cremer and Thisse1991; Böckem, Reference Böckem1994).
Markets with perfectly homogeneous products are rare. In this sense, empirical oligopoly models with product differentiation have been given a great deal of attention in connection with a number of applied microeconomics topics, including, but not limited to, market behavior (Bresnahan, Reference Bresnahan1989), the effects on welfare as a result of the introduction of new products (Trajtenberg, Reference Trajtenberg1989), and market deregulation (Morrison and Winston, 1986).
The simplest way to address a demand model in an industry with differentiated products and where prices are endogenous is to define a linear demand logarithm curve with information from the market, where the quantity demanded from company j responds negatively to its own price, and positively to competitors' prices. However, the large number of parameters to be estimated poses a major problem. For instance, let us consider a market with 100 differentiated products. In this case, and without any additional restrictions, this implies estimating 10,000 elasticities – 100 demand equations, one for each product, with 100 prices in each. In a study of automobile demand, Bresnahan (Reference Bresnahan1987) analyzed 100 different products, which involved the estimation of over 10,000 separate elasticities.
The use of discrete choice models based on the random utility theory shows individuals' behavior with regard to the choice of a good, thus reducing the number of parameters to be estimated and allowing for price endogeneity on a number of assumptions.
This kind of model is effective to obtain an adequate demand structure. Discrete choice models with differentiated products have a long history, and were initially influenced by McFadden (Reference McFadden and Zarembka1974). Under this specification, consumer utility is modeled as a function of both observable and non-observable product features; consumer characteristics, which are generally not observable by an econometrician; and the price of the good as determined within the model.
Discrete choice models consider that individuals must choose out of a set of predetermined options, and their choice is made by taking that action which maximizes their personal utility, subject to legal, social, environmental, and budget constraints, among others.
Given the existence of non-observable variables, such as consumers' likings, it is necessary to define a probabilistic distribution function.
There is recent literature about the determinants of market share and price from the field of empirical industrial organization. Berry (Reference Berry1994), Berry, Levinsohn, and Pakes (Reference Berry, Levinsohn and Pakes1995), and Nevo (Reference Nevo2000) analyze these alternative methods for the estimation of price equations and the demand function with discrete choice models in markets with product differentiation.
In this sense, Berry, Levinsonhn, and Pakes (Reference Berry, Levinsohn and Pakes1995) have studied the determinants of the market share of the companies which are part of the American automobile industry. Likewise, Nevo (Reference Nevo2000) replicates the same analysis to measure market share in the grain industry.
Following Berry (Reference Berry1994) and Nevo (Reference Nevo2000), this methodology can be useful to estimate the demand of a large number of products by using aggregate market information, thus allowing for prices endogeneity. The use of this kind of model has the benefits of the binary or discrete choice models and also allows for the achievement of more realistic elasticities (both with respect to price and features).
From the viewpoint of the Argentine AFJP market, Braberman, Chisari, and Quesada (Reference Braberman, Chisari and Quesada2000) estimated the demand function in order to find out its determinants. For that purpose, a linear function was established with respect to the number of positive transfers based on the number of salesmen, commercial costs as a proxy of advertising expenses, the difference between the total AFJP's commissions in dollars and the system's average, the difference between the AFJP's annual profitability and the system's average.
Results show that commissions and profitability are not significant variables when it comes to account for positive transfers. However, variables associated with a horizontal differentiation strategy (salesmen) and a vertical one (advertising expenses) do account for such transfers.
Similarly, based on a linear logarithm function, Ferro (Reference Ferro2003) estimated the percentage of positive transfers over the total number of AFJP's affiliates, based on commissions, profitability, branches, and salesmen. The results endorse the hypothesis of a horizontal product differentiation strategy, using the number of branches and salesmen as variables to account for demand; the variable associated with price, i.e. commissions, however, did not serve as an explanation.
Considering the different specifications made it is not possible to determine the cross elasticities of demand with respect to the different control variables of the AFJPs, such as price, branches, and salesmen. At the same time, these models allow no room for the dispersion of the characteristics of affiliates participating in the market, both in terms of their preferences and their level of income. Finally, such models fail to consider the existence of potential groups of firms, which implies perfect non-substitution between AFJPs and, therefore, potential sequential choice by affiliates: at first, they choose between groups of AFJPs, and then they choose the AFJP, which offers the highest utility in the preselected group.
In light of the foregoing, this section develops a discrete choice model in the context of the implementation of a logit and a nested logit model, in order to consider not only the characteristics of the service offered by AFJPs but also those of consumers, who cannot generally be observed by an econometrician, and thus obtain a matrix of direct and cross price elasticities together with other features.
Furthermore, taking into account the market segmentation strategy put in place by the AFJPs in terms of their affiliates' income level, the model will contemplate individuals' sequential choice.
3 The model
This work is based on the assumption of a market with M consumers (affiliated to the private capitalization system in the case under analysis), identified by subindex i, where i=1, …, M, and with N firms [AFJPs] that produce a single good or service (management of a retirement fund) identified by subindex j, where j=1, …, N. Consumer choice is of a binary nature: only one unit is consumed of all available options, or not consumed at all.
An individual utility function is assumed which includes the price of the good or service, the observable characteristics of the product, the observable characteristics associated with consumer preferences, and any other features not observable by an econometrician, both in connection with the product and with individual preferences.

where:
ςi represents all consumer characteristics not observable by an econometrician.
P j is the price of the good j
x j is a vector of the observable characteristics of the good j
ξj is a vector of the characteristics of the good j not observable by an econometrician
θ is the vector of parameters to be estimated.
The choices of consumers with different ςi will be different and the system's demand derivation requires the identification of a distribution function for ςi among the population. The distribution may be empirical or standardized (normal type) and its parameters are estimated. For the sake of simplicity, θ shall include any parameter which determines the distribution of consumer characteristics, as well as any other parameters describing utility as conditioned upon such characteristics.
Under a specification of random coefficients, the utility function of an individual i is expressed by the following equation

where the price of the AFJP is comprised of two components: a fixed price independent of the level of income, P fj, and a commission proportional to consumers' taxable income, P vj. In addition, εij is a term that cannot be observed and is specific to the consumer.
In line with (2), the mean utility level derived by consumer i as a result of the consumption of good j may be defined as follows


where μij is the estimation error, comprised of a residue independently and equally distributed; εij, which denotes the likings and characteristics particular to each individual and not observable by an econometrician.
Moreover, δj is the systematic part of the utility function, which is equal to the utility the individual i expects to get from the consumption of good j, where β=E(βi). Each consumer will chose only one good and the good chosen will be that which maximizes its relative utility with respect to the remaining options. In this sense, individual i will choose good j if and only if

that is

On the other hand, it is necessary to establish the existence of an additional option; such an option is called “Outside Good”. This option consists in the possibility of not choosing the goods or services offered and allocating all available resources to other goods, including the possibility of not spending them. In the particular case of the market under analysis, this option might be contemplated in situations where the affiliate does not choose to switch to another AFJP.
Given the existence of the outside good

Dataset A is the set of values of ς (consumer characteristics that cannot be observed by an econometrician) that leads to the choice of good j. In other words, given the set of unobservable characteristics of the individual, the probability that U ij⩾U ir is determined by

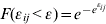
If εij is equally and independently distributed among all goods and consumers with an extreme value exponential distribution, its accumulated distribution function is
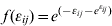
and its density probability function is as follows
Therefore, the demand for each product j is defined in accordance with the set of individual choices of such good. Consequently, the market share of company j shall be defined as s j.
Simple logit model
Assuming β is a non-random coefficient vector, and assuming u i0=εi0, the market share of company j is equal to the probability that individual i will choose good j, which is determined by

The market share of company j, as established in (8), is determined by the individuals' choice accumulated with respect to the whole population, and adopts this form because the choice is made out of the j available options, based on a competitive product features vector.
The model assumes a lack of correlation between the different options available. This is the property of independence from irrelevant options, and it can cause a model to yield biased estimations if some of the options are correlated to one another.
Similarly, the probability that an individual will choose the outside good is determined by
From (8) and (9), and taking a natural logarithm on both sides, the chance quotient obtained is in favor of option j with respect to the outside good

Additionally, the set of elasticities for both direct and cross demand may be derived from (8), not only with respect to the price but also to other product-specific characteristics, which are expressed as follows

The use of a simple logit structure is appropriate in the case of the Argentine AFJP market, considering the substitution patterns between options. However, Berry (Reference Berry1994) demonstrated that two products (automobiles in that particular case) with the same market share did not have the same substitution pattern as that of the rest of the market. The author sought to account for this finding by resorting to a distinction between luxury cars and small cars. These kinds of cars have the same share with respect to the total sales, but the demand for each is undoubtedly different, as is their pattern of substitution for other products.
Likewise, until December 2001, firms participating in the AFJP market could be divided into two groups: (i) a group of AFJPs that intended to meet the demands of moderate- and low-income sectors, and (ii) a group of firms that addressed the demand of high-income sectors. This was possible due to the existence of a non-linear price structure. For that reason, the substitution patterns among products are not the same, given the differences in the target demand of the AFJPs.Footnote 1
Nested-logit model
According to Apella (Reference Apella2006), the possibility of establishing a non-linear price until December 2001, with a fixed component in pesos and a variable component expressed as a proportion of the consumer's taxable income level, allowed the firms to segment the market by affiliates' income level. Thus, two groups of AFJPs were identified: the first group set a high fixed commission and a low variable commission intended to meet the demand of the high-income sectors, and the second group implemented the opposite price policy, targeting the demand of the low-income sector.Footnote 2
Under these circumstances, competition between AFJPs and, consequently, the degree of product substitution is reduced between consumer groups based on their income level.
This argument suggests that we should consider differences in the patterns of product substitution. If this is the case, an alternative to the logit model for the estimation of the market share is to use a nested-logit model. This model assumes that each product belongs to one of the g groups (two groups in this case), which are mutually exclusive within the market.
Thus, equation (2) may be redefined as follows

where ρig is common to all the products belonging to group g and fulfils a distribution function dependent on σ, so that 0⩽σ<1. σ is a correlation measure of the utility within the group: if σ is close to zero, there is no correlation within the group; if σ is close to one, the correlation and the degree of substitution within each group is high.
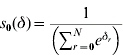
In this case, the market share of company j is determined by
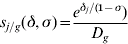
where 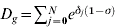 .
Similarly, the probability of choosing the product out of group g is the following
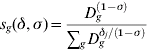
Considering that the probability of choosing product j is now defined as the chance of selecting group g and product j out of such group, equation (8) under a nested-logit model will be as follows

Further, the probability of choosing the outside good, as the only member of group zero based on δ0=0 and D0=1, is represented by the following expression
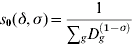
Therefore, the functional form to be estimated from (15) and (16) will be

Expression (16) depends on an unknown value of D g. Taking the natural logarithm of the group share in (14), ln (D g)=[ln (s g)−ln (s 0)]/(1−σ), where the value of the group share is identified as s g. By substituting this in (17) and combining terms provided by the analytical expression s j−1(s, σ), the following expression is derived

This expression is the same as equation (10) except for the additional term σln (s j/g). By substituting δj=x j⋅β−α(p fj+ p vj⋅y i)+ξj in (18) and clearing, the following equation is derived

where variable s j/g is the market share of each company within its group.
As with the simple logit model, the set of elasticities for both direct and cross demand can be derived from (15)
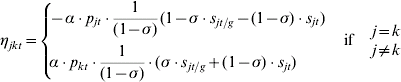
Unlike elasticities found on the basis of the simple logit model, the demand elasticity equation derived from the nested-logit model is weighted by the utility correlation offered by the products belonging to each group. In the extreme case where no groups can be identified within the market, and correlation is therefore equal to zero, equation (20) would be the same as (11).
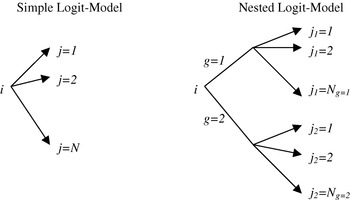
The difference between (10) and (18) can be found in the company selection process performed by consumers. In this sense, Figure 3.1 presents the steps followed in that selection for both types of models.
Consumer decision tree

While the use of a simple logit model implies that consumers choose between all options available in the market, the implementation of a nested-logit model considers that consumers make an initial choice between two groups of AFJPs, based on a defined characteristic, and that they then choose between the options available within such group.
4 Econometric results
Equations (10) and (19) were estimated on the basis of a panel of quarterly data for the period December 1995–March 2006; the dependent variable is the natural logarithm of the percentage of positive transfers received by each AFJP over the total positive transfers. The selection of such variables is grounded on the fact that positive transfers represent the affiliates' choice at each point in time, without any influence by the regulatory framework with regard to the distribution of undecided individuals. In this respect, the decision to switch of those affiliated to the capitalization system is not conditioned on the regulatory framework, and contemplates each AFJP's service characteristics.Footnote 3
The explanatory variables considered are the price set by the AFJPs, expressed in constant 1999 Argentinean pesos,Footnote 4 the real profitability of the funds as indicators of an real and perceived vertical product differentiation strategy, whereas the number of branches and salesmen are variables inherent in a horizontal product differentiation strategy.
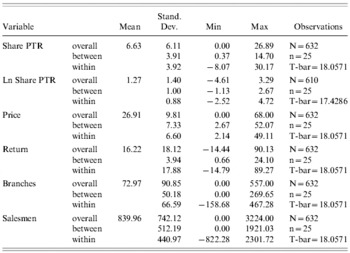
Table 4.1 presents the main characteristics of the pertinent variables. In this sense, the mean value is shown, together with the total standard deviation, both between firms and within firms, and the minimum and maximum values of the market share with respect to positive transfers, price, profitability, number of branches, and salesmen. The deviation “between” firms represents the dispersion between AFJPs, whereas deviation “within” firms shows the average dispersion of each AFJP through time.
Description of variables

Source: Prepared by the author on the basis of SAFJP data.
The total number of cases observed was 632; the value for the “between” firms effect is 25 for each of the AFJPs, and that for the “within” firms effect is an average of 18.05, with respect to the average of quarters during which an AFJP was surveyed.
For the overall period between December 1995 and June 2006, each AFJP received an average of 6.6% of the positive transfers, with a standard deviation of 6.1. The average price for the entire period under analysis is AR$26.9, with a deviation of AR$9.8. In terms of profitability, the retirement and pension funds yielded an average 16.2. However, the standard deviation between firms is 3.9. This results from return similarity between AFJPs throughout the entire period under analysis.Footnote 5
The average number of branches set up by the AFJPs equals 72.9. Furthermore, an overall large dispersion can be observed, which equals 90.23 branches; and this implies that branches vary from 0 to 557. Moreover, the number of branches per AFJP varies from 0 to 269.6. Finally, the average number of branches within AFJPs ranges from −158.6 to 467.2. Since that value refers to the deviation from the average experienced by each AFJP, the value can naturally be a negative figure. In this particular case, some AFJPs experienced a deviation from their average of 158.6−72.9=85.7 branches.
Similarly, the average number of salesmen employed by the firms is 839.9. A considerable overall dispersion of 742.1 salesmen can be observed, with a variation between zero and 3,224. Furthermore, the number of salesmen per AFJP varies from 0 to 1921. Finally, the variation within firms ranges from −822.2 to 2301.7.
As of December 2001, a regulatory change was implemented with respect to the prices set by the AFJPs, which consisted in the prohibition to set a fixed commission in pesos. This situation removed any direct attempts at market discrimination based on affiliates' income level. Given the new regulatory context with respect to the commission structure, it was likely that the AFJPs would readjust their target functions and set new prices as a result of the prohibition making this discrimination.
To account for the potential effects of this regulatory change on affiliates' decisions at the time of their transfer, a dummy variable was defined which uses a value of one for the quarters following December 2001. Subsequently, an additional variable was introduced derived from the product of the price by such a dummy variable. Thus, the functional form to be estimated is the following

The purpose of this price treatment scheme is to contrast any potential change in the significance of the price with respect to affiliates' choices after the enactment of the new regulations.
From (10′) the following conditional mathematical expectation is obtained

Thus accounting for the potential effect on the curve by means of (α1+α2). These results are compared with the mathematical expectation calculated before the described shock, so that

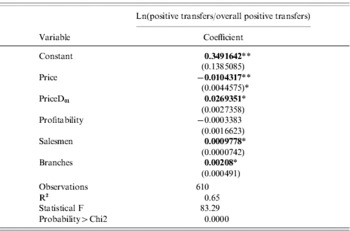
Table 4.2 shows the results obtained from the simple logit model estimation, by ordinary least squares with fixed effects.Footnote 6
Simple logit model – OLS fixed effects

Note: * significant at 1% reliability, ** at 5%, *** at 10%.
With a moderate regression adjustment, the results obtained are as expected, thus accounting for 65% of the total variance. The variable associated with a vertical product differentiation strategy (profitability of the funds) is not significant when it comes to explaining the probability that an AFJP will be chosen of those who wish to undertake a transfer. In addition, the number of branches and salesmen are significant at 1% reliability level and a positive figure, as expected. In fact, the relevance of a horizontal differentiation policy can be observed in the number and location of the AFJPs' main production factors.
Finally, the price is significant and negative. However, the estimated coefficient to capture the effect of a change in regulations turns out to be relevant, although with a positive sign. This contradiction is associated with the dynamics of positive transfers during the quarters following the regulatory change, which favored AFJPs with lower relative (although in absolute terms) percentage commissions in pesos, and given the high mean salary level of contributors, they keep a price that is higher than the system's average, expressed in monetary values.
In other words, the AFJPs that traditionally satisfied the demand of high-income sectors charged percentage commissions lower than those charged by their competitors at the time of the regulatory change. This situation caused a significant number of the transfers to be made in favor of such AFJPs with prices higher than the system's average when expressed in absolute terms, in spite of their charging a lower rate, due to the high income level of their affiliates.
Considering the differences identified by Apella (Reference Apella2006) between portions of demand, based on the selected price structure (a combination of fixed and variable commissions), an estimation can be made that embodies a mechanism whereby consumers make a two-stage choice. First, they choose a group of firms for their price strategy and, second, they identify the AFJP that offers the highest utility within the selected group. Therefore, the estimation was made under a nested logit model (equation (19)). To that effect, two groups of AFJPs were identified: the first group was comprised of Arauca Bit, Claridad, Generar, Met, traditionally designated to meet the demand of high-income sectors; the second group was comprised of the remaining AFJPs, designated to satisfy the demand of moderate- and low-income sectors.
The dependent variable is the natural logarithm of each AFJP's share in the overall number of positive transfers that took place during each quarter, keeping price, the actual quarterly profitability of the retirement and pension funds, the number of branches and salesmen as explanatory variables. Furthermore, an additional variable included was the natural logarithm of each AFJP's share in the number of transfers received during each quarter by the group to which the AFJP belongs, as a tool to identify the first contributor option, which in (19) is represented by σ.
However, the removal of fixed commissions from December 2001 ruled out any possibility that the AFJPs would regroup, in terms of the target demand to be met. In this sense, consumer choice from this period on may be expected to be made out of all AFJPs, and prices may become more relevant in making such choice. In other words, given that since 2001 the AFJPs are obliged to establish a single price structure (proportional to income level), they cannot segment the market so that competition occurs between all AFJPs.
In order to account for the potential effect of the regulatory change on the creation of AFJP groups, an additional variable was introduced in (19), which is the product of the natural logarithm of each AFJP's share in the positive transfers into their group and a dummy variable that adopts a value of one in all quarters after December 2001. In this sense, the functional form to be estimated is the following

From (19′) the following conditional mathematical expectation is derived

Thus identifying the potential effect on the curve after the shock by means of (σ1+σ2). These results are compared with the mathematical expectation calculated before the described shock, so that

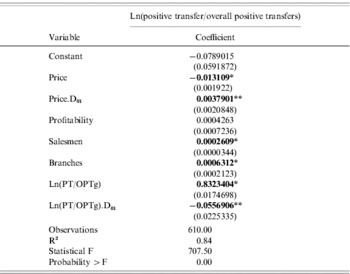
Table 4.3 shows the results obtained from the nested-logit model estimation. With a significant regression adjustment, the results obtained are as expected, thus accounting for 84% of the total variance. The variable associated with a vertical product differentiation strategy (profitability of the funds) is not significant when it comes to accounting for the probability that an AFJP will be chosen.
Nested-logit model – OLS fixed effects

Note:* significant at 1% reliability, ** at 5%, *** at 10%.
On the other hand, the number of branches and salesmen are significant at 1% reliability and a positive figure, as expected.
Finally, the  during the period before the December 2001 regulatory change equals 0.83, a value close to one, suggesting that the correlation and the degree of substitution within each group was extremely high during this period.Footnote 7 However, from that quarter, the estimator decreased to 0.78. This fact justifies the degree of uniformity reached among AFJPs as a result of the removal of fixed commissions, although this value still hints at the existence of two groups.
From this analysis, it may be suggested that AFJPs resorted to two different competitive tools: price signals and the number of branches and salesmen.
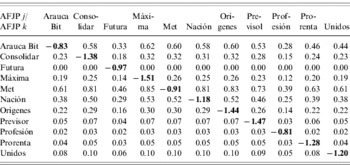
To reinforce these findings, direct and cross price elasticities have been estimated in order to gain deeper insight into consumers' reaction to price variations by 1%. In this regard, Table 4.4 shows the matrix of the price elasticities of demand.
Matrix of estimated price elasticities, June 2006

Source: Prepared by the author on the basis of SAFJP data and the results of Table 4.2.
The analysis of the matrix of the price elasticity of demand shows a lack of consistency in the value of this indicator among AFJPs. On the one hand, Profesión and Arauca Bit show the lowest direct price elasticity, which equals −0.81 and −0.83, respectively. This means that demand varies less than proportionally upon percentage price changes. Such inelasticity is associated with the fact that these AFJPs have targeted their entire commercial policy to specific consumer groups (professionals and high-income sectors, respectively), thus being able to differente from other AFJPs.
All other AFJPs show a direct price elasticity of demand of about one unit, which varies from −0.91 (Met) to −1.51 (Máxima). This means that, despite the horizontal product differentiation policy implemented by the AFJPs throughout the period under analysis, consumers consider price a key variable in their utility function.
Moreover, cross elasticity reveals the percentage variation in the demand of AFJP j upon the percentage variation in the price of AFJP k. In this respect, there are two sequential viewpoints to analyze these variations, i.e. between groups and within each group.
The analysis of the group of AFJPs that have historically met the demand of high-income sectors, Met and Arauca Bit, shows that the cross price elasticities between them are similar. In this sense, the percentage change in Met's demand upon the percentage variation in Arauca Bit's price is only of 0.61. This implies that in the event of an increase (decrease) in Arauca Bit's price by 1%, Met's demand increases (decreases) by 0.61%. Likewise, the cross price elasticity with respect to Arauca Bit's demand as a result of a percentage variation in Met's price is equal to 0.60.
The cross demand inelasticity with respect to the price within the group of AFJPs that traditionally met the demands of moderate- and low-income sectors is associated with the larger number of AFJPs within that group. In other words, percentage variations in the price of an AFJP j cause demand to deviate not only to the remaining nine firms within the group, but also towards AFJPs within the other block (Arauca Bit and Met).
In fact, an analysis of Met's and Arauca Bit's cross price elasticity as compared with the rest of the market shows that the demand of these AFJPs is the most elastic, averaging 0.67 and 0.50.
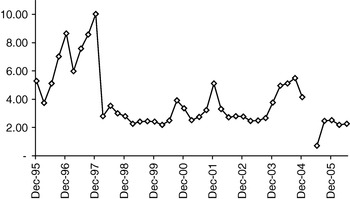
Notwithstanding these findings, it is worth noting that they correspond to the behavior of a small portion of demand, particularly that based on high salaries. In this sense, the estimation confronts the chance of selecting an AFJP (that is, the chance of a transfer) with the non-performance of such transfer. The highest average transfer volume for the entire period under analysis took place during the first four years of the system, with a significant decrease thereafter.
In order to provide a significant measure with respect to the volume of transfers over the size of the market, Figure 4.1 shows the transfer share over the number of total contributors.
Transfers/contributors
Source: Prepared by the author on the basis of SAFJP data.

Generally, the number of transfers equals 1.7 per cent of the overall market, with peaks in December 1997 (10%). Since this month, the positive transfers falls significantly as a result of a potential cooperative behavior between the AFJP. Furthermore, most of the employees who decided to switch to another AFJP belong to the high-income sector. According to SAFJP (2006), the salary gap between transfers-contributors has always been positive, with a clear expansion of the gap between 1998 and 2003; in 2003, the taxable income of transferred employees doubled that of contributors.
This is related to the greater volume of information available to this consumer group as well as to their efforts to make the best choice. For that reason, price is a significant variable in the utility function of employees who transfer. This is not the case, however, with respect to contributors who decide not to change their AFJP. At the time they enter the labor market, individuals either choose an AFJP based on the salesmen or the branch which is nearest their place of residence, or else remain undecided and are directed by the regulatory authority.
5 Conclusions
This work focuses on the study of the determinants of the AFJP's market share, in terms of price and variables associated with a vertical and/or horizontal product differentiation strategy.
Based on the theory of random utility and the development of a logit and nested-logit model, an AFJP demand function is obtained on the basis of two key hypotheses: (i) the consumer chooses a product, among all products available in the market, by taking into consideration that product which offers them the highest utility (simple logit), or (ii) the choice made by the individual is sequential, and thus a first choice is made between two large groups of companies, and a subsequent choice is made out of all the services included in the originally chosen group (nested-logit).
The AFJP market is subject to regulatory changes that affect its behavior. Until December 2001, AFJPs participating in the market could set a non-linear tariff, which comprised a fixed price in pesos and a variable price proportional to the affiliate's taxable income. As analyzed in this paper, that possibility enabled AFJPs to be classified into two groups and to segment the demand based on (moderate/low and high) income level, thus establishing a combination of fixed and variable prices that would attract different types of affiliates.
From December 2001, the fixed commission component was removed and in theory this ruled out the possibility of market segmentation based on income level. It can therefore be expected that the price signals sent by firms will become more relevant at the time of choosing an AFJP.
According to a panel of quarterly data for the period December 1995–June 2006, the demand function, considering the number of positive transfer received firms, was calculated on the basis of the hypotheses described above.
In accordance with the first hypothesis, the natural logarithm of each AFJP's share in the overall number of positive transfers in the quarter was estimated with respect to the price of retirement insurance (expressed in constant 1999 pesos). Estimations were also made of the price multiplied by a dummy variable associated with the regulatory change; and of the profitability of pension funds, as an indicator of a vertical product differentiation strategy. Furthermore, the number of branches and salesmen were included as variables, which are inherent in a horizontal product differentiation policy.
For this group of workers the results obtained showed evidence of the existence of two competitive mechanisms applied by the firms, and which affect the probability that they will be chosen by consumers: price signals and a horizontal product differentiation strategy, based on the number of branches and salesmen. However, the result of the change in the fixed commission system was as expected. In fact, the regulatory change favored AFJPs with lower relative percentage commissions, although in absolute terms (i.e. in $), and as a result of the average high salary level of their contributors, their price in pesos is higher than the system's average.
Based on the results obtained from the simple logit model estimation, which accounts for less than 70% of the total variance, the nested-logit model estimation was used to account for the effect on positive transfers of the existence of two groups in relation to their commission structure prior to December 2001.
Results endorse the hypothesis of a sequential choice, where an individual first selects a group of AFJPs and then chooses the firm that offers the highest utility within that group Furthermore, it is observed that price competition between all market firms decreases, while the number of branches and salesmen are significant to the consumer utility function. In addition, the establishment of two groups of AFJPs slightly weakened after the regulatory change of December 2001.
When the services offered by each AFJPs are differentiated, direct competition with the rest of the market decreases, allowing firms to act as oligopolistic firms within their own demand curve. Although this may prove optimal from the viewpoint of the AFJPs' benefit function, it is not so from a social perspective, because the lack of direct competition in the two variables relevant to the pension savings generation, that is prices and profitability, allows no room for the maximization of employees' pension saving funds.
Thus, a direct regulatory structure is required in connection with these variables so that there are proper incentives to maximize retirement and pension fund accumulation.