Introduction
The Antarctic ice sheet, the largest continental ice mass on Earth, contains a total of 27 million km3 of ice, a sea-level equivalent of ~58 m (Fretwell et al. Reference Fretwell, Pritchard, Vaughan, Bamber, Barrand and Bell2013). The largest portion of that ice lies in East Antarctica, where the East Antarctic Ice Sheet (EAIS) holds enough ice to raise sea level by 53 m (Fretwell et al. Reference Fretwell, Pritchard, Vaughan, Bamber, Barrand and Bell2013). Recent satellite altimetry data suggest significant mass loss from the Pacific sector of East Antarctica (Rignot et al. Reference Rignot, Mouginot, Scheuchl, van den Broeke, van Wessem and Morlighem2019), adding to concerns about sea-level rise related to ice-mass loss from the West Antarctic Ice Sheet (WAIS) (DeConto & Pollard Reference DeConto and Pollard2016). Assessing palaeo-ice-sheet dynamics and palaeoceanographic conditions is essential for providing a long-term perspective and context for predicting cryosphere responses to future changes in climate and oceanographic forcing. This study adds to the ongoing evaluation of the Holocene response of the integrated cryosphere–ocean–atmosphere system around the East Antarctic margin (EAM) (e.g. Masson et al. Reference Masson, Vimeaux, Jouzel, Morgan, Delmotte and Ciais2000, Leventer et al. Reference Leventer, Domack, Dunbar, Pike, Stickley and Maddison2006, Mackintosh et al. Reference Mackintosh, Verleyen, O’Brien, White, Selwyn Jones and McKay2014), with a focus on a remote and understudied region, Edward VIII Gulf, on the Kemp Coast, East Antarctica.
Factors contributing to ice-sheet stability include subglacial bed topography and oceanographic conditions (DeConto & Pollard Reference DeConto and Pollard2016). Regarding subglacial bed topography, the Kemp Coast provides a contrast to other areas of the EAM, such as Sabrina Coast and the Wilkes Land coast, where deep subglacial basins, the Aurora and Wilkes, respectively (Fig. 1), contribute to the potential for ice-sheet instability (Young et al. Reference Young, Wright, Roberts, Warner, Young and Greenbaum2011, Wright et al. Reference Wright, Young, Roberts, Schroeder, Bamber and Dowdeswell2012). Prydz Bay, directly east of the Kemp Coast, is associated with the Lambert Graben, which extends inland > 1000 km and reaches depths > 2500 m below sea level (Damm Reference Damm2007). In contrast, high bed elevations characterize Kemp Land and Enderby Land, inland of Edward VIII Gulf (Fretwell et al. Reference Fretwell, Pritchard, Vaughan, Bamber, Barrand and Bell2013). While the subglacial bed topography of the Kemp Coast remains poorly resolved, airborne radio-echo sounding data in Enderby Land and Queen Maud Land suggest protection from marine ice-sheet instability by prograde bed slopes and drainage basins mostly above sea level (Morlighem et al. Reference Morlighem, Rignot, Binder, Blankenship, Drews and Eagles2019).
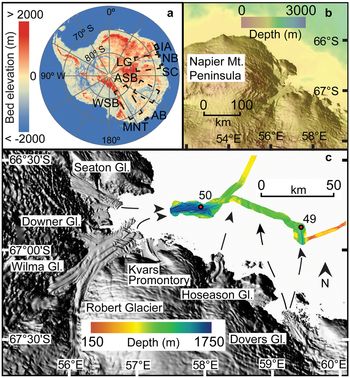
Core locations, glacier systems around Edward VIII Gulf, swath map and inferred directions of past ice-sheet advance. Reference elevation model of Antarctica from Howat et al. (Reference Howat, Porter, Smith, Noh and Morin2019). a. Bed elevation (from Fretwell et al. Reference Fretwell, Pritchard, Vaughan, Bamber, Barrand and Bell2013) and b. the shelf break (from Arndt et al. Reference Arndt, Schenke, Jakobsson, Nitsche, Buys and Goleby2013). The study area in c. is indicated by the solid black box in a. Locations referenced in paper include AB = Adélie Basin, ASB = Aurora subglacial basin, IA = Iceberg Alley, LG = Lambert Graben, MNT = Mertz–Ninnis Trough, NB = Nielsen Basin, SC = Svenner Channel, WSB = Wilkes subglacial basin.

Besides underlying topography, another factor influencing ice-sheet stability is circumpolar deep water (CDW). Circumpolar deep water is a relatively warm, high-nutrient, low-oxygen water mass with a poleward limit coinciding with the southern boundary of the Antarctic circumpolar current (ACC) (Orsi et al. Reference Orsi, Whitworth III and Nowlin1995). Circumpolar deep water heat is most effective at melting ice where it can directly contact the ice sheet where it is grounded below sea level, such as underneath ice shelves and along deeply submerged ice walls (Pritchard et al. Reference Pritchard, Ligtenberg, Fricker, Vaughan, van den Broeke and Padman2012). In West Antarctica, CDW intrudes onto the continental shelf via bathymetric troughs and drives ice-sheet melting, such as adjacent to the Pine Island Glacier (Jenkins et al. Reference Jenkins, Dutrieux, Jacobs, McPhail, Perrett, Webb and White2010) and Thwaites Glacier (Joughin et al. Reference Joughin, Smith and Medley2014). In East Antarctica, modified CDW (mCDW) has been observed on the Sabrina Coast continental shelf, the site of the Totten Glacier (Rintoul et al. Reference Rintoul, Silvano, Pena-Molino, van Wijk, Rosenberg, Greenbaum and Blankenship2016, Nitsche et al. Reference Nitsche, Porter, Williams, Cougnon, Fraser, Correia and Guerrero2017), in Prydz Bay (Williams et al., Reference Williams, Herriaz-Borreguero, Roquet, Tamura, Ohshima and Fukamachi2016) and the Mac. Robertson shelf (Harris Reference Harris2000). Incursion of CDW along the south-eastern coast of Lützow-Holm Bay during the Holocene is inferred by foraminifera found in sediment cores (Igarashi et al. Reference Igarashi, Numanami, Tsuchiya and Fukuchi2001). As is shown in other regions of East Antarctica, mCDW affects basal melt rates, contributing to ice-sheet instability (Rintoul et al. Reference Rintoul, Silvano, Pena-Molino, van Wijk, Rosenberg, Greenbaum and Blankenship2016). This study documents the presence of mCDW in Edward VIII Gulf, Kemp Coast.
Cruise NBP01-01 of the Research Vessel Icebreaker Nathaniel B. Palmer conducted an exploratory study of Edward VIII Gulf. This paper presents the preliminary hydrographical, geophysical and marine geological data collected. Hydrographical and geophysical records include water column profiles from two conductivity–temperature–depth (CTD) casts, a multi-beam swath map of Edward VIII Gulf and a 3.5 kHz sub-bottom survey that imaged the upper 50 m of the sediment sequence. Finally, micropalaeontological, sedimentological, rock-magnetic and geochemical data from two kasten cores from Edward VIII Gulf document the Holocene history of the region. Together, these datasets provide baseline information on a sector of the EAM where, despite the occurrence of mCDW on the shelf, the adjacent continental basement elevation and topography suggest relative stability of the ice sheet.
Study area
Edward VIII Gulf lies at 66°50’S, 57°00’E (Fig. 1). The gulf measures ~32 km in the east–west direction and 27 km in the north–south direction. The EAIS dominates the region’s physiography, although small, isolated, rocky islands and headlands are exposed along the coast. Rugged and deeply dissected mountain ranges are located inland of Edward VIII Gulf (Sheraton et al. Reference Sheraton, Tingey, Black, Offe and Ellis1987). From the Schwartz Range, the Robert, Wilma and Downer glaciers drain into the gulf and separate the Napier Mountains Peninsula to the north from the Kemp Coast to the east. Raised beaches between 3 and 6 m above sea level are found along the coast, indicating a marine transgression (Trail Reference Trail1970). The boundary between the Napier and Rayner complexes runs just west of Edward VIII Gulf, while longitudinal faults are observed along the gulf’s shore (fig. 1 in Toyoshima et al. Reference Toyoshima, Osanai and Nogi2008). Ice tongues from the Seaton, Downer, Wilma and Robert glaciers extend into the embayment, with some margins floating (Fig. 1). High bed elevations inland of the gulf are likely to foster stability. However, the depth of the grounding line is undetermined, so the exact nature of the ice margin, and thus its susceptibility to melting by mCDW, remains unknown. The southern boundary of ACC, and therefore the poleward limit of CDW, lies near the Kemp Coast at ~65°S (Orsi et al. Reference Orsi, Whitworth III and Nowlin1995).
Materials and methods
Conductivity–temperature–depth data
Oceanographic CTD data were obtained from two stations, NBP01-01 49 and 50 (Fig. 1), using the Sea-Bird model SBE 911+ CTD and Rosette system. All sensors (conductivity, temperature, oxygen) were calibrated by Sea-Bird Scientific prior to the cruise and sensor coefficients utilized for real-time observations as well as post-cruise processing. Operation of the equipment was normal and the sensors were unusually stable during the cruise with the exception of an oxygen sensor (also calibrated by Sea-Bird Scientific) that was replaced between casts 24 and 25, earlier in the cruise. Salt samples were collected from most Niskin bottles on each cast for analysis using an Autosal calibrated with International Association for the Physical Sciences of the Oceans (IAPSO) salinity standards to check the salinity values derived from the two conductivity cells on the CTD data. Here, we plot salinity from the primary sensor. Differences between Autosal bottle salinities and the primary conductivity sensor salinity values below 300 m were < 0.002 psu for CTDs 49 and 50.
Geophysical survey
Swath bathymetry data were collected with a SeaBeam model 2112 multi-beam sonar system and were processed on board using the MB-System multi-beam sonar-processing software to remove nadir artefacts. Sub-bottom profiles were collected with an ODEC Bathy2000 3.5 kHz chirp system. Only the uppermost 50 m of data below the sea floor were stored, so some data points represent minimum thicknesses of sediment packages.
Sediment coring and sampling
Cores NBP01-01 KC49 (66°53.669’S, 59°21.875’E, 1219 m water depth) and NBP01-01 JKC50 (66°47.270’S, 57°56.619’E, 1563 m water depth) were collected with a 3 and 6 m kasten corer, respectively. The two sites were selected to target thick sediment sequences located in bathymetric deeps. Kasten cores were sampled immediately on board ship at intervals appropriate to each analysis, as described below.
Chronology
Core chronologies for KC49 and JKC50 are based on, respectively, four and six accelerator mass spectrometer radiocarbon dates of acid-insoluble organic matter. Radiocarbon analysis was conducted in the Lawrence Livermore National Laboratory Center for Accelerator Mass Spectrometry. Calibration of the radiocarbon data was completed using CALIB Radiocarbon Calibration Program 7.1, model Marine13 (http://calib.org). 14C ages were corrected for the marine reservoir effect by 1700 ± 200 14C yr bp, the same reservoir age used for the nearby Mac. Robertson shelf (Mackintosh et al. Reference Mackintosh, Golledge, Domack, Dunbar, Leventer and White2011). An age-depth model for each core was created using the median probable age calculated by the Bayesian age-modelling software Bacon version 2.3.9.1 (Blaauw & Christen Reference Blaauw and Christen2011). Section thickness was set to 20 cm for both cores in order to obtain smooth models that account for changes in accumulation rate.
Grain size
Bulk grain-size distributions were analysed on a Malvern Mastersizer E at Hamilton College. Samples were taken every 5 cm from KC49 and every 2 cm from JKC50 using a 1 cm-thick sampling interval. Bulk sediment samples were analysed with no pre-treatment to remove biogenic components and were visually inspected before analysis to ensure that no grains larger than the Mastersizer E’s upper limit of 2 mm were included. Approximately 0.5 g of bulk sediment sample was mixed with a sodium hexametaphosphate solution in an ultrasonic bath to deflocculate clays before introduction into the sample presentation tank of the Mastersizer E. Results are reported in volume percent, with clays defined as grains < 3.9 μm, fine-medium silt as 3.9–31.0 μm, coarse silt as 31.0–63.0 μm and sand as 63.0–2000 μm.
Biogenic silica
Biogenic silica was measured at 2 cm intervals down-core following a protocol modified from Mortlock & Froelich (Reference Mortlock and Froelich1989). Biogenic silica was dissolved in a 0.5 M NaOH solution at 85°C. A dissolution curve was built by measuring the absorbance of the samples every hour for 5 h, as measured on a spectrophotometer. Absorbance was calibrated to weight percent (wt%) opal using five standards. Replicate samples and blanks were measured for quality control.
Rock-magnetic parameters
Samples for rock-magnetic analyses were collected every 5 cm in KC49 and JKC50 using a 1 cm-thick sampling interval. Samples were freeze-dried and packed into non-magnetic sample holders and measured for low-field mass-normalized magnetic susceptibility (χ) on an AGICO KLY-2 Kappabridge at the Institute for Rock Magnetism, University of Minnesota. Magnetic hysteresis measurements were made on a Princeton Measurements Corp. micro-Vibrating Sample Magnetometer model 3900-04. Magnetization (M) vs applied field (H) curves used a peak field of 1 T and field increments of 5 mT. High-field magnetic susceptibility (χHF) was calculated between 0.7 and 1.0 T and used to remove the paramagnetic contribution to the induced magnetization, as well as to track the diamagnetic contribution to the sediment (Brachfeld Reference Brachfeld2006). The hysteresis parameters of saturation magnetization (MS), saturation remanence (MR) and coercivity (HC) were determined from the paramagnetic-corrected data. The coercivity of remanence (HCR) was determined through the DC demagnetization of a saturation isothermal remnant magnetization imparted in a 1 T field.
Geochemical data
Sediment samples of 1 cm thickness were collected from JKC50 at 10 cm intervals down-core, placed in Whirlpak bags and kept frozen until analysis. Samples were then homogenized and powdered by hand using a mortar and pestle. Bulk geochemical composition was determined using a Jobin Yvon JY 170C Ultrace inductively coupled plasma-emission spectrometer (ICP-ES) in the Analytical Geochemistry Laboratory at Boston University after complete dissolution through either a flux fusion or an acid digestion procedure.
The samples were dissolved by flux fusion using lithium metaborate (LiBO2) with a sample to flux ratio of 4:1. LiBO2 lowers the melting temperature of the sediment to ensure total melting in a 1100°C furnace. The resultant molten glass was dissolved in 10% nitric acid. Each sample was then analysed for Al, Si, Ti, Ba and Sr through the ICP-ES. Fifty-four samples were analysed in random depth order in three batches on the ICP-ES. Calibration standards from the US Geological Survey, US National Bureau of Standards and National Research Council of Canada were processed and analysed in the same manner as the sediment samples. Standards included BCSS, MAG-1, SCO, NBS278, AGV, MRG-1, JCH and HISS-1.
Powdered samples of ~0.12 g were prepared for analysis via microwave digestion and a series of dissolution and evaporation procedures similar to those used by Murray & Leinen (Reference Murray and Leinen1996). Samples were diluted by a factor of 4000 for analysis on the ICP-ES. Fifty-three samples were analysed for 17 elements: Al, Ti, Fe, Mn, Ca, Mg, Na, K, P, Ba, Sr, Sc, V, Cr, Ni, Zn and Y.
Al, Ti, Ba and Sr are easily analysed by either flux fusion or acid digestion and therefore both methods were used. The results were averaged if they agreed within 2% of the measured values. If the results did not agree within 2%, the value from the instrumental run that was more accurate (as compared to the analysis of a reference sediment in the same run) was used.
The levels of precision of both the flux fusion and acid digestion procedures were determined by triplicate analyses. A blank was used to evaluate levels of contamination that may be associated with the processing of the samples. The precision is reported in percent, calculated by the standard deviation of the three measurements divided by the average of the three measurements. The precision using the flux fusion method was < 6.0% for the five elements analysed, while the precision using the acid digestion method was < 3.5% for the 17 elements analysed.
The amount of terrigenous material was calculated using the method of Schroeder et al. (Reference Schroeder, Murray, Leinen, Pflaum and Janecek1997), in which concentrations of Al and Ti in a sample are normalized by the concentration of Al and Ti in Post-Archaean average shale, assuming Al and Ti to be representative of concentrations of typical terrigenous elements.
Diatom abundance and assemblages
KC49 was sampled at 10 cm intervals for diatom analysis, with a total of 24 samples analysed. JKC50 was sampled at 20 cm intervals and from more closely spaced intervals where visible differences in sediment colour or structure were apparent, with a total of 94 sediment samples collected. All of the samples were 1 cm in thickness. Quantitative slides were prepared by the settling method described by Scherer (Reference Scherer1994). Permanent glass slides were mounted in Norland Optical Adhesive 61 and cured under an ultraviolet light. The slides were examined using light microscopy in order to determine diatom assemblages and absolute abundance throughout the cores. For each slide, at least 400 intact diatom valves were counted along transects at 1000× magnification using an oil immersion objective lens. Valves are considered intact when > 50% of the valve is present. For elongate forms that are rarely preserved as intact specimens (i.e. Pseudo-nitzschia, Trichotoxon, Thalassiothrix), only end pieces were counted, and then the total number was divided by two to determine abundance. Vegetative Chaetoceros species were grouped either into the subgenus Chaetoceros or Hyalochaete. Whole Chaetoceros subg. Hyalochaete resting spores were multiplied by two, while half spores were counted as one. Dactyliosolen antarcticus girdle bands were also recorded, but were not included in the calculation of total diatom abundance per slide, as each cell may have many girdle bands.
Results
Oceanography
The CTD data (Fig. 2) show water temperatures ranging from -1.6°C to -0.4°C, with a minimum occurring at ~300 dB pressure, or ~300 m water depth. Salinity ranges from 34.0 to nearly 34.6 psu, while density ranges from 27.3 to 27.8 kg m-3. Both salinity and density increase with depth. Oxygen concentration decreases with depth to a minimum of about 5.4 ml l-1.
Conductivity–temperature–depth data from a. station 49 and b. station 50.

Bathymetry and sub-bottom data
The multi-beam swath map (Fig. 3) reveals a landward-sloping continental shelf with troughs up to 1730 m deep. The 500 m-deep shelf–slope break is 70–90 km from the coast (Fig. 1b). Multiple sets of parallel, elongated ridge–groove structures are observed in Edward VIII Gulf (Fig. 3). One set trends to the east, while another set trends to the north-east. The east-trending set consists of two ~40 m-high ridges that are 1300 m apart and 550–700 m wide. The north-east-trending set consists of multiple ridges ranging from 25 to 50 m high, 430 to 820 m wide and spaced 500–1900 m apart. Another notable feature is an 80 m-high mound orientated NW–SE located at a water depth of 913 m. A profile across the mound reveals an asymmetrical shape, with a steeper seaward side and gentler-sloping landward side (Fig. 3).
Multi-beam swath map and cross-sectional profiles of bathymetric features in Edward VIII Gulf. Study area indicated by red box. EL = Enderby Land, KL = Kemp Land, LHB = Lützow-Holm Bay, MRL = Mac. Robertson Land, PB = Prydz Bay, QML = Queen Maud Land.

Sub-bottom profiles reveal sediment packages ranging from ~8 to 40 m thick, with the thickest sediment packages tending to lie in deeper troughs. At the site of both KC49 and JKC50, the recorded sediment thickness was > 20 m (Fig. 4). Sediment thicknesses increased westwards of the site of JKC50, within the deepest parts of the trough.
Sub-bottom profiles from a. site 49 and b. site 50. Scale shows the relation of two-way travel time in milliseconds (TTWT) to sediment thickness assuming a speed of sound of 1600 m s-1.

Sediment core lithology and chronology
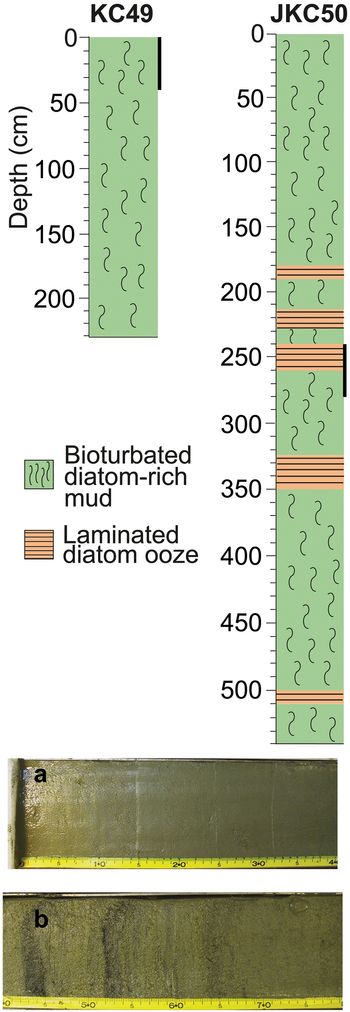
KC49 is a 232 cm-long core consisting of bioturbated diatom-rich mud and diatom ooze. JKC50 is a 540 cm-long core consisting of interbedded bioturbated diatom-rich mud and laminations of diatom ooze (Fig. 5).
Lithology columns and photographs of cores NBP01-01 KC49 and JKC50. Depth in centimetres below sea floor. Black bars along the lithology columns correspond to photographs of a. bioturbated diatom-rich mud from 0 to 40 cm in KC49 and b. laminated diatom ooze from 240 to 260 cm and bioturbated diatom-rich mud from 260 to 280 cm in JKC50.

The results of 10 radiocarbon analyses on the Edward VIII Gulf sediments are listed in Table I. KC49 recovered an excellent sediment–water interface, yet the median probable age of the core top is calculated as 838 cal. yr bp, indicating contamination by allochthonous carbon and/or bioturbation. In order to account for this, we subtract 838 years from the Bacon age-depth model for KC49, assuming that the input of old carbon is constant over time and that the core top is aged zero. The calculated core top age of JKC50 is 223 cal. yr bp, so 223 years were similarly subtracted throughout the core, again assuming constant input of old carbon and that the core top is aged zero. The sedimentation rate appears to be fairly constant throughout KC49, while the sedimentation rate decreases down-core in JKC50 (Fig. 6).
Age-depth models for cores NBP01-01 a. KC49 and b. JKC50. Grey clouds display the 95% confidence limits of the modelled ages.

Radiocarbon dates from cores NBP01-01 KC49 and JKC50.

CAMS = Center for Accelerator Mass Spectrometry.
Sedimentary, rock-magnetic and geochemical data
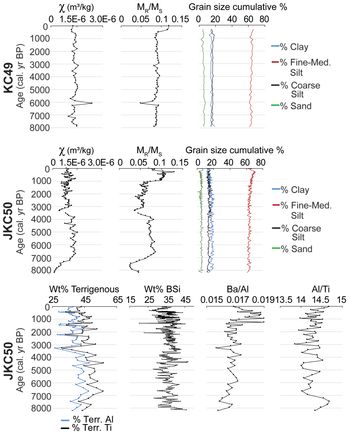
The grain-size distribution of the sediment in both cores is ~65% fine-medium silt (mainly biogenic silica), 15% clay, 15% coarse silt and 5% sand, with proportions largely stable over time (Fig. 7). Magnetic susceptibility (χ) is relatively constant in KC49, although with a slight decrease from 0.5 ka to present. The magnetic grain-size indicator MR/MS is also relatively constant, with a slight increase between 0 and 0.5 ka. The magnetic grain-size proxy varies independently of bulk grain-size distributions in these records because the multi-domain size range for magnetite begins at 10 μm, which is within the fine-medium silt size range. In this instance, multi-domain magnetite is a more sensitive indicator of changes in sediment transport than our bulk grain-size distributions, which convolve terrigenous and biogenic particles due to the sample preparation process used. In contrast to KC49, JKC50 has weaker and more variable χ values and broadly divides the core into three intervals, with higher χ values from c. 0.9 ka to present and from 8 to 4 ka, and lower χ values between 4 and 0.9 ka. These subdivisions are also evident, and more pronounced, in the magnetic grain-size indicator MR/MS, which suggests a shift to coarser grains between 4 and 0.9 ka, as well as in χHF values (not shown), which indicates a greater diamagnetic contribution between 4 and 0.9 ka (Fig. 7).
Magnetic susceptibility (χ), magnetic grain-size (MR/MS) and bulk grain-size cumulative percentage for KC49 and JKC50. Geochemical data for JKC50 include Al- and Ti-based calculations for wt% terrigenous material, wt% biogenic silica (BSi), Ba/Al and Al/Ti for JKC50.

Chemical analyses indicate that the sediment in JKC50 is composed of 40–60 wt% terrigenous sediment and 30–40 wt% biogenic silica. Both Al- and Ti-based calculations of terrigenous wt% show a small step change at c. 4 ka, with the abundance of terrigenous material decreasing over time. Ba/Al maximum values occur between 1.5 and 0.3 ka, while Al/Ti slightly increases from 3 ka to present (Fig. 7).
Diatom assemblages
Diatom absolute abundance ranges from ~20 to 120 million valves per gram of sediment in KC49 and from ~50 to 200 million valves per gram of sediment in JKC50. Both cores display a general trend of diatom abundance decreasing up-core (Fig. 8). Fragilariopsis curta is the most common species in both cores, with mean abundances of ~20% and ~30%, respectively, and it is especially abundant in younger sediments in JKC50. After c. 4.6 ka, Chaetoceros spp. (subgenus Hyalochaete) decrease in relative abundance from ~40% to < 20%. Vegetative valves are more abundant than resting spores throughout each core. Fragilariopsis kerguelensis has a mean abundance of ~14% in KC49 and ~8% in JKC50, with maximum percentages of ~20% in each core. Less common taxa include Fragilariopsis rhombica, Fragilariopsis cylindrus, Shionodiscus gracilis, Rhizosolenia spp., Eucampia antarctica var. recta and Corethron pennatum. Complete assemblage data can be found at http://www.usap-dc.org/view/dataset/601177.
Diatom absolute abundance and assemblage data for cores KC49 and JKC50. mv/gds = millions of valves per gram of dry sediment.

Discussion
Oceanography
The NBP01-01 CTD data, although limited to two stations, provides insight regarding the oceanographic conditions along the Kemp Coast. Water masses with a maximum temperature of -0.4°C, salinity of nearly 34.6 psu and minimum oxygen concentration of 5.4 ml l-1 at depths of ~1200 to 1600 m are consistent with definitions of mCDW (Williams et al. Reference Williams, Herriaz-Borreguero, Roquet, Tamura, Ohshima and Fukamachi2016) and comparable to mCDW observed in a trough off of Totten Glacier, which was as warm as -0.4°C and with a salinity of 34.5 psu at depths of 700 to nearly 1100 m (Rintoul et al. Reference Rintoul, Silvano, Pena-Molino, van Wijk, Rosenberg, Greenbaum and Blankenship2016). Therefore, the relatively warm temperature, high salinity and low oxygen concentration of the observed water mass are consistent with the presence of mCDW in Edward VIII Gulf.
The presence of mCDW may be facilitated by the proximity of the southern boundary of the ACC to the Kemp Coast (Orsi et al. Reference Orsi, Whitworth III and Nowlin1995), as well as the 500 m-deep shelf break. Observations from other parts of East Antarctica reveal that shelf break bathymetry shallower than 400 m prevents warmer waters from entering the shelf environment (Nitsche et al. Reference Nitsche, Porter, Williams, Cougnon, Fraser, Correia and Guerrero2017). Although the bathymetry of the region was not extensively surveyed to the shelf edge during NBP01-01, with only a single track from Edward VIII Gulf across the shelf break, it is possible that a cross-shelf trough could provide access for warm mCDW to intrude onto the continental shelf. While the maximum temperature of -0.4°C in Edward VIII Gulf is the same as that observed in front of the Totten ice shelf, in which basal melting is driven by mCDW (Rintoul et al. Reference Rintoul, Silvano, Pena-Molino, van Wijk, Rosenberg, Greenbaum and Blankenship2016), we have no data regarding the current velocities and thus circulation patterns and consequently cannot determine whether there is sufficient total heat to cause basal melting. As the in situ freezing point decreases with increasing pressure, ice grounded in deep troughs, such as that observed in Edward VIII Gulf, is particularly vulnerable to melting. Therefore, more extensive oceanographic and bathymetric data are needed in order to determine the source of warm water, its flow and its potential impacts on past ice-sheet stability.
Bathymetry and sedimentation
The bathymetry of Edward VIII Gulf provides insight into the previously unconstrained ice-sheet retreat history of the region. The dynamic ice-sheet history along the Kemp Coast is demonstrated by the ridge–groove structures (Fig. 3), which are interpreted to be mega-scale glacial lineations (MSGLs) indicative of past fast-flowing ice (Wellner et al. Reference Wellner, Heroy and Anderson2006). With the exception of the 820 m-wide ridge, they are morphologically consistent in their amplitude, width and spacing, with MSGLs observed in Nielsen Basin, Mertz Trough, Prydz Channel and the Sabrina Coast (Mackintosh et al. Reference Mackintosh, Golledge, Domack, Dunbar, Leventer and White2011, Guitard et al. Reference Guitard, Shevenell, Lavoie and Domack2016, McMullen et al. Reference McMullen, Domack, Leventer, Lavoie and Canals2016, Fernandez et al. Reference Fernandez, Gulick, Domack, Montelli, Leventer and Shevenell2018). As MSGLs indicate the direction of palaeo-drainage of the ice sheet (Wellner et al. Reference Wellner, Heroy and Anderson2006), different orientations of the MSGLs suggest that palaeo-ice streams flowed from two distinct directions. Presumably the Seaton, Downer, Wilma and Robert glacier systems coalesced with the Hoseason and Dovers glacier systems to form a north-eastern flow, then streamed to the east and north, respectively, as the ice sheet progressively retreated (Fig. 1).
An asymmetric feature in the northern end of the gulf displays the characteristic profile of a grounding-zone wedge (GZW) (Fig. 3, profile C). It is located 913 m below the surface, which is significantly deeper than GZWs observed in Nielsen Basin, Mertz Trough, Prydz Channel and the Sabrina Coast, which are respectively ~388, 560, 650 and 500 m deep (Mackintosh et al. Reference Mackintosh, Golledge, Domack, Dunbar, Leventer and White2011, Guitard et al. Reference Guitard, Shevenell, Lavoie and Domack2016, O’Brien et al. Reference O’Brien, Beaman, De Santis, Domack, Escutia and Harris2016, Fernandez et al. Reference Fernandez, Gulick, Domack, Montelli, Leventer and Shevenell2018). The GZW indicates a pause in ice-sheet retreat, or possibly maximum ice-sheet extent, of an exceptionally thick ice sheet. The extreme depth of the GZW may be partially explained by a pause in ice-sheet retreat during a time when the sea level was lower, such as during the Last Glacial Maximum (LGM), but a regional sea-level curve is needed to contextualize ice thickness over time.
The inner shelf trough is notably deep, with a maximum depth of 1730 m, comparable to the 1400 m-deep Palmer Deep basin and the 2287 m-deep Vanderford submarine valley in Vincennes Bay (Cameron Reference Cameron1963). Deep troughs such as these serve as funnels for ice flow across the continental shelf and provide further evidence for remarkably thick ice sheets. The deep, narrow trough is morphologically similar to a fjord and was probably formed by tectonically controlled glacial erosion, as observed faults (Toyoshima et al. Reference Toyoshima, Osanai and Nogi2008) along the Kemp Coast may have provided planes of weakness to guide ice streams. The thickest sediment deposits of at least 40 m are observed in the western end of the 1730 m-deep trough, indicating that the trough is a major depositional environment within the continental shelf.
High-resolution records of Holocene climate have been recovered from other depositional environments around the EAM between Adélie Land and Mac. Robertson Land, demonstrating the Kemp Coast’s potential to provide similarly high-resolution climate records (Stickley et al. Reference Stickley, Pike, Leventer, Dunbar, Domack and Brachfeld2005, Leventer et al. Reference Leventer, Domack, Dunbar, Pike, Stickley and Maddison2006, https://pubs.usgs.gov/of/2007/1047/srp/srp036). The 3.5 kHz sub-bottom data suggest > 20 m of sediment at the sites of both KC49 and JKC50 (Fig. 4). While these two sediment cores provide a record of Holocene climate conditions, neither core recovered LGM diamict, which precludes constraining the timing of deglaciation. A remaining question for both KC49 and JKC50 is the nature of the sediments between the penetration depths of the cores and a presumed LGM diamict. Assuming that the timing of deglaciation in Edward VIII Gulf is similar to that recorded in nearby cores from the Mac. Robertson shelf and Svenner Channel, Prydz Bay, at c. 14 ka (Mackintosh et al. Reference Mackintosh, Golledge, Domack, Dunbar, Leventer and White2011), then much higher sedimentation rates must characterize the lowermost sediments in Edward VIII Gulf. With ~20 m underlying the base of KC49 representing an estimated 6000 years, the average sedimentation rate below KC49 is extrapolated to be ~300 cm kyr-1, an order of magnitude greater than the sedimentation rate of ~30 cm kyr-1 recorded in the core. Similarly, the extrapolated average sedimentation rate below JKC50 is > 200 cm kyr-1, which is considerably greater than JKC50’s average rate of ~70 cm kyr-1. Although sediment accumulation rates and unit thicknesses vary by location, many of the sedimentary packages found in deep, isolated basins around the EAM shelf share a common lithostratigraphy of rapidly deposited, laminated or varved sediments overlying LGM diamict, characteristic of the calving bay re-entrant model of deglaciation (Leventer et al. Reference Leventer, Domack, Dunbar, Pike, Stickley and Maddison2006). It is probable that sediments deeper than those recovered by KC49 and JKC50 were deposited rapidly and may reveal details of deglacial processes in this region of the Antarctic margin. In addition, the thicker sediment packages of at least 40 m observed in the western end of the 1730 m-deep trough indicate that even higher-resolution records may be available.
Holocene review
Although little is currently known about the glacial to Holocene history of the Kemp Coast, regional deglacial histories for adjacent regions of East Antarctica are better documented. Ice retreat initiated c. 14 ka in the Nielsen Basin, Mac. Robertson Land (Mackintosh et al. Reference Mackintosh, Golledge, Domack, Dunbar, Leventer and White2011) and c. 12.8 ka in Burton Basin, Mac. Robertson Land (Borchers et al. Reference Borchers, Dietze, Kuhn, Esper, Voigt, Hartmann and Diekmann2016). According to additional terrestrial cosmogenic nuclide (TCN) exposure ages, retreat may have initiated as early as 18 ka in the Lambert Glacier/Amery Ice Shelf system, possibly in response to abrupt sea-level rise (White et al. Reference White, Fink and Gore2011). 14C chronologies of marine sediment cores indicate that retreat initiated by 13 ka in the East Prydz Channel and by 11 ka in the Svenner Channel (Mackintosh et al. Reference Mackintosh, Verleyen, O’Brien, White, Selwyn Jones and McKay2014), with rapid relative sea-level rise occurring in Prydz Bay during the early Holocene, c. 9.5 ka (Hodgson et al. Reference Hodgson, Whitehouse, DeCort, Berg, Verleyen and Tavernier2016). Additionally, a study of TCN exposure ages of glacial erratics in the Lützow-Holm Bay area to the west of Kemp Land suggests that deglaciation initiated c. 10 kyr bp (Yamane et al. Reference Yamane, Yokoyama, Miura, Maemoku, Iwasaki and Matsuzaki2011), while investigation of radiocarbon-dated marine fossils and isolation lakes suggests that deglaciation initiated c. 11 ka (Verleyen et al. Reference Verleyen, Tavernier, Hodgson, Whitehouse, Kudoh and Imura2017). Although post-LGM ice retreat varied across this sector of the EAIS due to regional differences in bathymetry and ice accumulation patterns, most recession initiated by c. 12 ka, probably due to ocean warming, and the EAIS reached its present-day extent by c. 6 ka (Macintosh et al. Reference Mackintosh, Verleyen, O’Brien, White, Selwyn Jones and McKay2014). Furthermore, multi-proxy studies from sites across the EAIS indicate variable sea-surface temperatures and sea-ice durations throughout the Holocene, with a shift to cooler conditions occurring c. 4 to 3 ka (Taylor & McMinn Reference Taylor and McMinn2001, Crosta et al. Reference Crosta, Debret, Denis, Courty and Ther2007, Panizzo et al. Reference Panizzo, Crespin, Crosta, Shemesh, Massé and Yam2014, Borchers et al. Reference Borchers, Dietze, Kuhn, Esper, Voigt, Hartmann and Diekmann2016).
The diatom assemblages and sedimentological properties of KC49 and JKC50 reveal an overall cooling trend throughout the Holocene that is consistent with circum-Antarctic records. The mid-Holocene (8–4 ka) is characterized by higher absolute diatom abundances and a higher relative abundance of Chaetoceros subg. Hyalochaete, which is widely regarded as a primary productivity indicator. As the transition from vegetative cells to resting spores is commonly a response to nutrient depletion, the greater abundance of vegetative valves over resting spores suggests moderate primary productivity levels rather than conditions inducing hyper-productivity (Leventer Reference Leventer1991). High productivity and a lower abundance of sea ice-associated diatoms suggest a mid-Holocene warm period, consistent with other marine- and lake-based diatom and geochemical evidence from across East Antarctica that reveal warmer temperatures, a greater abundance of open ocean-affiliated diatoms and higher productivity occurring throughout the mid-Holocene from c. 8 to 4 ka (Crosta et al. Reference Crosta, Debret, Denis, Courty and Ther2007, Denis et al. Reference Denis, Crosta, Schmidt, Carson, Ganeshram and Renssen2009, Berg et al. Reference Berg, Wagner, Cremer, Leng and Melles2010, Panizzo et al. Reference Panizzo, Crespin, Crosta, Shemesh, Massé and Yam2014). The mid-Holocene warm period was probably accompanied by higher sea levels, as radiocarbon ages of fossils found on raised beaches in Lützow-Holm Bay suggest a marine transgression occurring between 8 and 3 ka (Igarashi et al. Reference Igarashi, Harada and Moriwaki1995), while isolation basins adjacent to the Lambert Glacier suggest a sea-level highstand of ~8 m at c. 7 ka (Verleyen et al. Reference Verleyen, Hodgson, Milne, Sabbe and Vyverman2005). Further chronological analysis is necessary in order to confirm this, but the raised beaches found along the coast of Edward VIII Gulf could have formed during this period characterized by higher sea levels and warmer temperatures.
The diatom assemblages and sedimentological properties further suggest that the warm mid-Holocene transitioned to cooler conditions during the late Holocene between c. 4.5 and 4 ka and persisted from 4 to 0.9 ka. At c. 4.5 ka, a decrease in relative abundance of Chaetoceros and an increase in relative abundance of F. curta, a sea ice-associated species (Armand et al. Reference Armand, Crosta, Romero and Pichon2005), indicate increased sea-ice extent and cooler conditions. Although the timing varies by location, our observations are consistent with multi-proxy records across East Antarctica showing cooler temperatures, a greater abundance of sea ice-associated diatoms and lower productivity during the late Holocene (Crosta et al. Reference Crosta, Debret, Denis, Courty and Ther2007, Denis et al. Reference Denis, Crosta, Schmidt, Carson, Ganeshram and Renssen2009, Berg et al. Reference Berg, Wagner, Cremer, Leng and Melles2010, Panizzo et al. Reference Panizzo, Crespin, Crosta, Shemesh, Massé and Yam2014, Borchers et al. Reference Borchers, Dietze, Kuhn, Esper, Voigt, Hartmann and Diekmann2016).
In JKC50, the rock-magnetic grain-size proxy MR/MS ratio is at a minimum between 4 and 0.9 ka relative to mid-Holocene and modern values, indicating the presence of coarser multi-domain magnetite. Lower MR/MS ratios can be caused by diagenesis that preferentially dissolves fine-grained magnetite. This typically is driven by elevated total organic carbon (TOC) content (Brachfeld et al. Reference Brachfeld, Banerjee, Guyodo and Acton2002). While %TOC was not measured in KC49 or JKC50, we rule out this explanation as other productivity proxies that are expected to co-vary with TOC, such as wt% biogenic silica, Ba/Al and total diatom abundance, are all at their minimum values between 4 and 0.9 ka, with the exception of Ba/Al at a maximum from 1.5 to 0.3 ka. There is no low-susceptibility zone accompanying the change in magnetic grain size that would indicate dissolution of ferromagnetic material, and the MR/MS ratio returns to higher values deeper in the core rather than remaining uniformly low below a diagenetic horizon.
As rock-magnetic parameters remain constant in KC49, we speculate that a change in terrigenous sediment supply occurred that involved the glaciers on the western side of the gulf. Innermost Edward VIII Gulf and JKC50 sit near the boundary between the Archaean Napier Complex to the west and the late Proterozoic Rayner Complex to the south and east (Sheraton et al. Reference Sheraton, Tingey, Black, Offe and Ellis1987, Toyoshima et al. Reference Toyoshima, Osanai and Nogi2008). During the interval from 4 to 0.9 ka, JKC50 received terrigenous material with coarser magnetic grains, possibly from the Napier Complex. There are no published rock-magnetic data available from either the Napier or the Rayner complexes, but magnetite-rich quartzite with millimetre-size iron oxides and ironstones have been reported in Napier Complex (Sheraton et al. Reference Sheraton, Tingey, Black, Offe and Ellis1987). The change in terrigenous sediment supply is probably linked to cooler conditions, as the timing of the change coincides with the shift to cooler conditions demonstrated by the diatom assemblage data.
Conclusions
Hydrographical, geophysical and marine geological data provide insight into the relatively stable Holocene history of the Kemp Coast, from c. 8 ka to present. A warm, saline and oxygen-depleted water mass has been identified in Edward VIII Gulf and is considered to be mCDW based on its hydrographical properties. The presence of mCDW, which would have access to the inner shelf across the 500 m-deep shelf break, is not likely to threaten present ice-sheet stability due to high inland bed elevations, but is noteworthy given its potential to drive past melting of ice grounded in deep troughs. While the timing of deglaciation remains unconstrained, bathymetric features such as a deep inner shelf trough, MSGLs and a GZW suggest a dynamic evolution of the EAIS in this area. Sedimentological, rock-magnetic and diatom assemblage data indicate warm conditions occurring from c. 8 to 4 ka and a transition to cooler conditions along with a change in terrigenous sediment source occurring from c. 4 ka to present.
Additional sampling of sites in the Edward VIII Gulf in addition to more extensive geophysical surveys would be useful for corroborating and extending these interpretations. Analysis of fossils on raised beaches may constrain the timing of periods of high sea level, while thick sediment deposits within the trough present compelling targets for records of the transition from the LGM to the Holocene, as well as high-resolution reconstruction of Holocene climate change.
Acknowledgements
We thank the Edison-Chouest Offshore crew and the Raytheon Polar Services technical staff who participated on cruise NBP01-01, and Kathleen Gavahan, who produced the swath map in Fig. 3. We also thank two anonymous reviewers for their helpful and insightful comments. The Coring Holocene Antarctic Ocean Sediment (CHAOS) NBP01-01 cruise was supported by National Science Foundation grants 9909367 to Amy Leventer and Charlie McClennen, 9909793 to Patricia Manley, 9909803 to Stefanie A. Brachfeld and 9909837 to Robert B. Dunbar.
Author contributions
IAD prepared the manuscript and figures. AL was chief scientist, SAB, RBD and PM were principal investigators and MJM, NM, FT, AES, MH and KAK were participants on cruise NBP01-01. All authors contributed to data collection, analysis and interpretation. AL, SAB, RBD, AES and RWM edited the manuscript.