1. Introduction
This paper contains our report on factors affecting State Pension Age (SPA) in the United Kingdom. The Pensions Board of the Institute and Faculty of Actuaries (IFoA) established a working party in the summer of 2013 to consider these factors to inform the debate within the profession on this subject. This subject has a high profile at present owing to the changes in the UK State pension regime. The subject is still evolving and this paper represents our views as at the close of 2014.
We were asked to consider what the purpose of the SPA is and by doing so to consider what factors should be taken into account when setting SPA. In considering these factors, we have determined that our scope does not extend to the political decision making, or the detail of the interactions of the future projections or finances. We will, however, make reference to these aspects affecting State pension in various parts of our report where they have particular relevance to the current scenario, the regime shortly to be in place, or any of the alternatives that we outline as possible variations to the proposed regime.
Our objective is to provide a summary of the present facts surrounding SPA and the changes that have recently been legislated, to outline the impacts of the proposed regime and to highlight some additional factors that may warrant consideration. We believe a further objective is to identify areas where the IFoA should be involved in the future.
We note (section 8) some variations to the State pension regime that could be considered alongside, or instead of, further increases in SPA. We describe these alternatives only briefly to prompt discussions. We do not suggest that the alternatives would necessarily be an improvement on the current proposals, but wish to highlight that there may be other ways of addressing the issues that the Government claims are prompting changes to State pensions and the SPA. Significant additional work would be required if a proposal to adopt any of these alternatives was to be made at some future date.
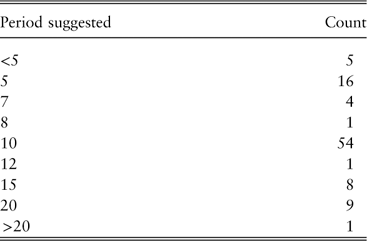
As part of our work, in July 2014 we circulated a brief survey to recipients of the Pensions Newsletter issued by the IFoA. A summary of the survey responses is provided in the Appendix, and the survey results have influenced various sections of this report.
During the time we have been considering this topic, we have seen the completion of the Scottish Independence referendum, with the associated promise of further devolution of powers to regional governments. Although the current proposals do not include devolving decisions on SPA in Scotland, we note that one eventual outcome of further devolution of powers could be that different regional governments might conceivably select different SPAs.
The next three sections of this paper provide an outline of the background that has brought the United Kingdom to the current (December 2014) position. Those familiar with this background may wish to give these sections only a brief review, before moving to section 5 and the following. These later sections provide a deeper commentary on the SPA regime that is proposed to become effective from April 2016.
2. The Role of the SPA
Our first question was, in part, simple – what role does SPA play?
The most important and simple answer is that it is, currently, the earliest age at which a person eligible for the State pension is entitled to start receiving it.
In addition to the above, we note some other impacts that SPA has. These include the following:
∙ SPA is important because many occupational pension schemes link their expected pension age to SPA either directly (by defining scheme pension age as “SPA”) or indirectly (by seeking to change the defined scheme pension age when SPA is increased).
∙ Individuals’ behaviour and expectations are greatly affected by their anticipated SPAs. For example, many individuals assume that they will retire at their SPA.
∙ Various benefits for those seeking work or in incapacity cease at SPA, whilst the requirement to pay National Insurance (NI) contributions also currently ceases at SPA.
Some other old-age State benefits, however, are not linked to SPA. These include Guaranteed Minimum Pension age, free prescriptions in the National Health Service (NHS) and, in some regions, free bus passes.
The wider situation is that SPA is an important element within the complex mix of considerations that successive governments have to take into account in projecting the level of State pension can be afforded, from what age and for which members of the population at successive future dates.
This wider mix of considerations includes the following (in addition to the age at which State pension may be paid):
∙ acceptable future levels of costs of State pensions, say as a percentage of projected gross domestic product (GDP) or some other measure;
∙ what conditions must be met in order to qualify for State pension;
∙ amounts of pension, for example, in relation to average earnings, or the assumed minimum necessary costs of living to avoid “poverty”, and the rates of pension increase with time/inflation;
∙ whether the pension is universal or variable with some element of means-testing;
∙ whether the (basic) amount is the same for all or varies by some factor, or is adjusted for when it starts;
∙ how these pensions are funded, and the resulting impact on the taxation burden of current and future generations;
∙ levels of private pension provision and the impact State provision has on this;
∙ possible impacts on labour market behaviour, for example, employment rates at or close to SPA;
∙ impacts on taxation income (especially NI contributions as NI contributions currently stop at SPA);
∙ interaction with other State benefits that may provide additional or alternative income to some/all pensioners at or around SPA;
∙ any transitional arrangements to smooth the introduction of any changes with previous regimes of State pension promises; and
∙ the behaviours and expectations of individuals and their ability to change any existing pension planning and savings.
The list above is not intended to be exhaustive, but illustrates the range of factors the Government may wish to consider. The relative significance of the factors will vary over time and represents a largely political decision. These decisions will be informed by economic and demographic projections, as well as political ideology and wider budgetary policy. The choice of SPA is dependent upon the broad views on these factors. The acceptability (to the Government) of a particular SPA choice will depend upon the constraints imposed by decisions on these factors.
When changes to SPA are to be made, there is a generally accepted view that those close to the existing SPA should be affected as little as possible as they would not have sufficient time to react to any proposed changes and amend their retirement planning. As a result, SPA will usually be determined first, with the other factors (e.g. pension level, how the costs are to be met) then being adjusted in shorter time frames to fit budgetary constraints.
Consideration of what SPA should be requires an analysis of the different possible objectives of providing a State pension. This is because the SPA affects the numbers of pensioners, and hence the cost of pensions in payment.
SPA being the age at which the Government is willing to start paying State pension implies that before this age it expects people to be able to support themselves by working, from other assets they own or within a family group or similar caring arrangement. Where this is not possible some means-tested State benefits may be paid.
In providing additional income to people above a certain age, the State is helping all recipients to have greater spending power and hopefully enabling them to enjoy a period when they may no longer need, or wish, to work. Funding constraints, however, may mean that the basic levels of State pension are not sufficient on their own for all to avoid poverty, and there may also be reluctance to pay additional income to those who do not need the State pension to cover their living expenses.
The Government needs to balance the objectives of maintaining affordable pension costs, while also providing pensions that are seen to be fair and adequate, and this can therefore affect decisions on SPA as well as the level of the State pension and who is entitled to it.
3. History of the State Pension and SPA in the United Kingdom
In the United Kingdom, the objective of State pension provision and SPA has changed frequently over time. The historical details in this section are taken from the book 100 Years of State Pension (Salter et al., Reference Salter, Bryans, Redman and Hewitt2009), published by the IFoA.
The first State pension system in the United Kingdom consisted only of means-tested, non-contributory benefits. The first pensions were paid in January 1909 to around 490,000 people aged 70 or more, who fell below an annual income eligibility criteria.
In 1926, a contributory State pension system was introduced and paid from age 65 without a means test. It was based on contributions paid during employment by the employer and employee. Different SPAs for men and women were introduced in 1940, with the SPA for women reduced to age 60.
The National Insurance Act 1946 introduced a basic State pension (BSP) in the United Kingdom, with effect from 1948. A minimum number of qualifying years’ contributions was required in order to receive the full benefit and a condition was introduced, which meant that an individual had to retire as well as reach SPA to claim BSP.
BSP was originally proposed as a flat-rate income in old age that was to be funded through contributions paid to the State during working life. These contributions were to be calculated on an actuarially fair basis – that is, the contributions paid over an individual’s working life would finance the proposed retirement pension for that individual. However, in order to provide a State pension to those individuals already over SPA, the link between the contributions paid to fund the State pension and the individuals who would receive that pension was severed and BSP was established as a “pay-as-you-go” system rather than as a funded system.
The first earnings-related State pension system was introduced in the United Kingdom in 1961 through the introduction of the Graduated Retirement Benefit (GRB). Under GRB, wage earners paid mandatory contributions up to a certain level of earnings in order to purchase units of additional pension that would supplement the BSP. GRB was superseded in 1978 by the State Earnings-Related Pension Scheme, which in turn was replaced by the State Second Pension in 2002.
Under the Pensions Act 1995, women’s SPA was to be equalised with men’s at age 65 between April 2010 and April 2020. The Pensions Act 2007 required the equalised SPA to increase to 66 by 2026, 67 by 2036 and 68 by 2046.
These changes have now been accelerated by the Pensions Act 2011 so that women’s SPA will increase to reach age 65 by November 2018. From December 2018, the SPA for both men and women will start to increase to reach 66 by October 2020. The Pensions Act 2014 brought the increase in the SPA from 66 to 67 forward by 8 years, such that it will now increase to 67 between 2026 and 2028.
The history of SPA in the United Kingdom from 1908 to present day, and changes to SPA that are currently legislated for, is shown in Figure 1.
History of State Pension Age (from Old Age Pension Act 1908 to present day)

4. The Proposed System from 2016
4.1. The Single-Tier Pension and Auto-Enrolment
The revised format of State pension expected to be in place from April 2016 stems from the recommendations of the Pensions Commission, in particular the contents of the Second Report published in 2005 (Pensions Commission, 2005).
The Commission identified concerns with the existing State pension regime primarily arising from the following:
∙ its complexity – uncertainty with the pension it would provide and the age from which it would start makes planning difficult;
∙ inadequate benefits for certain people (e.g. those working as unpaid carers and those on very low pay), whereas also providing a generous “top-up” benefit to high earners;
∙ it not providing an incentive to private pension saving – the extensive element of means-tested additional benefit potentially payable to those with little or no private pension was perceived to disincentivise modest levels of private saving; and
∙ its costs being forecast to increase, causing concerns over sustainability and giving rise to questions of fairness between generations and between different groups within generations.
The Commission also noted the substitution effect where under the existent system various other means-tested State benefits were payable to some pensioners in addition to State pensions. It was observed that in the absence of changes to the pension systems, the cost of these means-tested benefits was expected to increase considerably.
Many of the Commission’s recommendations were accepted by Government and have been implemented in stages since 2007. The Pension Act 2014 sets out a revised State pension, which is flat rate and payable to all (subject to having completed 35 qualifying years of NI contributions). The Department for Work and Pensions (DWP) is currently indicating that the flat-rate pension would be set at £148.40 a week in 2014–2015 terms (DWP, 2014a). At this level, it is suggested that the revised pension should reduce reliance on means-tested additional benefits, provide good benefits for lower earners (e.g. part-time workers), but also represent a lower level of State benefit for higher earners.
Alongside the changes to State pensions, the Government has introduced the auto-enrolment requirements to foster greater private pension accrual.
The introduction of the flat-rate pension and auto-enrolment are the Government’s approach to address the first three bullets above. We will now concentrate on the issues raised by the fourth bullet point.
4.2. Sustainability Issues
Successive mortality investigations over the past 30–40 years have revealed ongoing, and more rapid than previously expected, improvements in longevity in the United Kingdom. We have also seen relatively low birth rates. These two elements, combined with the effect of the “baby boomer” generation recently reaching pension age, results in projections showing:
∙ increasing numbers of people over age 65 (Figure 2); coupled with
∙ an increasing old-age dependency ratio (the ratio of {number of people over SPA} to {number of people of working age under SPA}) (Figure 3); and
∙ (in the absence of any other changes) an increasing proportion of adult lifetime in receipt of State pension (see Figure 6).
Projected UK population split between under 20, 20–64 and 65+ year old’s Source: Own calculations based upon ONS 2012-based principal projections (UK)
UK old-age dependency ratio per 1,000 working age people Source: Figure 2.2 of ONS (2012), reproduced from underlying data and reformatted. Projections based on ONS 2010-based principal projections. Working age taken to be aged 16 and over. Note that the old-age dependency ratio line taking account of changes includes the changes legislated for in the Pensions Acts 1995, 2007 and 2011 – thus excludes the acceleration of increase in State Pension Age (SPA) to 67 introduced in Pensions Act 2014. Allowing for this would lower the projected ratio between 2024 and 2036, with the same values from 2036 onwards
The DWP Green Paper on reform of State pension titled A State Pension for the 21st Century (DWP, 2011) illustrated the need for the Government’s proposed changes by observing that:
∙ The proportion of the population aged 65 or over will have increased from around 13% in 1971 to around 25% by the 2050s.
∙ When the first contributory pension was introduced in 1926, life expectancy (on a cohort basis) of men reaching age 65 was on average just over a decade. In 1981, an average 65-year-old man could expect to live for another 14 years, today it is over 21 years and by 2050 it is projected to be over 25 years.
∙ Projected spending on State pensions by the middle of this century has increased by around 0.5% of GDP in the space of only 2 years, between 2008 and 2010.
Other publications have also highlighted that the cost of State pensions is projected to increase significantly. For example, it was suggested to increase from 6.1% of GDP in 2004 to 7.6% of GDP by 2050 (Pension Commission, 2005), with much of this increase occurring owing to greater eligibility for pension credit – the means-tested additional benefit. Alternatively, public expenditure on State pensions and related benefits was projected to rise from 5.7% of GDP in 2010/2011 to 6.9% in 2050/2051 (ONS, 2011).
The Office for Budget Responsibility’s (OBR’s) fiscal sustainability report for 2011 (OBR, 2011) projected that expenditure on State pensions (basic pension plus earnings-related elements and including winter fuel payments, etc.) would increase from 5.7% of GDP to 7.9% between 2010/2011 and 2060/2061 (see Figure 4).
State pension costs as %GDP Source: OBR (2011). GDP, gross domestic product.
The old-age dependency ratio (on an unchanged but equalised SPA of 65) was projected to increase from 27% in 2004 to 47% in 2050 by the Pension Commission (2005) and to increase further after that date. From Figure 3, we can see how existing changes to SPA have gone a long way to stabilising the old-age dependency ratio in the short to medium term.
The projections of longevity, old-age dependency ratio and State spending are updated on a regular basis by the organisations (e.g. OBR, DWP and ONS) that produce them. Projections differ slightly according to the welfare costs they take into account, the base data used to project from and the projection methods. Despite noting that all projections of future populations, life expectancy and related matters are inherently uncertain and that there are wide variations in projections based on different data and assumptions, it is apparent that the main UK political parties agreed that the costs to future working populations of continuing the existent system would have been unsustainable.
In a pay-as-you-go system, such as the UK State pension, the payments to current pensioners are essentially met by the contributions of current workers. Given the projected increase in costs as a percentage of GDP, and (over the medium and longer term) the increasing projected old-age dependency ratio, it can be seen that the relative costs to successive generations of workers, of providing the benefits for the earlier generations, would increase appreciably.
This raises concerns regarding fairness across generations and the question arises of how to manage it. It seems reasonable to find some way of making those who benefit from longer expected life contribute to the increasing costs.
Many people in their 60s are economically active. SPA sets an expectation of a date on which they might leave the workforce. One way to control cost is to delay the age at which State pension starts. This reduces annual State pension costs and (along with the abolition of the default retirement age) helps keep the old-age dependency ratio down.
A key element of the Government’s proposed solution (whilst other ways of tackling these problems would have been possible and some are considered later in section 8) is to increase SPA. In particular, it has been proposed to have regard to projected life expectancy when setting the SPA in future years, with regular reviews and notice periods for any changes that are intended to allow affected people to plan accordingly.
Changing SPA does not necessarily increase the age at which people actually retire or the rates of employment at ages around the SPA. People with sufficient assets or firm plans for retirement may still retire earlier, and there may not be sufficient availability of work to increase rates of employment for older workers. The people most likely to have to work longer when SPA increases are those for whom the State pension represents a significant portion of retirement income.
The question therefore remains whether increases in SPA will have the desired effect or whether other State benefits will be used as substitutes before the increased SPA. Our perception is that one effect of the recent discussions is that many individuals (including younger workers) are already anticipating retiring at ages above 65 and, currently at least, are aware of likely further uncertainty in SPA.
4.3. Pension Changes Announced in 2014 Budget Statement
The Chancellor, in his 2014 Budget Statement, announced proposals to remove many restrictions on how defined contribution (DC) pension pots may be used in future. The most significant of the proposals were as follows:
∙ flexibility in ability to drawdown cash from these pension pots on retirement at ages of 55 and over (including a proposal that the age moves to 57 when SPA is set at 67 and is SPA less 10 years thereafter);
∙ simplified taxation treatment of such cash withdrawals, non-penal – taxed as income at the relevant marginal rate;
∙ greater flexibility in investments, such as simplified drawdown rules and the removal of drawdown limits, approval of temporary annuities (akin to bridging pensions), etc.
The pensions industry is developing flexible products, which may mean that some people are able to be less affected by SPA changing in the future.
The discussions on these issues have often centred on the idea that a significant proportion of the pension savings pot might be taken immediately. This is despite the fact that the majority of the cash would be taxed at the marginal rate and depending on the size of the pot it may involve some higher rate taxation.
The Government has conducted an associated consultation covering related matters. There will be restrictions on transfers from unfunded public sector defined benefit (DB) pension schemes to protect these schemes (and the UK economy) from any detrimental effects (to short-term cash flows) caused by possibly large numbers of transfer requests seeking to benefit from the proposed flexibilities for DC pots.
We have briefly considered how the changes outlined in the Budget Statement might impact SPA. Until the proposals are finalised and have been in operation for a few years, we cannot say for sure what their impact will be. What seems likely is that the proposals will result in the proceeds of these pension pots being drawn down at an earlier average age than has been the case up to now.
To the extent that more cash is taken earlier in future than an annuity (or drawdown) would currently produce as annual income, then (amongst other effects):
∙ the Government’s tax income will be advanced;
∙ longer-lived pensioners, or profligate ones, may exhaust their pension pots, and hence, there may be an increase in reliance on State benefits at older ages in due course; and
∙ the flexibility may allow more people to retire before SPA where they would previously have been unable to afford to do so, or to defer their State pension and have it increased.
5. Legislation and DWP Proposal
In this section, we describe the recent legislation which requires there to be regular reviews of the SPA from 2017. It also describes additional information provided by the DWP on how it expects the review process to work.
5.1. Pensions Act 2014
The Pensions Act 2014 increases SPA from 66 to 67 with the change phased in over a 2-year period from 6 April 2026.
It also introduces the requirement for periodic review of the rules around SPA by the Secretary of State. The outcome of each review must be published as a report, with the first such report being published before 7 May 2017. Subsequent reports must be published within 6 years of the date the previous report was published.
Each review is to have regard to projected life expectancy and any other factors that the Secretary of State considers relevant. Hence, before preparing his own report, the Secretary of State is required to commission a report on projected life expectancy from the Government Actuary. In addition, the Secretary must commission a second report on any other factors, which the Secretary specifies.
The deadline for the first report from the Secretary of State is 7 May 2017. The reports from the Government Actuary and other appointed person(s) will, therefore, need to be finalised somewhat in advance of this date to allow time for the Secretary of State to consider their content.
Any parties, such as, for example, the IFoA, seeking to influence either the Government Actuary’s report or the other report will, therefore, need to prepare their evidence significantly before 7 May 2017. Anyone seeking to influence the Secretary of State’s specified list of “other factors” will need to make their points even earlier.
5.1.1. Government Actuary’s report
When carrying out the review, the Government Actuary, or Deputy Government Actuary, must prepare a report for the Secretary of State on:
∙ whether the rules about SPA mean that, on average, a person who reaches SPA within a specified period can be expected to spend a specified proportion of his or her adult life in retirement; and
∙ if not, ways in which the rules might be changed with a view to achieving that result.
Adult life is defined, within the Act, as the being after a specified age. The actual age is not set out in the Act, but will be specified by the Secretary of State when the Actuary’s report is requested.
Hence, before commissioning the Government Actuary’s report, the Secretary must determine what he will specify for:
∙ the age at which adult life is deemed to start;
∙ the proportion of adult life expected to be spent in retirement; and
∙ the period into the future for attaining SPA that the Actuary is to consider.
We assume that the Secretary will receive input on what to specify for these values, which could, presumably, change over time. Changes in the values specified can have a significant immediate impact on the Government Actuary’s conclusions and recommendations (see section 6).
5.1.2. Report on other factors
In addition to the report from the Government Actuary, the Secretary of State must appoint an independent person, or persons, to prepare a report on other factors (to be specified by the Secretary of State) relevant to the review. It may, therefore, be possible to influence the Secretary of State regarding the extra factors to be specified. We provide some thoughts on factors that could be specified for consideration by the Secretary in section 7 below.
5.2. DWP Proposals
In December 2013, the Government published further details on how it anticipates that the review of SPA would work (DWP, 2013).
5.2.1. Factors to consider
The Government has said it anticipates that the factors to be considered by the independent person leading on the second report will include healthy life expectancy (HLE) and differences in life expectancy between socio-economic groups. These are discussed further in section 7.
5.2.2. DWP formula proposal
The formula that is proposed be used by the Government Actuary for his report expresses the proportion of adult life spend in receipt of State pension as:
 $$\eqalign{{\rm Proportion } \ {\rm of} \ {\rm adult} \ {\rm life} \ {\rm spent } \ {\rm in } \ {\rm receipt } \ {\rm of} \ {\rm SPA}\cr\qquad\,=\,{{{\rm (Life } \ {\rm expectancy} \ {\rm at } \ {\rm SPA)}} \over {{\rm (Life } \ {\rm expectancy } \ {\rm at } \ {\rm SPA} \ {\rm {\plus}} \ {\rm SPA} \ {\minus}\,{\rm adult} \ {\rm life } \ {\rm starting} \ {\rm age)}}}$$
The DWP background note to the Autumn Statement (DWP, 2013) suggests that at each review the process followed is to:
∙ calculate the projected “Proportion of adult life spent in receipt of State pension”, for each future year, using the current legislated SPAs, rounded to nearest 0.1%;
∙ find (if it exists) the 1st year where this proportion reaches (or exceeds) 33.3%;
∙ revise SPA upwards so that it is 1 year higher in that year (bringing forward that planned increase if already legislated for);
∙ phase in the revision over a period of time (currently 2 years); and
∙ repeat the above process using revised schedule of SPA increases to identify if any further acceleration of planned increases/additional increases in SPA is needed.
A key point to note here is that the proportion of adult life expectancy the average individual expects to spend in retirement is not maintained at 33.3%. Instead, 33.3% is the maximum time the average individual can expect to spend in retirement. For most of the time, the average individual would be expecting less than 33.3%. Section 6.2 illustrates this in more detail.
There is an expectation that life expectancy will continue to increase and the formulae and process are built on this assumption. However, should life expectancy fall, either because of a rise in mortality rates or a switch to a lower assumed rate of mortality improvement, then it is not known whether this would result in reductions to SPA or how such a reduction would be implemented.
5.2.3. Life expectancy
Life expectancy will be measured using the latest principal projections of UK cohort life expectancy, which are published by the Office for National Statistics (ONS) every 2 years.
Life expectancy will be taken as the weighted average life expectancy of both genders. The weights for the respective life expectancies will be the numbers of men and women in the population at the relevant SPA:
 $${{{\rm (Men }\,{\rm at} \ {\rm SPA } \ {\times} \ {\rm male } \ {\rm cohort} \ {\rm life } \ {\rm expectancy)} \ {\rm {\plus}} \ {\rm (Women } \ {\rm at } \ {\rm SPA } \ {\times} \ {\rm female} \ {\rm cohort } \ {\rm life} \ {\rm expectancy)}} \over {{\rm Population } \ {\rm at} \ {\rm SPA}}}$$
It is unclear if the population weighting is based on the mix at the review date or the projected mix for the future SPA year. If the projected mix is used then the calculation is sensitive to the gender mix of immigration/emigration assumed in the ONS projections.
5.2.4. Adult life starting age
The Government has proposed that an appropriate starting age for adult life is age 20. This decision is based on Organization for Economic Cooperation and Development (OECD) convention. The Government has said that this is commonly a comparator for other matters relating to pensions.
5.2.5. Notice period
The proposed formula is mechanistic and could, on its own, lead to increases in SPA with relatively little notice. The DWP (2013) paper proposed that the review should “seek to give individuals affected by changes to their SPA at least ten years’ notice”. In practice, given the proposed 2-year phasing in periods, this means it may take a minimum of 12 years to complete an increase in SPA.
5.2.6. Timing of process
Given the period for implementation shown in the paragraph above, it may be the case that SPA cannot always be changed fast enough to ensure that no more than one-third of adult life expectancy is spent after SPA.
There is a potential for the recognition of changes in life expectancy to take longer than 12 years. For example, should some new information come to light it could potentially be up to 6 years before it is covered by one of the reports. The DWP would then need time to consider the reports and there would then be a 12-year implementation period, as outlined above.
In such a situation, it could be a significant number of years before an event or extra data fully feeds through into a higher SPA. In practice, there may, therefore, be a need to accelerate the process of adjusting SPA, should a shock to life expectancy be identified. This could mean shortening any one of the steps in the process, although the most effective way to accelerate the process would mean reducing the notice period.
6. The DWP’s Formulaic Link Between SPA and Life Expectancy
In this section, we explore this formula in more depth with particular consideration of:
∙ the likely progression of SPA under the proposed formula;
∙ the proportion of adult life spent in receipt of State pension; and
∙ the sensitivity of the formula to:
- a cap of 33.3%; and
- the projections of future longevity.
We also highlight some of the other simplifications inherent in the formula.
This section considers the effect of the formula alone and does not allow for any impact of other factors, which the Secretary of State may require to be considered. These are discussed in section 7 below. We hope that by highlighting some of the key sensitivities and challenges with the formula, this will not only inform the debate surrounding the proposed approach, but also provide context to the considerations of the independent person considering the other factors (section 7). In section 8, we will return to how some of these challenges could be addressed.
6.1. The Likely Progression of SPA Under the Proposed Formula
Using the DWP formula and the ONS 2012-based principal projections suggest further accelerations to the current schedule of legislated increases to SPA. Figure 5 highlights how:
∙ the increase in SPA to 68 would be brought forward 10 years to happen between 2034 and 2036; and
∙ an increase in SPA to 69 would need to occur between 2047 and 2049.
State Pension Age (SPA) under current legislation and the Department for Work and Pensions (DWP) formula Source: Own calculations using ONS 2012-based principal projections (UK)
In generating the analysis above, we have needed to make a number of assumptions. Specifically:
∙ The outcome of the Secretary of State’s first review of the SPA will be published in early 2017.
∙ In order that individuals get at least 10 years’ notice of any change in SPA, this suggests the first changes will take effect no earlier than 2027/2028. Given the existing plans to increase SPA to 67 between 2026 and 2028, we have therefore assumed that the review will inform SPA changes occurring from 2029 onwards.
∙ Any changes to SPA will be phased in over a 2-year period, ending at the point at which the new SPA needs to come into effect in order for the proportion of adult life spent in receipt of State pension to remain below 33.3%.
∙ The population numbers used in the numerator of the DWP formula are the projected mix of men and women at the relevant SPA.
∙ SPA would be allowed to be reduced where this would not cause the proportion of adult life spent post-SPA to exceed 33.3%.
These assumptions are used throughout the analysis presented in this section.
6.2. Proportion of Adult Life Spent in Receipt of the State Pension
The formulaic approach is designed such that SPA rises to avoid the proportion of adult life spent in receipt of State pension reaching 33.3% (to nearest 0.1%).
In Figure 6, the lines represent the progression of SPA and the bars represent the proportion of adult life spent after SPA. The grey lines/bars show the values under the currently legislated increases to SPA and the blue lines/bars show how this would change under the DWP formula. As can be seen, the 33.3% of adult life (red line) acts as a cap to the blue bars.
SPA and proportion of adult life spent post-SPA Source: Own calculations using ONS 2012-based principal projections (UK). SPA, State Pension Age; DWP, Department for Work and Pensions.
Note that in Figure 6, the SPA and proportions of adult life spent post-SPA are (for simplicity) based upon the SPA for men for the period up to 2020. The actual expected proportions for this period would be higher if gender-specific SPAs were allowed for.
Figure 6 also highlights how:
∙ the proportion of adult life spent in receipt of State pension under current legislation, will at times exceed 33.3%, ranging from 32.5% to 34.3% and averaging around 33.4%;
∙ the proportion of adult life spent in receipt of State pension if SPA changes in line with the formula is expected to be less than 33.3%, ranging from around 32% to 33.1%, averaging at 32.5%; and
∙ the long-term “cap” is broadly at the average level anticipated under the current schedule for SPA increase, that is, were the Government to legislate for 33.3% to apply as an average value rather than a cap, then limited, if any changes to existing plans for SPA progression would be needed.
6.3. Sensitivities of Formula
6.3.1. Sensitivity to a cap of 33.3%
Figure 6 shows that using the central ONS projections and the current male SPA of 65, at the moment, the expected proportion of adult life spent post-SPA is approximately one-third; however, we are unaware of the underlying rationale for the choice of one-third as the long-term objective for that proportion.
We can see from Figure 7 that the progression of SPA is very sensitive to this choice. For example:
∙ a modest reduction in the cap to 31% would result in a much faster increase in SPA, with SPA rapidly rising to 69 between 2024 and 2032 before reaching 70 in 2039 and 71 in 2052; and
∙ a modest increase in the cap to 35% would enable the rise in SPA to 67 to be delayed until 2039, and the rise to 68 to be delayed until 2053.
DWP formula SPA for different target proportions Source: Own calculations using ONS 2012-based principal projections (UK). SPA, State Pension Age; DWP, Department for Work and Pensions.
From this work, we see that small changes in the 33.3% target for the proportion of adult life spent post-SPA would result in very different rates of increase in the SPA. We believe that the rationale for the choice of “one-third” should be explained more fully.
Some responses to our small survey of pension actuaries indicated that some people felt that the proportion could be reduced to as far as 25%. Our work shows that this would require a large immediate increase in SPA. Simple calculations show that if 67 is the correct SPA for 33.3% in, say, 2030, life expectancy for the 67-year old then is survival to around 90. Moving to 25% would, therefore, imply an SPA of around 73 in 2030.
6.3.2. Sensitivity to longevity projections
In creating a formulaic link between life expectancy and SPA, the Government has to choose how to measure life expectancy. In particular, the Government Actuary has to choose which mortality table and projections to use.
The DWP proposal is that the Government Actuary would use the most recently produced ONS principal projections of cohort life expectancy. These are published by the ONS every 2 years.
We agree that the continued use of the most recently available data by using statistics published every 2 years appears reasonable. The data covers the whole of the UK population, but sub-divisions are also available.
We also agree that the use of cohort life expectancy projections appears most suitable as these project the future probabilities of death taking account of the individual’s year of birth; that is, the projected probability of death for someone attaining age, say, 70, in 2030 may be marginally different from the probabilities for those attaining 70 in 2029 or 2031. This also recognises that the profile of deaths at different ages in each future year may not exhibit the same shape as the profile in the most recent period of investigation.
However, it is important to note that any projections of life expectancy rely upon assumptions about how mortality will change in the future. Such assumptions are inherently subjective – future average changes in mortality cannot be predicted with any degree of certainty.
Most projections of future mortality consider the improvements that have been revealed by successive recent investigations and assume that something similar to these rates of improvement may continue in the short term. They also typically assume that the recent high rates of improvement may tail off at higher ages and in the more distant future. The use of cohort life expectancy projections substantially increases the importance of the long-term rate of improvement that is assumed.
The subjective nature of the projection methods means that other projections of longevity could turn out to have been more accurate than the one chosen. It is therefore necessary to consider the range of life expectancies that could emerge from differing projections.
The ONS has published higher and lower projections of life expectancies as well as the principal projections, which the DWP propose should be used. Figure 8 shows how use of these alternative projected expectancies would impact the SPA emerging from the formula.
DWP formula SPA for different longevity projections Source: Own calculations using ONS 2012-based projections (UK). SPA, State Pension Age; DWP, Department for Work and Pensions.
We can see how to maintain the 33.3% proportion, under the:
∙ ONS low life expectancy projections – SPA would not need to be higher than 65; and
∙ ONS high life expectancy projections – increases to 70 would need to be accelerated and SPA would increase by 1 year roughly every 6 years after 2034.
This shows that the choice of projections makes a big difference in the results from the formula. The uncertainty about the accuracy of the projections means that there could clearly be material adjustments in projected SPA at successive reviews, as updated information on the actual rates of mortality being experienced becomes available.
6.4. Back-Testing
We can also look at model risk from the perspective of back-testing the formula against a series of historical changes in Continuous Mortality Investigation longevity projections from 1980 onwards. Figure 9 considers how the SPA would have changed under the DWP formula approach over the period since 1980 if it had followed the commonly used actuarial projections of the day.
SPA changes if DWP formula had been implemented in 1980 SPA, State Pension Age; DWP, Department for Work and Pensions, CMI, Continuous Mortality Investigation.
In producing Figure 9, we have assumed the cap would have been set at 28% rather than 33.3%, reflecting the then anticipated proportion of adult life spent post-SPA. For simplicity, we have also assumed the population is split 49% men/51% women (consistent with prevailing values at age 65) for generating the unisex life expectancy required in the numerator of the DWP formula, and assumed that the periodic reviews were coincident with publications of the relevant actuarial projections. We have also used lives-based mortality tables (PxL80/PxL92) throughout.
We can see how:
∙ Those reaching SPA in the early part of the current decade would have had a series of very rapid increases in SPA (4-year increase in SPA in just 3 calendar years). This generation, in particular, would have been impacted by changes published in quick succession (92 series in 1998 and medium-cohort projections in 2002) as emerging longevity trends became apparent and actuarial views on future trends changed.
∙ Younger generations (i.e. those born from 1970s onwards) would have been informed of successive, material upwards revision of SPA. If a similar scenario were to arise in the future, care would be needed to manage the communication of changes to avoid a lack of confidence in the State pension system.
6.5. Other Simplifications of the Formula
The formula includes a number of other simplifications, which users should be aware of:
∙ It does not take into account the diversity in life expectancy outcomes for different parts of society.
∙ It focuses on total life expectancy – attention could be given to HLE. HLE has been increasing more slowly than total life expectancy (around 0.8-year increase in HLE for every year of increase in period life expectancy at birth). Section 7.1 considers this in more detail.
∙ Adult life starts at 20 under the formula. This has the merit of simplicity. Perhaps more meaningful would be to consider the typical age at which the generation approaching SPA entered the workforce, reflecting the changes in accessibility of higher education across generations. Increasing the starting age brings forward the dates at which increases in SPA are required. Looking at it simply, a 3-year increase in starting age would reduce “adult” life by 3 years, and would require a 1 year higher SPA. (For simplicity, this argument ignores the effect on life expectancy of survival during the year of SPA.)
∙ It assumes survivorship to SPA; therefore, it considers the proportion of adult life spent after SPA conditional on having reached SPA. This raises two issues:
- it considers the time in receipt of pension for those attaining SPA, but does not consider those dying before SPA, who have paid contributions for little benefit; and
- the SPA formula itself does not consider what proportion of adults is being projected to attain SPA, so what the expected costs are, or whether those are sustainable.
These simplifications underlie many of the “other factors” that the independent person appointed by the Secretary of State may well be asked to consider.
6.6. Summary of this Section
The observations in this section demonstrate why the results of applying the formula should only be part of the information that is used in deciding upon future changes in SPA. The automatic adoption of the formula’s results to require a change in SPA would appear to be inappropriate. Detailed consideration of the variability in the possible results needs to be considered together with the advice on the other factors to be specified by the Secretary of State.
The choices of 33.3% for the proportion of adult life spent post-SPA, and of 20 as the starting age for adult life, need to be explained and used consistently, as any change in these parameters over time would have a material immediate impact on the formula results.
7. Other Factors
We note in section 5 that the Secretary of State is to commission an independent person to produce a report on other factors that may influence the decision on SPA. The Secretary of State specifies the factors that the person will consider. In this section, we discuss some factors which should be considered.
We believe that the independent person would need to set up a panel of experts to consider these factors. We have assumed that the proposed DWP formula will remain as set out in the Autumn Statement (DWP, 2013).
The factors to be considered fall into three main groups:
∙ healthy life and ability to work;
∙ variations in projected lifetimes; and
∙ financial considerations.
The Government has indicated that it expects the HLE and differences between socio-economic groups will form part of the review.
7.1. Healthy Life and Ability to Work
7.1.1. Quality of life in receipt of state pension
There are two measures that the ONS produce, which could be used to measure the changes in levels of health over time: HLE and disability-free life expectancy (DFLE). These estimates add a “quality of life” dimension to life expectancy by dividing expected lifespan into time spent in given states of health.
The statistics underlying HLE and DFLE are based on the individual’s self-assessed state of general health given in the Annual Population Survey of private households. These are subjective measures of HLE and DFLE and may therefore be viewed with some scepticism. We note that there have been historical changes in the wording of the survey questions and methodology. The subjectivity and methodology lead to some concerns over the reliability of the statistics.
DFLE is an estimate of the average number of years a person would live without a limiting long-standing illness or disability. The questions asked about this in the survey are based on a number of criteria included in the Disability Discrimination Acts, 1995 and 2005. Although the results are still subjective, the questionnaire is a lot more detailed and therefore there would be less variation of interpretation compared with the HLE measure.
Over the last 10 years, however, there has been a reasonably consistent gap between full life expectancy and HLE (see Figure 10) using period mortality projections of life expectancy. Many observers therefore believe that these are sufficiently good measures to use as a high-level indication of health by age, region and socio-economic class. They are also seen as useful in showing trends in HLE over time.
At birth life expectancy and healthy life expectancy for men Data source: ONS data; UK life expectancy and healthy life expectancy at birth by age and sex, own graphic
It appears that recently HLE (at birth) has increased on average by around 0.8 of a year for each year of increase in life expectancy in the recent data.
The panel should consider whether the gap between life expectancy and HLE is remaining consistent.
Increased longevity may be a reason to increase retirement age, but whether there is a corresponding increase in the ability to work at higher ages should also be considered. Workgroups such as firefighters and paramedics have highlighted this issue and are campaigning against increases in their retirement age on the grounds that they are less able to meet the demands of their job at higher ages.
The extent to which HLE increases with life expectancy is therefore a major factor for the panel to take into account. United Kingdom’s current spend on health-related benefits is £110 million a year (Her Majesty’s Treasury, 2014). The panel should consider whether the expenditure would increase if people are compelled to work to a later age.
The panel should consider the differences between the results of these measures and the full life expectancy, together with the extent to which they could be taken into account when setting the SPA.
7.1.2. Projections of involvement in the workforce at higher ages
Increasing SPA will mean that an increasing number of older people will be looking for work. The panel will need to consider the ease of retaining jobs at older ages, and the ease of getting jobs.
Unemployment rates amongst those who are economically active tend to be marginally lower for those who are aged 50+ compared with 25–49-year-olds. For example, unemployment of the economically active 50+ population was 4.0% in the quarter to April 2014, which was 1.0% lower than unemployment for economically active 25–49-year-olds. This masks the fact, however, that at present many of those over 50 may choose not to be economically active and that the definition of economically active excludes those whose main reason for not seeking work was because they believed there were no jobs available (ONS, 2014).
Out of work older people can find it more difficult to get a job than younger people. For example, in the quarter to April 2014, 47.7% of the unemployed aged 50+ had been unemployed for 12 months or more compared with around 39.7% of those unemployed aged 25–49 (ONS, 2014).
With SPA rising, consideration will need to be given to the unemployment levels at older ages. The Government has committed to publishing labour market data on an annual basis to show how the position of older workers in the UK economy is changing. These will need to be monitored.
The panel will need to consider whether increasing the SPA would mean older working-aged people tending to live in poverty and relying on jobseekers’ allowance and other benefits before their State pension begins to be paid.
In addition, it is noted that certain types of employment are less easy for older people to undertake. Any available statistics from the employment market showing trends in availability of various job types could be investigated. The levels of success of initiatives on retraining older workers for changes in work type should be monitored.
7.1.3. Unpaid work in older age
Many retired people take on unpaid work in older age. This includes volunteering for organisations, taking care of grandchildren or taking care of elderly parents. This unpaid work has many social and economic benefits.
The extent to which people working longer could affect the number of people willing or able to carry out these jobs should be considered, as the burden may fall on the State (e.g. in the form of childcare vouchers or increased costs of long-term care) if there are fewer people doing them.
The amount of care the elderly needed could also be exacerbated by people working longer. The number of retired people who are caring for a loved one has risen by a third over the last decade, according to latest census figures, to 1.3 million (Carers UK, 2014). If people who might otherwise do this have to continue working, it may fall upon the State to provide care instead.
7.2. Variations in Projected Lifetimes
Variations in longevity arise from a number of causes including the following.
7.2.1. Variations by region or socio-economic grouping
Mortality investigations have shown wide variations in mortality, and hence life expectancy, by different geographical area in the United Kingdom, and also by different socio-economic grouping. To these can also be added variation by occupation. To a great extent, these factors may all be proxies for an underlying mortality factor that could be termed an individual’s lifestyle. There is significant correlation between these factors.
There is a significant gap between the lowest life expectancy in the United Kingdom and the highest life expectancy in the United Kingdom. The ILC-UK have published a paper (ILC-UK, 2014), which suggests that forcing those with low life expectancy to work longer will make this gap larger, and will increase inequality in the workforce.
Figure 11 shows the life expectancy (determined on a “period” basis) by socio-economic class for males at birth, produced by the ONS: during the 20-year period of the data underlying Figure 11, there have been improvements in life expectancies for all socio-economic classes, and there has been a small increase (about 1 year) in the gap between the highest and lowest life expectancies.
Male life expectancy for England and Wales by socio-economic class Source: ONS data; trends in life expectancy by NS SEC 1982–2006, own graphic
There are also sharp inequalities in life expectancy and HLE by region. For example, Figure 12 shows that in London alone there is a 15-year gap in HLE at birth (determined on a “period” basis) between Boroughs.
At birth male healthy life expectancy by London Boroughs Source: ONS data (healthy life expectancy for males at birth by upper-tier local authority in England, 2009–2011), own graphic
These differences by region and class could be expected to be highly significant for SPA, as any change in SPA affects different groups disproportionately. Although the overall expectation under the Government’s proposed approach might be that the average person spends just under one-third of their adult lifetime receiving State pension, this masks the fact that some groups will probably experience materially different average outcomes.
It is also noted that the groupings with the lower life expectancies tend to be the groupings with lower incomes/savings and who therefore have lower non-State pension arrangements. These are exactly the people most likely to be most dependent upon the State pension and those most critically affected by SPA changes.
There are also variations in life expectancy by gender. As the United Kingdom is still going through the process of equalising SPA by gender, it seems unlikely that anyone would suggest reverting to gender-dependent SPAs.
It should be noted that there is correlation between socio-economic class, region, HLE and DFLE, in that those in regions having lower life expectancy may have very short periods of HLE after passing SPA. The panel should be requested to comment on whether an average member of the population in any particular grouping is expected to have little or no HLE after SPA.
The panel should outline possible mitigation strategies for the differing impacts of SPA changes on different groups.
7.2.2. Differences in life expectancy arising from projection uncertainty
In addition to the well-recognised differences covered above, the panel should consider the inherent uncertainty in projecting future mortality and life expectancy.
The Government Actuary’s Department should provide some commentary on variations in its projections when it provides its own report to the Secretary of State. The panel should, however, consider whether any other analysis is desirable to inform the sensitivity of indicated future progress of SPA to the probable inaccuracies of the projected life expectancies.
Our own work detailed in section 6 shows how significantly the Government Actuary’s conclusions could be affected by projection differences.
The panel should be requested to comment on the impact of projections assuming more favourable, and less favourable, rates of improvement in the national mortality experience. To the extent possible they might also link these with the issues covered in the section above – that is, do the more/less favourable projections affect the different socio-economic groups or health aspects to different extents.
7.2.3. Medical advances and health practices
The panel should also take into account health statistics, medical sources and any other relevant areas that might throw light on developments which could affect the assumptions underlying the projections of future life expectancy adopted by the Government Actuary.
7.3. Financial Considerations
7.3.1. Old-age dependency ratio
Part of the motivation for changing the SPA was because the old-age dependency ratio meant that pension payments funded through current taxes were expected to become unsustainable. Projections have been carried out by the ONS on the old-age dependency ratio without changing the SPA compared with the ratio if the SPA is changed. With the proposed SPA changes, the old-age dependency ratio is expected to remain broadly in level in the short to medium term (see Figure 3).
The panel should monitor the progress of future projections of the old-age dependency ratio to establish whether this remains as desired by the Government. If the old-age dependency ratio begins to drop, there could be an argument to slow down the rate at which SPA is increasing. On the other hand, if the old-age dependency ratio continues to climb, the panel should alert the Government that SPA (or something else) will need to change.
7.3.2. Projections of State pension expenditure as a percentage of GDP
Part of the reason the changes in SPA are being proposed is because it was thought that expenditure on public pensions would become unsustainable.
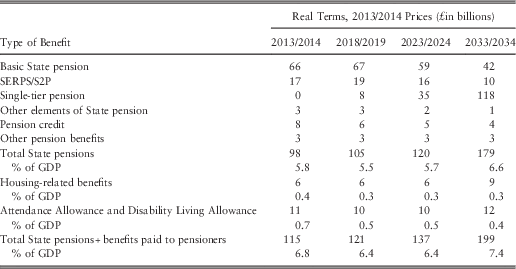
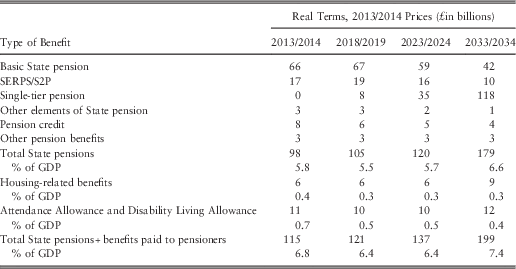
Table 1 shows official Government projections of expenditure on State pensions and other pensioner benefits over the next 20 years, based on the new system, including reforms to the BSP, as we move towards the single-tier pension under current proposals.
Projected costs of pension benefits
Source: Table LT1 of DWP (2014b).
SERPS, State Earnings-Related Pension Scheme; S2P, State Second Pension; GDP, gross domestic product.
The panel should consider and comment upon future updated projections of costs of pension and related benefits. In particular, the panel should be asked to look for any evidence of costs being transferred from pensions to other State benefits owing to SPA increases.
7.3.3. Projected levels of non-State pension coming into force at future dates
Many public sector pension schemes now link the schemes’ normal retirement ages to SPA and changes in SPA will therefore result in increasing those public sector scheme retirement ages.
Future changes in SPA are expected to be less important for the sponsors and trustees of private sector occupational schemes. This is because there are a decreasing number of private sector occupational DB schemes that are still open to accrual of further benefits, and the fact that in most such DB schemes it is not possible retrospectively to change the expected retirement date of accrued rights.
There is, however, an indirect impact in that increasing SPAs may mean that members of private sector schemes are either more likely to defer retirement to their new SPA, or may use their occupational pension benefits to enable retirement before the higher SPA. We do not think it likely that these actions would cause material problems for the schemes or the State.
With the introduction of auto-enrolment, which began to be phased in from 2012, and the flexible retirement options, which were announced in the 2014 Budget, the impact of the SPA on people with DC pots may also decrease. As the DC pots of people become larger, they may use these to enable themselves to cope with SPA changes.
The effects of these points will emerge in the statistics covering rates of working at ages around SPA and these statistics should be monitored over time.
The demographic of people who are reliant on the State pension may well increasingly shift to lower earners who will have little alternative pension savings, and this should be taken into account by the panel when making recommendations.
8. Alternatives or Variations
We have seen, in the sections above, that the Government’s chosen response to the anticipated problems associated with maintaining the existent State pension regime has been to:
∙ introduce a single-tier pension for all pensioners;
∙ retain a single age from which the State pension is payable; and
∙ set future SPA with regard to projected life expectancies, which is expected to result in SPA increasing over time.
These choices have been made with the aims of achieving simplicity (single-tier pension, single SPA) and affordability/sustainability (increasing SPA with life expectancy). An additional aim of reducing means-tested additional benefits to pensioners has been met by the choice of the level of single-tier pension. It could also be noted that rising SPA may be seen as a way of the Government encouraging an increased proportion of older age workers to remain in active employment.
Rising SPA, either now or in the future, is only one approach the Government could have taken to manage the higher expected future costs of pension and other benefits and the need to encourage people to work longer. We have noted that many commentators have highlighted perceived areas of unfairness in expected increases to one universal SPA. The Secretary of State is likely to require commentary on these areas when considering whether SPA should be changed during the regular reviews that are proposed.
The United Kingdom is not alone in facing issues of sustainability and inter-generational fairness in the funding of expected future State pensions. Many other countries are also making changes to their pension regimes to counter this.
In its survey of pensions (OECD, 2013a), the OECD noted that during the last decade most of the 34 OECD countries have passed legislation that raises either the retirement age or the contribution requirements for the full State pension entitlement to be paid. It notes that in many countries the retirement age is rising to 67, or above, albeit that in most of these the transition progress will not be completed until the 2020 or later.
In particular, the OECD note that Denmark, Greece, Hungary, Italy, Korea and Turkey have opted to link future increases in pension age to changes in life expectancy. Some other countries (e.g. Norway, Finland and Sweden) have systems that vary the pension amount at retirement in some way by a factor dependent upon life expectancy. All references in this section of our report to actions taken in other countries are given by reference to this OECD paper (OECD, 2013a).
In this section, we will consider some possible changes to the UK State pension regime, which could be alternatives to, or complementary variations with, future changes in SPA. Our objective has not been to examine these in great detail, given:
∙ the impression of broad political consensus around the revised State pension regime;
∙ the probable time frame for future reviews of that regime; and
∙ as any decision to adopt one, or more, of these variations would require significant investigation, consultation and additional work at a future date, at which time the factors requiring consideration and imperatives for any decision, might be quite different from those applicable now.
The potential changes we have looked at could be investigated further in due course. We have attempted to group similar aspects together. It should be noted that some combinations of these potential changes could also be used together. The potential range of alternatives or combinations of such is very large. We do not claim that the list of variations we have covered is complete. We have noted the following broad groups:
∙ variable SPAs;
∙ variable pension levels;
∙ finding additional financing;
∙ complete change of format; and
∙ reduce reliance on State pension.
8.1. Variable SPAs
The United Kingdom has so far applied one SPA (apart from the gender differential currently being removed) for all old-age pensions. This is despite the well-documented differences in life expectancies by region, occupation, social class, etc. The differences in life expectancies mean that maintaining one SPA for all results in different groups being affected to markedly different extents by changes in the SPA.
It is undoubtedly true that the differences in life expectancies were less well understood in the slightly more distant past. It is also the case that, at their outset, the State pension and also the NHS were seen as akin to an insurance benefit being paid. Indeed, the additional taxation income originally hypothecated to fund the State pension, NHS and related welfare benefits is still referred to as the NI contribution.
A feature of insurance benefits is that there will typically be those who benefit more and less. Nevertheless, there may be ways in which there could be flexibility in SPA or SPAs that differ between groups such that the disproportionate effects of SPA changes could be made more equal or less onerous.
8.1.1. SPA window
A number of commentators (e.g. PricewaterhouseCoopers LLP, 2014) have suggested that people should be able to select the age from which their State pension starts within a defined window of ages. This adds a degree of flexibility which many see as desirable.
To some extent this situation already exists, as it is possible to defer commencement of the State pension, although it is currently not possible to start payment before SPA.
In essence, this suggestion envisages retaining a lower age, say 65, from which people can request their pension to start, and an upper age, say 70, by which the State pension must start. Within this range, there would be a pivotal age from which the pension amount is adjusted for earlier or later commencement. The pivotal age would be assumed to increase over time with life expectancies. The adjustment factors would probably also be varied over time with financial and life expectation changes. However, once established at commencement, the pension amount for any individual would just increase thereafter in line with the usual rules at the relevant times.
When the pivotal SPA is deemed to need adjustment, people could elect to retain the previously anticipated retirement age, but have a reduced pension, or to have their anticipated SPA increased, but retaining the previously expected pension level.
The flexibility could be seen as allowing those with worse life expectancies, or worse health, to retire earlier whilst still receiving a reasonable, but reduced, State pension instead of having to work on in adverse circumstances.
This variation would not introduce material additional complexity since, in effect, it already exists. We also believe that it may not materially reduce sustainability or fairness, dependent upon how the adjustment factors are set. To the extent that people who retire before what would otherwise be the SPA cease to pay NI contributions, there may be an earlier small reduction in State income, which might need to be reflected in the adjustment terms.
One drawback for the Government is that it marginally reduces the predictability of when State pensions start and this may be particularly relevant in periods of economic depression if higher age unemployment rises. In such circumstances, State pension outgo may be increased by people retiring earlier at a time when taxation income including NI contributions is decreased.
To some extent, however, this may also be transferring State benefits from unemployment/job seeking, etc. to pensions. Pension is generally more generous than the other State benefits, so this could still advance State expenditure.
Some OECD countries (e.g. Denmark) are moving away from allowing early retirement of State pension in an effort to encourage older age working and contain costs. Many countries (Ireland, Israel, New Zealand, Russian Federation and South Africa), like the United Kingdom, do not allow the taking of State pension before their nominal SPA.
8.1.2. Different SPA by region/occupation/earnings levels
A more direct reflection of differences in life expectancies would be achieved by linking SPA to one of these factors: region of work/living, occupation type or broad level of earnings. This is seen to address the inequalities, whereby increasing one universal SPA disproportionately affects those with lower predicted life expectancy.
This approach potentially most closely links the (average) period of adult life spent in receipt of pension with the life expectancy of the underlying population group. Continuing the insurance analogy, this suggestion is akin to rating car, or house, insurance by location or value.
There are clearly difficulties with this suggestion, however, as during their working lifetime a large proportion of the population are quite likely to move region, change occupation, get promotions to higher paid jobs and/or experience other changes that complicate the situation. It is also the case that some pensioners move after retiring, perhaps selecting a more clement region with a higher life expectancy.
Finally, of course, whereas there are differences between the average life expectancies by region, occupation, social class, etc., it is also true that the different lifetimes actually experienced within each of these factors varies considerably more than the differences between the averages.
The question therefore arises of how such changes would impact on the individual’s SPA. If a person has periods of employment ranking for two different SPAs, would they be able to request some pension to start from the earlier age, and also to defer the earlier pension to the later age? Would they also be able to request the later starting pension to be paid earlier? Alternatively, some form of career averaging process (either on the factors such as earnings used to set SPA or the implied SPAs) could be applied as suggested in a study by Harper et al. (Reference Harper, Howse and Baxter2011).
Creating a system to incorporate variable SPAs would require great care and for many of the potential rating factors (e.g. postcode-based SPAs) it is difficult to see a workable mechanism. This option introduces significant additional complexity going against the prevailing desire to make pensions simple to understand and to provide certainty on an individual’s SPA. It would make retirement planning more complicated, especially if the changes in expected SPA occur later in life. It could also lead to the potential for selection against the State.
8.1.3. Different SPA based on years of active work
This option is predicated on the fact that most individuals who do not enter higher education commence work at an earlier age than those who do. Under the single SPA system, they therefore contribute for several more years towards their State pensions than those who go to university, etc.
There is potentially also a link to the section above, as there is a greater proportion of manual workers in the group who do not enter higher education. Such workers have historically exhibited lower life expectancies than white-collar workers. This may therefore be a proxy method of achieving some differentiation by the factors noted in section 8.1.2 above.
One suggestion could be that working lifetime should be expected to last, say, 47 years. Those entering work at 18 would therefore have an SPA of 65, whereas those entering work at 22 after completing a degree would have an SPA of 69. Those completing very long courses, sandwich courses, day release study or courses at a mature age would create complications that any system would need to handle.
At present, eligibility for the full single-tier pension is expected to require a 35-year contribution record (increased from 30 by the Pensions Act 2014). Another suggestion of this type could then suggest that SPA would be achieved on completing, say, 45 years of contributions, with a minimum age of, say, 65, and an upper age of, say, 70.
Any system adopting this sort of approach would need to specify clearly how breaks in employment for various different reasons are handled.
Many countries have been increasing the number of years of work or residence needed to qualify for the full pension. France has adopted a variation of this system. Originally, the French system required 40 years’ employment and had a minimum retirement age of 60. Pension was available in any case at age 65. France is increasing the 40-year requirement to 41.5 and rising the ages 60 and 65 to 62 and 67, respectively.
8.2. Variable Pension Amounts
The Government’s proposal for a single-tier pension at a level which is expected to remove the need for payment of the current means-tested “pension credit” has been chosen to bring simplicity.
Several commentators suggest, however, that it may still fail to provide adequately for some of the poorest pensioners, while providing additional income that is “unnecessary” for the wealthiest pensioners.
It could also be criticised for unfairness in that it does not reflect the amounts contributed by way of NI contributions in respect of the individual’s earnings.
The options in this sub-section are mostly methods of managing down the amounts of State pension being paid and, therefore, the overall cost. To the extent that they are successful, they could also result in more poor pensioners who might then be reliant on other, possibly means-tested, State benefits. The lower cost of the State pension could help pay for higher means-tested benefits.
8.2.1. Adjust pension amount for region/occupation/earnings levels
This is a variation of the argument in section 8.1.2 above, and is proposed for the same reasons. Instead of changing the SPA, however, it is the pension amount that is varied in order to contain costs.
In some ways, this alternative may be easier to administer than having the varying SPAs proposed under section 8.1.2; however, it still introduces added complexity to the pension calculation and planning processes. The level of State pension payable to an individual might then be some form of working life average such as the sum of the proportions of the different pension amounts based on the proportion of working life (or working lifetime earnings) in each category.
This variant could appear penal for some, in that higher paid workers, having better life expectancy and hence presumably a lower pension, may be seen to be contributing more yet be getting smaller annual pension amounts.
8.2.2. Re-introduce some level of means-testing
It should be noted that the OECD paper shows that the majority of OECD countries retain some form of means-tested benefit for the poorest in the population. Under this option, the United Kingdom will still be providing means-tested additional benefits to the poorest groups; it is the extent of the principal State pension that we are considering here.
It is important to note that there are (at least) two sorts of means-testing – in one the test is whether income/assets is/are sufficient and, if not, to provide top-up payments; in the other the benefit is provided to all, but then is systematically removed from those who have above a certain level of income/assets.
Up to now, means-testing of pension-related benefits has mostly been of the first type noted in the paragraph above. It has been perceived to be ineffective because not all who should claim do and because it is costly to administer (as evidenced by DWP (2012) and NAO (2011), respectively).
Means-testing has also been seen as creating a disincentive to lower levels of pension saving in private/occupational arrangements because additional saving just result in loss of means-tested benefit. Means-testing may also be susceptible to manipulation, for example, people passing on assets to children in order to qualify.
Means-testing of the second sort is essentially an additional tax on wealthier pensioners and may be regarded as a method of increasing taxation income to support pension costs. It is a taxation increase, however, which affects those already receiving the pension and so does not create the inter-generational issues that are usually associated with funding pension outgo. Of course, the UK general taxation system is somewhat progressive and so does effectively result in more of the State pension being taxed for wealthier pensioners. This form of means-testing avoids issues of those most in need of the additional income failing to claim it.
Depending on the method of means-testing adopted, this suggestion clearly reverses the Government’s stated objective of reducing means-testing. Although this option may allow future pension outgo to be more closely targeted to those in the greatest need, and thereby may help contain future costs and aid sustainability, it may also materially increase complexity, complicate retirement planning and deter low-level individual pension savings.
8.2.3. Adjust single-tier amount
Although not necessarily moving away from having one universal pension level, it could be possible in the future to adjust the pension amount from time to time rather than continually changing SPA.
For example, as individual pension savings under workplace-based pensions (NEST, etc.) become larger and may be assumed to provide greater levels of retirement income, it could become feasible to choose to reduce the single-tier pension level for future retirees instead of increasing the age from which it is received.
Alternatively, the rates of adjustment for incomplete NI contribution records could be changed to control costs or encourage remaining in work. Another option might be to increase over time the number of years of contribution record required for a full pension.
A further option could be for the pension amount of each pensioner to be determined by reference to some sort of points system. An example might be to award different numbers of points for years of work undertaken in different types of work/earnings, etc. and base the amount of pension on the aggregate points earned over the working life. Like variable SPAs, this goes against the prevailing desire for simplicity.
Finally, the OECD notes that many countries are taking actions that limit/reduce the rates of increase of State pensions during payment. In the United Kingdom, this would call into question the “triple lock” currently granted to State pension.
8.3. Finding Other Income to Meet Projected Pension Costs
Detailed aspects of financing State pensions are outside of our scope. We do, however, note that the Government’s reasoning for increasing SPA is largely derived from the arguments around sustainability and inter-generational fairness.
We have already noted that increasing in some way the taxation borne by current pensioners could be seen as a way of raising additional funds to help pay for pension outgo, while not generating significant additional inter-generational unfairness. It is likely that any such additional pensioner taxation would have to be progressive to avoid problems of pensioner poverty.
There are a number of ways this could be achieved, although it is acknowledged that doing so could be a difficult political message. Thoughts that have occurred to us include:
∙ There are a number of universal additional pensioner benefits (winter fuel, TV licence) that could effectively be made means-tested. This could be achieved whilst still paying the benefits to all pensioners, for example, by reducing the individual’s basic tax rate allowance band by a suitable amount such that the benefit is substantially reclaimed from higher income pensioners.
∙ NI contributions currently cease when an individual passes SPA, even though NI was originally hypothecated to fund both State pensions and the NHS, whereas a significant part of NHS costs arise from care for the elderly. Some adjustments to NI contribution rules could be constructed (e.g. a low rate of NI paid above a reasonably high threshold by people over SPA) that result in increased Government income from people over SPA. This additional income might allow SPA not to increase as much, or as quickly.
Clearly, other changes to taxation to help meet increased pension costs are possible that could reduce the need to increase SPA as much or as frequently.
8.4. Complete Change in Format of State Pension
The alternatives considered in the paragraphs above are predicated on maintaining the UK State pension regime in broadly its current format. Clearly, more fundamental changes could be considered, some of which may have features that attempt to automatically adjust for increasing longevity.
The most significant alternative would be to calculate an individual’s State pension based on some form of DC notional fund accumulation. This could possibly be linked to their NI contribution record. The accumulated fund would be converted to a pension amount at the time State pension commences by factors that depend upon the selected retirement date, expected future economic conditions and then current life expectancies (which may be adjusted for region, social class, etc.).
This sort of approach is used in the latest State systems of Italy, Poland and Sweden.
Criticisms of these systems include that they produce higher pensions for those who have been higher paid, and are therefore less “progressive”. They may therefore require additional (means-tested) benefits, or additional notional contributions, for the lower paid to reduce poverty levels.
Any move to such a radically different system would require a significant change over a period and would generate significant complexity for the population during the change period.
8.5. Reduce Dependence on State Pension
Some Government actions are possible to reduce the detrimental effects of increasing SPA, if such increases are to occur. If these actions are successful, they may help reduce the rate of payment of other non-pension State benefits before SPA or allow more people to defer commencing their State pensions.
These actions could include workplace initiatives to encourage continued working at older ages or the accumulation of sufficient pension savings, such as follows:
∙ increasing the legal minimum early retirement age, making it harder to retire as early from individual pension savings;
∙ change the availability of various other State benefits that may be seen as alternatives to pension just before SPA;
∙ use elements of the taxation system to reduce the costs of employment for older workers, or offer incentives for employment of older workers;
∙ use various incentives (such as tax reliefs) to encourage greater personal additional pension savings so that the State pension is a smaller proportion of overall retirement income; and
∙ require greater personal pension saving – increase minimum auto-enrolment contribution rates or make pension saving compulsory.
These initiatives do not directly affect State pension costs or State income to meet those costs. They are aimed at changing population behaviours in ways that will enable less reliance on State pension around SPA. They thus hope to defer some State pension costs and make the State pension less material for the individuals, thus making the increase in SPA less of an issue.
We believe that such initiatives are likely to have most impact on healthy employees in active employment/activity. They potentially suffer from not helping those most in need of State support, although by reducing spending on the State pension they may free up funds to pay for additional means-tested benefits.
It is notable that the flexibilities now available for the usage of DC pension pots in the United Kingdom may allow some workers to effectively take a bridging income between a chosen earlier retirement age and SPA. The flexibilities may therefore act against the objective of increased old age working. They may also, however, reduce claims for other State benefits. We will have to wait to see how these flexibilities are used in practice.
An extreme version of reducing reliance on State pension is to make an adequate level of personal pension saving compulsory and then cease old age pension completely, apart from some level of means-tested minimum poverty prevention benefit. This is the route taken in Australia.
It is not clear how there could be a rapid transition to the scenario of the paragraph above in the United Kingdom, given the numbers of pensioners with expectations of significant State pensions. Presumably, this could be moved to over the very long term as peoples’ savings in their auto-enrolment pensions, etc. start to have accumulated to substantial amounts.
9. Concluding Remarks
Our purpose for this paper has been to set out various facts and other data surrounding SPA. We hope this information will assist discussions within the actuarial profession on SPA and the changes now being introduced in the United Kingdom. This section summarises several key points from the paper.
We noted at the outset that SPA is one aspect amongst many that UK Governments will, from time to time, consider when establishing how future State pensions will operate. We also noted that the first UK State pensions were paid only to those in absolute need and from age 70.
The majority of this paper assumes that the Government’s State pension proposals that have come into force in April 2015 will remain in operation for the foreseeable future. We do, however, note that the pension framework in the United Kingdom has seen many changes on a frequent basis over the last 50 years or more. One observation we have, therefore, is that it seems entirely possible that the regime now being established could easily change in the medium-term future.
Although the wider decisions on other factors affecting State pension are outside of the scope of this paper, we feel that the proposed level of the flat-rate pension from 2016, in itself, may not be sufficient for many pensioners to live comfortably, so other additional sources of income or wealth will still be needed.
The level of State pension, whether it is paid to everyone and the other features of the State system inherently affect whether there is a desire to increase SPA on sustainability grounds. The fairness of increasing SPA compared with alternatives is a political and fiscal area that will see different views from different parties at different times.
9.1. Role of SPA
We observed, in our introduction, that SPA is the earliest age from which State pension will commence. We believe that this can also be interpreted as being the age up to which the Government expects people to work to provide for themselves (unless they are able to provide sufficiently from other sources of income). This interpretation highlights several points.
It links into the question of the appropriate proportion of (adult) life that should be expected to be spent in work and thereafter in receipt of State income in retirement. In the context of the Government’s proposals, this brings the question whether 33.3% is the “correct” percentage. We have seen that 33.3% is around the current average expectation on the central projections that are proposed for use. We also believe that 33.3% is expedient in that it does not require immediate large increases, which would be politically difficult to impose. A marginally higher proportion might allow SPA increases to be deferred; however, this may not achieve the desired cost savings.
This interpretation also shows the importance of other State benefits at ages just below SPA for those unable to work for whatever reason. As SPA is increased, there is likely to be some transference of State costs from pension to other benefits. The lower rate of employment at older ages thus reduces the cost saving of increasing SPA unless other initiatives enable increased older age working (OECD, 2013b). We do agree, however, that the alternative benefits pre-SPA may be needs-tested in various ways and may be lower than State pension.
This last point also links to the differences in life expectancy by region, social class or occupation. Different groups have differing expectations of being able to work at older ages, or differing expectations of being able to continue a previous type of work. We have seen that these different groups are affected to different extents by changes in one universal SPA. Is it therefore right that these groups are all expected to work to the same age?
9.2. Sensitivities Within the Proposed Model
Our work detailed in section 6 above identifies that the proposed regime is particularly sensitive to some parameters that are within the control of the Secretary of State from time to time. These are the starting age (20) from which adult life is deemed to run and the proportion (33.3%) of adult life during which it is expected that State pension would be paid.
Any changes in these would have an immediate and material impact on the conclusions of the next SPA review. We therefore believe that these parameters should be kept the same for long periods to avoid any changes in them resulting in large step changes in SPA for reasons not linked to changes in life expectancy.
In addition, we note that the projection process to be undertaken by the Government Actuary is very sensitive to the decisions on parameters that go into the projection models. Many of these parameters cannot be derived with any great reliance. It is noted that successive historical projections have typically understated longevity improvements; however, the possibility of overstatement is also significant.
It is important that successive reviews consider the potential variability in outcomes arising from different projection assumptions to inform an assessment of the certainty of the need for change.
There is clearly a possibility that the successive reports, expected at every 6 years, to the Secretary of State do not reveal a steady progression in SPAs. Some consideration may need to be given as to how step changes at successive reviews are handled.
9.3. Other Factors that May Affect the Future Shape of the Regime
The Secretary of State is also charged with specifying a range of factors about which he is to be reported to. The expectation is that the comments on these factors will influence future decisions on the appropriate SPA.
In section 7 above, we have identified a range of factors that the Secretary could require to be considered with some brief commentary on why the factors might be relevant.
We have noted the suggestion that having one SPA for the whole population coupled with a non-means-tested flat State pension could produce significant differences in the extent of receipt of State pension benefits enjoyed by different well-defined groups of the population. The question has been posed whether, in an analogy with insurance benefits, it could be possible to have some variations that reduce the anomalies.
To the extent that an increasing SPA is perceived as producing additional degrees of unfairness or difficulty for groups within the population, or politically unacceptable choices, it may be necessary in the future to consider alternatives to increasing SPAs. We have therefore also noted, in section 8, some of the possible variations in regime that could be considered at future dates. We note again, however, that we have not attempted to analyse these alternatives in great detail, as any future decision to adopt any of them would be dependent upon circumstances and criteria at that future date, which could be quite different to those ruling now.
9.4. Funding the Pensions
We have suggested that there is sometimes seen to be some inter-generational unfairness in future State pensions being paid for on a pay-as-you-go basis by future taxpayers. All pensions, however, require the future generations to provide the economic return that supports the payments made. There is only a marginal difference between a Government paying a State pension directly, and paying a coupon on Government bonds held by a pension savings vehicle. Both need the Government to raise money.
Equally, if the pension savings vehicle holds shares or stock in companies, those companies have to generate income to finance the payments, which may affect earnings levels, or price levels, or profits and taxation paid.
This raises the question whether moving from State provision to greater private pension savings will have the effect that is sometimes suggested.
The macro-economic arguments are outside of our scope. We only observe that an increasing cost of State pension as a proportion of GDP may be an incomplete indicator of the overall effects.
To the extent that pension savings are invested outside the United Kingdom, they may be able to repatriate income, which does help the net UK financing situation.
9.5. Role of Actuaries
Actuaries are well qualified to have a material role in the proposed State pension regime. We believe the actuarial profession should have a role in influencing:
∙ the Secretary of State when he specifies the values for the Government Actuary’s report and the other factors to be considered by the independently led panel;
∙ the Government Actuary when projected life expectancy is measured;
∙ the person(s) appointed to carry out the second report on that report’s content; and
∙ providing informed commentary (to the public) on the variability and uncertainty that can be seen in such projections, and the relevance of other factors.
In addition, we consider that the IFoA should undertake further research at relevant times to consider any proposals for future changes in the State pension regime that comes into force from April 2015.
This has now become a current issue as the deadline for the first report from the Secretary of State is 7 May 2017. As noted in section 5 above, influencing the Government Actuary’s report or the factors specified for the secondary report and its content will almost certainly require any comments to be made within 2015. We hope that this paper provides the foundation for a discussion within the profession to enable actuaries to participate in the wider discussions around both reports.
Acknowledgments
Our thanks to the following for their support in the writing, and all it entailed, of this report. Our employers for time out of the working day: First Actuarial, Government Actuary’s Department, Equiniti Hazell Carr, Hymans Robertson. Survey participants, giving us an insight into the ‘public’ views. Anonymous peer reviewers for their constructive criticism. Friends and colleagues off whom we bounced ideas. Tim Sharples, Pensions Board Representative tasked with steering us back on course during our many diversions.
Appendix
Summary of 120 survey responses
During July 2014, we sought responses from pension actuaries to a number of questions on SPAs. This Appendix summarises the responses received.
1. Area of activity of respondents
- 105 actuarial (presumably consultancy);
- 3 investments;
- 2 administration;
- 10 other; including one each describing themselves as accountancy, HR, EB consultancy, private consultancy, operations management, communications and 4 not stated.
2. Does SPA matter?
- 110 answered – 10 skipped it;
- Yes=93.6% (103 people);
- No=5.5% (6);
- Don’t know=0.9% (1).
48 respondents offered comments which may be summarised as follows:
- Overwhelming majority say it is relevant because SPA seen as the norm/expected retirement age or equivalent;
- May need state benefits to make retirement viable;
- Link to other state benefits, bus passes, etc.
3. Will a regularly changing SPA have an impact on schemes you advise?
- 103 answered – 17 skipped it;
- Yes=53.4%;
- No=20.4%;
- Don’t act as adviser=26.2%.
4. Have you already started to advise your clients on the plans to link SPA to life expectancy?
- 102 answered – 18 skipped it;
- Yes=31.4%;
- No=38.2%;
- N/A=30.4%.
34 respondents offered comments: these varied including – “yes have to keep clients informed”, “just initial heads up” and “No – all the DB schemes are closed to accrual” or “Not urgent yet”.
5. Current proposals – notice period of 10 years – is 10 years right?
- 99 answered – 21 skipped it;

Our comments – the majority appear content with 10 years, although a significant number want either much shorter or much longer periods.
6. Should SPA be linked and is 1/3rd right
- 89 answered – 31 skipped it.
Comments included:
- About 43 of the 89 appear to think “about” 1/3rd reasonable;
- Many seemed comfortable with the broad concept of linkage to expectancy;
- Very many expressed concerns about variations in expectancy between groups;
- Several noted that fraction would need to be kept under review and may need to change;
- Quite a few said 1/3rd is too high/generous and is unsustainable; suggesting alternative of 1/4;
- But conversely, quite a few said in long run this might mean that people have to work to too high ages.
7. Would monthly increments in the SPA be better
- 95 answered – 25 skipped it;
- Yes=35.8%;
- No=64.2%.
Our comments – this question could be interpreted in a number of ways and so conclusions aren’t clear. We presume the interpretation is that a 1-year change effected every, say, 12 years is preferred to changing SPA by 1 month every year. We note that monthly changes do apply during the proposed “2-year change implementation period”.
8. How important should the following factors be in setting SPA
- 78 answered – 26 skipped it;
We allocated scores of very important=4, down to irrelevant=1, then averaged the scores for each factor and then ranked them most important (on average) to least so.
Possible interpretation:
- most important to ensure resulting benefits affordable/sustainable because costs/dependency ratio are in top 4;
- then need to focus on the needy because those relying on pension and integration with other benefits are in top 5;
- there is a desire that retired life should not be wholly “not healthy”;
- impacts on OPS’s not seen as being so important (presumably on basis that OPS’s can amend themselves to adjust?).
9. Are there any other factors you think should be considered?
- Only 15 answered –105 skipped it.
Comments given were often difficult to see as factors the panel could easily “take into account”. Sometimes the comments were more about how changes might be brought in:
- Consider cost related issues, dependency ratio or %GDP;
- Consider levels of private provision;
- Fairness to existing workers’ expectations
- Healthcare costs;
- Uncertainty in projections.
10. Alternatives
- 91 answered – 29 skipped it, however, 57 of the 91 entered “n/a” or similar, or effectively said “what are the alternatives?” so there are only 34 proper responses. Some of those 34 were then difficult to interpret; e.g. “consistent link to min pension age”.
Comments that could be interpreted as “alternatives” included:
- Base {SPA or pension amount} on (projected) costs/affordability – e.g. fix % of GDP or fix projected dependency ratio and deduce affordable pension accordingly, etc.;
- Allow an SPA window/greater flexibility/allow start before “pivot SPA” on reduced amounts;
- Find some way to link to healthy (projected) lifetimes, or reflecting costs of care in old age;
- Variable SPA based on, e.g., postcodes, wealth, occupation, etc.;
- One respondent said – steady increase in SPA irrespective of projected expectancy;
- One said – abolish SPA and pay (only) those people who need it what they need to live adequately.