Introduction
The continuing growth of older age groups in the European Union (EU) has raised international policy interest in promoting active aging (AA) (Walker, Reference Walker2009; European Union, 2012). AA has been defined as “the process of optimizing opportunities for health, participation, and security in order to enhance quality of life as people age” (World Health Organization, 2013a). This and other concepts such as successful (Rowe and Kahn, Reference Rowe and Kahn1997), productive (Kerschner and Pegues, Reference Kerschner and Pegues1998), and positive aging (Bowling, Reference Bowling1993) refer to an optimistic view of aging. Contrary to more traditional paradigms of human aging, these terms include gains as well as losses positing possible improvement in future human health despite increasing longevity (Fries, Reference Fries2012). These terms have been used interchangeably by several authors (Lupien and Wan, Reference Lupien and Wan2004; Depp and Jeste, Reference Depp and Jeste2006). Despite having specific semantic specifications (Fernández-Ballesteros et al., Reference Fernández-Ballesteros, Molina-Martínez, Schettini-del-Moral, Santacreu, Robine, Jagger and Crimmins2013), in the following text, AA will be used to encompass all these concepts.
Models of AA are controversial. No agreement exists across disciplines about definitions. Biomedical, psychosocial, and lay perspectives have been used to conceptualize AA (Bowling and Dieppe, Reference Bowling and Dieppe2005). Biomedical theories define AA largely in terms of the optimization of healthy life expectancy, i.e. minimizing deterioration in physical and mental functioning and reducing disability. Psychosocial models emphasize life satisfaction, social participation and functioning, and psychological resources, including personal growth. Lay perspectives of older people have been used to add domains not usually captured by theoretical models (Cosco et al., Reference Cosco, Prina, Perales, Stephan and Brayne2013). In addition to physical, psychological, and social domains (Fernández‐Ballesteros, Reference Fernández-Ballesteros2008), these perspectives include external variables such as financial and environmental security (Cosco et al., Reference Cosco, Prina, Perales, Stephan and Brayne2013). There is also debate about appropriate cut-off points in measures used (Depp and Jeste, Reference Depp and Jeste2006). Moreover, what some studies consider to be constituents of AA (e.g. income) are regarded as factors influencing AA in others (Strawbridge et al., Reference Strawbridge, Cohen, Shema and Kaplan1996; Bowling and Iliffe, Reference Bowling and Iliffe2006; Fernández-Ballesteros et al., Reference Fernández-Ballesteros, Molina-Martínez, Schettini-del-Moral, Santacreu, Robine, Jagger and Crimmins2013).
The comparison of the percentage of people who are actively aging across studies is of limited use given the wide variety of definitions and measurement approaches. The proportion of active agers varies greatly, from 0.4% to 95% (Depp and Jeste, Reference Depp and Jeste2006). This is due to different conceptualizations, operationalizations, and methodologies. Also, by splitting individuals into active and nonactive agers, it is assumed that people cannot actively age with, for example, conditions such as HIV or schizophrenia (Ibrahim et al., Reference Ibrahim, Cohen and Ramirez2010; Malaspina et al., Reference Malaspina2011). However, it seems more appropriate to treat AA as a continuum. Analyzing how much someone ages actively provides richer information than merely indicating if someone is actively aging.
The current study aims to study the distribution and correlates of AA in three different European countries, namely, Spain, Poland, and Finland. The research addresses the following questions: Does the distribution of active agers vary among countries? If so, does this depend on the definition of AA used? What factors are associated with AA? Do these factors vary by country?
Methods
Design
COURAGE in Europe is an observational, cross-sectional three year study of general noninstitutionalized adult population (18 years or older) reached through household interviews. The sample is representative of three European countries (Finland, Poland, and Spain). These countries were selected to give a broad representation across different European regions, representing, respectively, the north, the east, and the south of Europe, taking into consideration their population and health characteristics.
Sample and procedure
A stratified, multistage cluster sample design was used to obtain nationally representative samples. A probability proportion to size design was used to select clusters. Within each cluster, an enumeration of existing households was done to obtain an accurate measurement of size. Interviews were conducted face-to-face by Computer-Assisted Personal Interviewing (CAPI) at respondent's homes. All the interviewers participated in a training course for the administration of the survey. Quality control procedures were implemented during fieldwork (Ustun et al., Reference Ustun, Chatterji, Mechbal and Murray2005). The instruments were translated from English into Finnish, Polish, and Spanish following the World Health Organization (WHO) translation guidelines for assessment instruments, which included a forward translation, a targeted back-translation, review by a bilingual expert group, and a detailed translation report (World Health Organization, 2013b). The surveys were conducted between 2011 and 2012. Ethical approvals from the relevant ethics committees (Parc Sanitari Sant Joan de Déu, Barcelona, Spain; Hospital la Princesa, Madrid, Spain; National Institute for Health and Welfare, Helsinki, Finland, and Jagiellonian University Medical College, Krakow, Poland) and written informed consent from each participant were obtained. The sample size was composed of 10,800 individuals: 1,976 from Finland, 4,071 from Poland, and 4,753 from Spain. The individual response rate was 69.9% in Spain, 66.5% in Poland, and 53.4% in Finland. Only those aged 50 years old and above who did not need a proxy respondent were included in this study. Therefore, the final sample size was 7,987: 1,452 from Finland, 2,910 from Poland, and 3,625 from Spain.
Measures
Participants were asked to provide sociodemographic information (age, gender, education level, marital status, occupation, household income, and urbanicity). Categories for highest level of education completed were “never been to school,” “less than primary school,” “primary school completed,” “secondary school completed,” “high school completed,” “college/pre-university/university completed,” and “post-graduate degree completed.” Information on marital status was collected as follows: never married, currently married, cohabiting, separated/divorced, and widowed. Occupation was defined using ISCO 08 categories (European Commission, 2009). These categories are divided into nine main groups: managers, professionals, technicians and associate professionals, clerical support workers, service and sales workers, skilled agricultural, forestry and fishery workers, craft and related trades workers, plant and machine operators, and assemblers and elementary occupations.
Chronic medical conditions were assessed by asking whether the individuals had been diagnosed by a doctor with chronic lung disease, asthma, hypertension, arthritis, stroke, angina, and diabetes. In addition, an algorithm of symptoms was used to detect nondiagnosed cases of arthritis, stroke, angina, chronic lung disease, and asthma. Disability was assessed with the 12-item interviewer administered version of the World Health Organization Disability assessment Schedule version II (WHO-DAS II) (World Health Organization, 2012). Participants were asked to report the level of difficulty they had in doing various activities such as dressing or concentrating during the previous 30 days using a five-point scale (none = 1, mild = 2, moderate = 3, severe = 4, and extreme/cannot do = 5). The total score ranges from 0 to 100 with higher scores indicating greater disability. Cognitive functioning was assessed through five performance tests measuring three different domains: learning and short-term memory (delayed and immediate recall of words), working memory (digit span forward and backward), and verbal fluency (animal naming task). A composite of these five scores was calculated (He et al., Reference He, Muenchrath and Kowal2012). Psychiatric morbidity was assessed using an adapted version of the Depression module of the WHO Composite International Diagnostic Interview (CIDI) (Kessler and Ustün, Reference Kessler and Ustün2004). This is a fully structured lay-administered interview that generates diagnoses according to the ICD-10 DCR definition and criteria (World Health Organization, 1992). Physical activity was measured using the Global Physical Activity Questionnaire (Armstrong and Bull, Reference Armstrong and Bull2006) and collects information on physical activity participation in three settings as well as sedentary behavior, comprising 16 questions. The domains are activity at work; travel to and from places; and recreational activities. Tobacco consumption was assessed by asking if the participants were daily smokers, nondaily smoker, former smokers, or never smokers. Alcohol consumption was assessed by asking if the participants were lifetime abstainers, and if not, the pattern of alcohol consumption in the previous week based on which they were classified as being occasional drinkers, nonheavy drinkers, infrequent heavy drinkers or heavy drinkers. Those who did not consume alcohol in the previous 30 days or in the previous seven days were categorized as occasional drinkers. Participants who consumed alcohol in the previous 30 days and in the previous seven days were labeled as nonheavy drinkers. Participants who consumed alcohol —one to two days per week, with five or more standard drinks in previous seven days for men and four or more for women were categorized as infrequent heavy drinkers. Participants who did consume alcohol three or more days per week with five or more standard drinks in last seven days for men and four or more for women were categorized as frequent heavy drinkers. Social participation was measured using 11 five-point Likert scale questions on how often in the last 12 months the person had participated in activities such as attending public meetings or meeting community leaders. Social contacts were measured using 10 five-point Likert scale questions on how often in the last 12 months the person had contact with other people such as their partner, children, or neighbors. Social support was measured using the Oslo social support scale (Bøen et al., Reference Bøen, Dalgard and Bjertness2012). This scale consists of three items: “How many people are you so close to that you can count on them if you have great personal problems? [none (1), 1–2 (2), 3–5 (3), 5+ (4)],” “How much interest and concern do people show in what you do? [a lot (5), some (4), uncertain (3), little (2), none (1)],” and “How easy is it to get practical help from neighbors if you should need it? [very easy (5), easy (4), possible (3), difficult (2), very difficult (1)].” Control and coping were measured with one item each on how unable the person is to control important things in life and to cope with things they have to do. Self-rated quality of life was measured with a single five-point Likert scale question ranging from very good to very bad. Environmental safety was measured through two items asking: “In general, how safe from crime and violence do you feel at your home?” and ‘How safe do you feel when walking down your street (neighborhood) alone after dark?” ranging from completely safe to not safe at all in a five-point Likert scale.
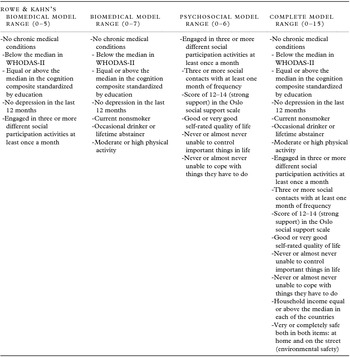
The indicators used for the construction of the different models of AA were selected on the basis of previous literature (Bowling and Dieppe, Reference Bowling and Dieppe2005; Depp and Jeste, Reference Depp and Jeste2006) (Table 1). The models were Rowe and Kahn's biomedical definition of AA (Rowe and Kahn, Reference Rowe and Kahn1997) (avoidance of disease and disability, maintenance of high physical and cognitive function, and sustained engagement in social and productive activities), two models including strictly biomedical or psychosocial indicators and a complete model including all indicators. For the comparison of factors associated to AA by country, only the complete definition of AA was used since it represents the multidimensional nature of AA (Cosco et al., Reference Cosco, Prina, Perales, Stephan and Brayne2013). The definitions of AA were operationalized as the sum of the different indicators. The higher the score, the more actively people aged.
Construction of models of AA

Statistical methods
Univariate analyses included means and their standard deviations. Linear regression analysis [beta, 95% confidence intervals (95% CIs)] was used for bivariate and multivariate analyses. The level for statistical significance for all analyses was set at 0.05. Imputations for missing data were not used. Those participants who were not able to respond to the survey due to cognitive problems were not included in the main analysis. We conducted a sensitivity analysis using Rowe and Kahn's definition of AA also including those individuals. In this analysis, we created a dichotomous-dependent variable (actively ageing vs. not actively aging). Active agers were those who fulfilled all the criteria for Rowe and Kahn's definition of AA. Those with cognitive problems were assumed to be aging in a nonactive way. We then compared associations with sociodemographic variables (country, age, gender, educational status, occupation, marital status, and urbanicity) of the sample including those with and without cognitive problems using logistic regression.
All data were weighted to account for sampling design in each country. Poststratification corrections were made to the weights to adjust for the population distribution obtained from the national census from each country and for nonresponse. In order to make valid comparisons across countries, age and sex were standardized on the basis of the European Standard Population (World Health Organization, 1990). All analyses were performed using the Stata version 11.0 using the survey package (StataCorp, 2009).
Results
Characteristics of participants and description of variables included in the models of AA
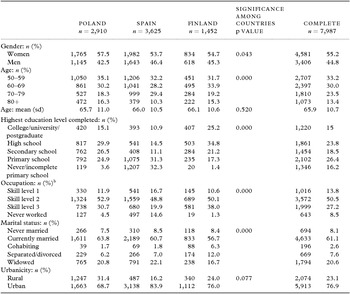
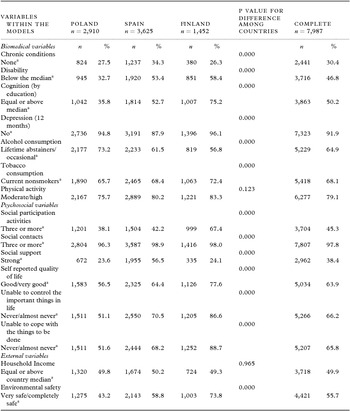
Tables 2 and 3 summarize the demographic characteristics of the participants and the description of the variables selected for the inclusion in the different models of AA. Poland had the lowest percentage of people free from disability (33% vs. 53% and 58% in Spain and Finland, respectively), moderate to high physical activity (76% vs. 80% and 83%), social contacts (96% vs. 99% and 98%), self-reported quality of life (57% vs. 64% and 78%), control (51% vs. 71% and 87%), coping (52% vs. 68% and 89%), and environmental safety (43% vs. 59% and 74%). Spain had the lowest percentage of people without depression (88% vs. 95% and 96% in Poland and Finland) and the highest percentage of people with no chronic conditions (34% vs. 28% and 26%), strong social support (57% vs. 24% and 24%). Finland had the lowest percentage of life abstainers and occasional drinkers (57% vs. 73.2 and 62% in Poland and Spain) and highest percentage of good cognition (75% vs. 36% and 53%), current nonsmokers (72% vs. 66% and 68%), physical activity, social participation, self-reported quality of life, control, coping, and environmental safety. The prevalence of AA operationalized as those fulfilling all criteria in the different models has been reported in the supplementary material for the interested reader (SM1).
Demographic characteristics of participants in the Spanish, Polish, and Finish samples.

aWeighted percentage
bISCO 08 categories were categorized into three levels according to their skill level. Skill level 3 corresponds to technicians and associate professionals, professionals, and managers. Skill level 2 corresponds to occupations between plant and machine operators and assemblers and clerical support workers. Skill level 1 corresponds to elementary occupations.
Description of the components of AA by country.

All variables recoded and dichotomized as 1/0, 1 being the criterion for AA.
aCriterion of AA
Correlates of AA
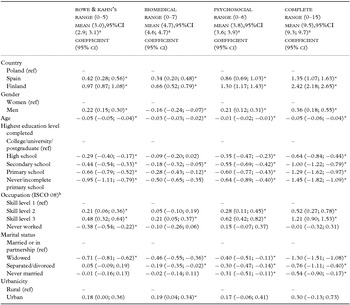
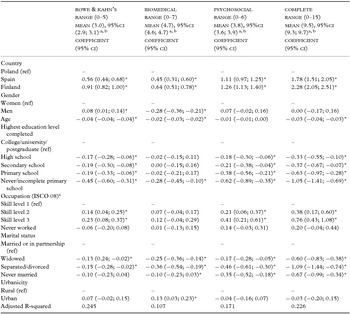
Tables 4 and 5 show the bivariate and multivariate associations of the different definitions of AA with socio-demographic variables. Looking at Table 4, there was a consistent gradient regarding country across all definitions of AA where Poland had the lowest score, followed by Spain and Finland. Men had significantly higher scores than women in all definitions except for the biomedical one, in which women had a higher score. Age was inversely associated with all AA definitions. There was an education gradient where those with lower studies scored lower than those with higher studies. A similar gradient was found regarding occupation. Widows had lower scores of AA than those married or cohabiting across all definitions. The same applies to those who were currently divorced except for Rowe and Kahn's definition in which there was no significance. Those who had never been married had lower scores than those married or cohabiting in the psychosocial and complete definitions. Finally, people living in urban areas scored higher in AA in the biomedical model.
Simple linear regression showing associations [coefficient, 95% confidence interval (95% CI)] with correlates on alternate AA models.

aHigher values indicate more AA.
bISCO 08 categories were categorized into three levels according to their skill level. Skill level 3 corresponds to technicians and associate professionals, professionals, and managers. Skill level 2 corresponds to occupations between plant and machine operators and assemblers and clerical support workers. Skill level 1 corresponds to elementary occupations.
*p < 0.05
Multiple linear regression showing associations [coefficient, 95% confidence interval (95% CI)] with correlates on alternate AA models.

aAdjusted for country, gender, age, education, occupation, marital status, and urbanicity.
bHigher values indicate more AA.
cISCO 08 categories were categorized into three levels according to their skill level. Skill level 3 corresponds to technicians and associate professionals, professionals, and managers. Skill level 2 corresponds to occupations between plant and machine operators and assemblers and clerical support workers. Skill level 1 corresponds to elementary occupations.
*p < 0.05
Multivariate analysis confirms all these results except for few exceptions. Mainly men had no longer higher scores than women in the psychosocial and complete definitions. The education gradient was not so evident. There was no longer an occupation gradient in the biomedical definition and only having less than incomplete primary education is significantly associated with lower AA compared to having completed college or university.
Correlates of AA by country
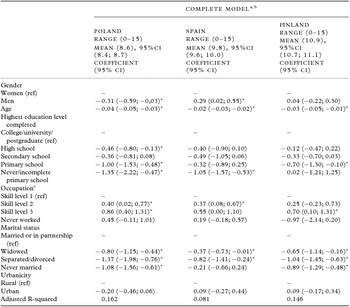
Table 6 shows the multivariate associations of the complete definition of AA with sociodemographic variables by country. The comparison of factors associated with the other three definitions of AA by country can be found in the supplementary material (SM2). Men had higher scores than women in Spain. Women had scored higher than men in Poland. There were no associations with gender in Finland. Age was still inversely associated with AA in the three countries. There were still education and occupation gradients in all countries although not all categories reached significance. Widows and divorced/separated had lower scores than those who were married or cohabiting in the three countries. Having never been married was associated with lower AA in both Poland and Finland. Urbanicity was not associated with the complete definition of AA in any country.
Multiple linear regression showing associations with the complete model of AA [coefficient, 95% confidence interval (95% CI)] by country.

aAdjusted for gender, age, education, occupation, marital status, and urbanicity.
bHigher values indicate more AA.
cISCO 08 categories were categorized into three levels according to their skill level. Skill level 3 corresponds to technicians and associate professionals, professionals, and managers. Skill level 2 corresponds to occupations between plant and machine operators and assemblers and clerical support workers. Skill level 1 corresponds to elementary occupations.
*p < 0.05
Sensitivity analysis
The associations between sociodemographic variables and AA using Rowe and Kahn's model were similar in the sample including those who could not participate due to cognitive problems and the sample that included these individuals. This information can be found in the supplementary material (SM3).
Discussion
This article has examined the distribution of AA and their correlates in three different European countries, including the factors associated with AA and their variation depending upon the definition of AA being operationalized. Significant country differences were found in all the definitions of AA with Poland having the lowest score, followed by Spain and Finland. Age, education, marital status, and occupation are the most important factors associated to AA. The patterns of associations, however, seem to vary across the three countries. After adjusting for other sociodemographic variables, gender (with the exception of the biomedical model in which women are better off than men) and urbanicity were not associated with a propensity to AA.
Finnish participants had better AA than their Spanish counterparts and these than their Polish counterparts. Similar trends have been reported in the SHARE project (Hank, Reference Hank2011) in which among 14 European countries, Poland was the one with less active agers, followed by Spain. Nordic countries such as Denmark and Sweden were the countries with most active agers. The samples in both studies, however, differ regarding age. In the SHARE study, the participants were 65 years and older, whereas in our study the participants were 50 years and older being more than 30% of participants younger than 60 years old. Therefore, these trends do not seem to depend on age and could be related to the different welfare systems between socialdemocratic, southern, and eastern European countries (Eikemo et al., Reference Eikemo, Huisman, Bambra and Kunst2008).
When analyzing the different components of AA by country, Poland comes last in nearly every component. Poland has the highest percentage of disability, current smokers and sedentary lifestyle; and the lowest percentage of high cognition, social participation, social contacts, control, coping, and environmental safety. Finland, on the other hand has the best rates in most components. Although Spain is in a middle stage regarding AA components, it is worth highlighting the percentage of illiteracy and low education and occupation roles. Whereas there is almost no illiteracy in the other two countries, almost one of every ten Spaniards aged 50 years and over is illiterate. More than three of ten did not complete primary school compared to less than 4% in Poland and less than 2% in Finland. This is especially important given the associations between education and occupation and AA. Growing old was associated with lower scores on all models of AA except for the psychosocial one. This is consistent with ten of ten longitudinal and three of five cross-sectional studies reviewed by Depp and Jeste (Reference Depp and Jeste2006). The lack of associations with age in the psychosocial definition is consistent with the idea that the elderly can do as well or sometimes even better than young people regarding happiness or managing social relationships (Helmuth, Reference Helmuth2003; Carstensen, Reference Carstensen2006). There is also evidence that supports our finding that socioeconomic position was associated with AA (Strawbridge et al., Reference Strawbridge, Cohen, Shema and Kaplan1996; Hank, Reference Hank2011; Jeste et al., Reference Jeste2013). In our study, both education and occupation were independently associated with AA. Different mechanisms could be contributing to these associations. According to neo-material theories (Lynch, Reference Lynch2000), a lower socioeconomic position would be linked to having fewer resources to avoid risks, cure illnesses, prevent diseases, and living in a more deprived and unsafe environment. Behavioral theories (Kenkel, Reference Kenkel1991) explain this phenomenon by means of an increase in cognitive skills or information through education that can enhance health behaviors and thus also prevent disease and increase quality of life. Finally, the psychosocial theories (Wilkinson, Reference Wilkinson2000) stress the idea of social comparison and the sense of lack of control on one's own life among those with a lower position. Being currently married or cohabiting was associated to higher AA scores compared to being widowed, divorced, or even never married in different definitions of AA. Only one of seven longitudinal studies and none out of three cross-sectional studies found current marriage to be associated with AA in a recent systematic review (Depp and Jeste, Reference Depp and Jeste2006). The associations with marital status could be related to social support mechanisms given that one of the primary benefits of marriage is social connectedness or more instrumental aspects of marriage such as finances.
Limitations
There are a number of limitations to this descriptive study. First, different models of AA have been employed, showing sometimes discordant results. This highlights the need for an improved agreement on the definition of AA and the corresponding measurement approaches. However, models are simplified representations of reality and there is no true model of AA. Researchers and interested professionals need to select definitions and models that are contextually appropriate and robust. Our assessment of AA gives the same weight to the different variables included in the definition, which may not be adequate in some cases. This study has a cross-sectional design and therefore, causality cannot be inferred from the associations. Because of this type of design, it is impossible to disentangle age from cohort effects. Institutionalized people are not part of the target population; these people are more likely to have worse health outcomes. Unhealthy older women have a greater probability of living in residential settings since women have higher life expectancy than men and therefore might be underrepresented. People with lower socioeconomic position might have higher mortality (Berkman and Kawachi, Reference Berkman and Kawachi2000). This may lead to survival bias. Since the present study was not part of the main aims of the COURAGE in Europe project, we did not include all aspects of AA (i.e. environmental fit, personal growth, etc.). However, we have included a number of variables that are representative of the major components of AA, namely biomedical, psychosocial, and external factors.
Implications
These findings have interesting implications for public health policies. There are numerous aspects in which the three countries could promote AA. This can be achieved by reducing inequalities in education and occupation in these three countries since they have been consistently associated with AA. Alternatively, measures can be taken to increase AA by improving individual components of AA directly. Poland, for example, should focus on tackling components of AA such as disability given that the prevalence of disability in this country is high compared to Spain and Finland. According to the WHO International Classification of Functioning Disability and Health (ICF) (World Health Organization, 2001), in order to decrease disability, interventions should be aimed at the environment and not only focusing on the individual's functioning (World Health Organization, 2001). In the case of Spain, special emphasis should be put on education and reducing gender differences. Even though education in Spain is now compulsory until age 16, cuts are currently being implemented in education to the extent that the budget for education has decreased to 31.6% from 2011 to 2013 (Presupuestos Generales del Estado, 2011; 2013). Also tuition fees are being increased in universities due to the crisis (Diari Oficial de la Comunitat Valenciana, 2011; 2012). This is a threat to AA for future generations given the consistent education gradients across all definitions of AA. Gender inequalities have been found specifically for Spain. Despite being the country with more active agers, Finland can still benefit from tackling social inequalities. Chronic conditions, alcohol consumption, and social support are areas in which Finland could focus their efforts. Further, studies should focus on aspects related to support in people who are not married or cohabiting and the association with AA. These people show lower levels of AA in the three countries. The associations found may vary depending on the gender of the individual. Future research will be necessary to shed light on this issue.
Conclusions
Active aging will play an important role in improving the health of populations across Europe in the context of a continued growth of older age groups. Multidimensional models that include psychosocial, biomedical, and external factors and follow a continuum in which people can score higher or lower in AA will best help detect areas of deficiency and proficiency and thus suggest ways to identify good or bad praxis in interventions aimed at AA. This will help understanding and promoting AA in different populations.
Conflict of interest
None.
Description of author’ roles
The study design was planned by JP, JA, SC, SK, ML, MM, BT, BO, and JH. JP conducted the data analyses. JP and SM drafted the article. JH supervised the data analyses and development of the paper. The paper was edited and reviewed by all the authors.
Acknowledgments
The research leading to these results has received funding from the European Community's Seventh Framework Programme (FP7/2007-2013) under grant agreement number 223071 (COURAGE in Europe), from the Instituto de Salud Carlos III-FIS research grant number PS09/01845 and PS09/00295 and from the Spanish Ministry of Science and Innovation ACI-Promociona (ACI2009-1010). The study was supported by the Centro de Investigación Biomédica Red de Salud Mental (CIBERSAM), Instituto de Salud Carlos III, and Recercaixa 2011. J.P. is grateful to the Instituto de Salud Carlos III for a predoctoral grant (PFIS). J.P. is grateful to Mendeley reference manager for providing an open source tool for reference editing.
Abbreviations
AA: active aging, EU European Union, WHO: World Health Organization, WHODAS II: World Health Organization Disability Schedule version II, CIDI: Composite International Diagnostic Interview, ISCO-08: International Standard Classification of Occupations (08).