Introduction
The impaired ability to process emotion adequately, such as affectivity, anxiety and fear, is one of the most severe deficit in patients with schizophrenia (Addington & Addington, Reference Addington and Addington2000). Research done on animal models (LeDoux, Reference LeDoux1996, Reference LeDoux2000; Davis & Whalen, Reference Davis and Whalen2001) and on humans (LaBar et al. Reference LaBar, LeDoux, Spencer and Phelps1995; Morris et al. Reference Morris, Friston, Buchel, Frith, Young, Calder and Dolan1998a, Reference Morris, Ohman and Dolanb; Phelps et al. Reference Phelps, O'Connor, Cunningham, Funayama, Gatenby, Gore and Banaji2000; Adolphs et al. Reference Adolphs, Gosselin, Buchanan, Tranel, Schyns and Damasio2005) supports the key role of the amygdala in fronto-limbic circuitries involved in the modulation of human emotions (LeDoux, Reference LeDoux1998; Aggleton, Reference Aggleton2000; Aggleton & Young, Reference Aggleton, Young, Lane, Nadel, Ahern, Allen, Kaszniak, Rapcsak and Schwartz2000). Therefore, it is not surprising that disturbances of the amygdala and its connections have been implicated in the pathophysiology of schizophrenia.
Patients with schizophrenia show functional abnormalities of amygdala activity (Kosaka et al. Reference Kosaka, Omori, Murata, Iidaka, Yamada, Okada, Takahashi, Sadato, Itoh, Yonekura and Wada2002; Taylor et al. Reference Taylor, Liberzon, Decker and Koeppe2002; Takahashi et al. Reference Takahashi, Koeda, Oda, Matsuda, Matsushima, Matsuura, Asai and Okubo2004; Williams et al. Reference Williams, Brown, Das, Boucsein, Sokolov, Brammer, Olivieri, Peduto and Gordon2004; Fahim et al. Reference Fahim, Stip, Mancini-Marie, Mensour, Boulay, Leroux, Beaudoin, Bourgouin and Beauregard2005; Das et al. Reference Das, Kemp, Flynn, Harris, Liddell, Whitford, Peduto, Gordon and Williams2007) and an altered functional connectivity in the amygdalar network underlying fear perception (Keshavan et al. Reference Keshavan, Diwadkar and Rosenberg2005; Das et al. Reference Das, Kemp, Flynn, Harris, Liddell, Whitford, Peduto, Gordon and Williams2007; Leitman et al. Reference Leitman, Loughead, Wolf, Ruparel, Kohler, Elliott, Bilker, Gur and Gur2008). Despite growing research efforts, as to morphological changes, there are still contradictory results about reduced or preserved amygdalar volumes and structure in schizophrenia (Altshuler et al. Reference Altshuler, Bartzokis, Grieder, Curran, Jimenez, Leight, Wilkins, Gerner and Mintz2000; Niemann et al. Reference Niemann, Hammers, Coenen, Thron and Klosterkotter2000; Joyal et al. Reference Joyal, Laakso, Tiihonen, Syvalahti, Vilkman, Laakso, Alakare, Rakkolainen, Salokangas and Hietala2003). Indeed, there are some studies showing size reductions (Nelson et al. Reference Nelson, Saykin, Flashman and Riordan1998; Wright et al. Reference Wright, Rabe-Hesketh, Woodruff, David, Murray and Bullmore2000; Joyal et al. Reference Joyal, Laakso, Tiihonen, Syvalahti, Vilkman, Laakso, Alakare, Rakkolainen, Salokangas and Hietala2003; Exner et al. Reference Exner, Boucsein, Degner, Irle and Weniger2004; Niu et al. Reference Niu, Matsui, Zhou, Hagino, Takahashi, Yoneyama, Kawasaki, Suzuki, Seto, Ono and Kurachi2004; Kalus et al. Reference Kalus, Slotboom, Gallinat, Wiest, Ozdoba, Federspiel, Strik, Buri, Schroth and Kiefer2005; Namiki et al. Reference Namiki, Hirao, Yamada, Hanakawa, Fukuyama, Hayashi and Murai2007; Garcia-Marti et al. Reference Garcia-Marti, Aguilar, Lull, Marti-Bonmati, Escarti, Manjon, Moratal, Robles and Sanjuan2008) both in chronic (Breier et al. Reference Breier, Buchanan, Elkashef, Munson, Kirkpatrick and Gellad1992; Shenton et al. Reference Shenton, Kikinis, Jolesz, Pollak, Lemay, Wible, Hokama, Martin, Metcalf, Coleman and McCarley1992; Marsh et al. Reference Marsh, Suddath, Higgins and Weinberger1994; Anderson et al. Reference Anderson, Wible, McCarley, Jakab, Kasai and Shenton2002) and first-episode patients (Hirayasu et al. Reference Hirayasu, Shenton, Salisbury, Dickey, Fischer, Mazzoni, Kisler, Arakaki, Kwon, Anderson, Yurgelun-Todd, Tohen and McCarley1998). A trimodal magnetic resonance (MR) imaging (MRI) study (Kalus et al. Reference Kalus, Slotboom, Gallinat, Wiest, Ozdoba, Federspiel, Strik, Buri, Schroth and Kiefer2005) detected a significant reduction of amygdala raw volumes in 14 patients with schizophrenia, while amygdala volumes normalized for intracranial volume (ICV) did not differ between patients and controls. In the same study, abnormally reduced diffusional anisotropy and preserved magnetization transfer ratio of the amygdala were found in individuals with schizophrenia. On the contrary, other reports showed no differences in amygdalar volumes between subjects with schizophrenia and healthy controls (Altshuler et al. Reference Altshuler, Bartzokis, Grieder, Curran, Jimenez, Leight, Wilkins, Gerner and Mintz2000; Niemann et al. Reference Niemann, Hammers, Coenen, Thron and Klosterkotter2000; Staal et al. Reference Staal, Pol, Schnack, Hoogendoorn, Jellema and Kahn2000; Levitt et al. Reference Levitt, Blanton, Caplan, Asarnow, Guthrie, Toga, Capetillo-Cunliffe and McCracken2001; Szeszko et al. Reference Szeszko, Goldberg, Gunduz-Bruce, Ashtari, Robinson, Malhotra, Lencz, Bates, Crandall, Kane and Bilder2003; Tanskanen et al. Reference Tanskanen, Veijola, Piippo, Haapea, Miettunen, Pyhtinen, Bullmore, Jones and Isohanni2005; Velakoulis et al. Reference Velakoulis, Wood, Wong, McGorry, Yung, Phillips, Smith, Proffitt, Desmond and Pantelis2006) and neither did a recent meta-analysis study (Vita et al. Reference Vita, De Peri, Silenzi and Dieci2006). Furthermore, there is disagreement between a small number of post-mortem studies investigating amygdalar volumes and the number of neurones which did (Bogerts et al. Reference Bogerts, Meertz and Schonfeldt-Bausch1985) or did not (Heckers et al. Reference Heckers, Heinsen, Heinsen and Beckmann1990; Pakkenberg, Reference Pakkenberg1990; Chance et al. Reference Chance, Esiri and Crow2002) find significant differences between patients with schizophrenia and normal controls. A review of MRI studies showed that volume reduction involving the hippocampus, parahippocampal gyrus, or amygdala is reported in 77% of the 30 analysed studies (McCarley et al. Reference McCarley, Wible, Frumin, Hirayasu, Levitt, Fischer and Shenton1999). A meta-analysis revealed that a further source of variability in results may depend on whether the amygdalar volumes have been measured alone or in combination with the hippocampus (Lawrie & Abukmeil, Reference Lawrie and Abukmeil1998). In fact, out of 10 studies measuring the combined amygdala and hippocampus, a 6% of reduction in the median volume has been found, whereas out of six studies measuring the amygdala separately the reduction was about 10% (Lawrie & Abukmeil, Reference Lawrie and Abukmeil1998). Some studies report a decrease of amygdalar volumes in individuals with schizophrenia bilaterally (Joyal et al. Reference Joyal, Laakso, Tiihonen, Syvalahti, Vilkman, Laakso, Alakare, Rakkolainen, Salokangas and Hietala2003; Niu et al. Reference Niu, Matsui, Zhou, Hagino, Takahashi, Yoneyama, Kawasaki, Suzuki, Seto, Ono and Kurachi2004), in the right hemisphere only (Pearlson et al. Reference Pearlson, Barta, Powers, Menon, Richards, Aylward, Federman, Chase, Petty and Tien1997) or in male patients only (Gur et al. Reference Gur, Turetsky, Cowell, Finkelman, Maany, Grossman, Arnold, Bilker and Gur2000).
Based on the discrepancies of volumetric studies, neuroimaging techniques that can provide information about amygdalar microstructure organization in schizophrenia would be of benefit. In the present study, we further investigated amygdalar size and cytoarchitectural integrity in a larger sample with respect to the above-mentioned studies by combining structural MRI and diffusion weighted imaging (DWI) techniques. In particular, MR design including high-resolution volumetry and diffusion imaging might provide a new strategy for the detection of subtle structural alterations that cannot be visualized by conventional volumetric imaging. Indeed, DWI examines molecular water mobility within the local tissue environment, providing important information on tissue microstructural integrity. The diffusion of water in the brain is characterized by its apparent diffusion coefficient (ADC), which represents the mean diffusivity of water along all directions (Taylor et al. Reference Taylor, Hsu, Krishnan and MacFall2004). Thus, ADC gives potential information about the size, orientation and tortuosity of both intra- and extracellular spaces, providing evidence of disruption when increased (Rovaris et al. Reference Rovaris, Bozzali, Iannucci, Ghezzi, Caputo, Montanari, Bertolotto, Bergamaschi, Capra, Mancardi, Martinelli, Comi and Filippi2002). ADC has also been used to explore regional grey matter microstructure, being higher in the case of potential neuron density alterations or volume deficit (Syková, Reference Syková2004; Ardekani et al. Reference Ardekani, Bappal, D'Angelo, Ashtari, Lencz, Szeszko, Butler, Javitt, Lim, Hrabe, Nierenberg, Branch and Hoptman2005; Ray et al. Reference Ray, Wang, Chu, Chen, Bert, Hasso and Su2006).
Given that the deficit of processing emotion appropriately is a core symptom of schizophrenia and based on previous literature showing a key role of the amygdala in modulating human emotions, we expected that patients suffering from schizophrenia would have an abnormally increased water diffusivity of the amygdala compared with normal controls resulting in greater ADCs, potentially without any apparent gross abnormalities. In addition, the correlations between clinical variables and amygdala microstructure coherence were explored to investigate whether the presence of abnormal water diffusivity is also associated with particular psychopathological dimensions, such as depression.
Method
Subjects
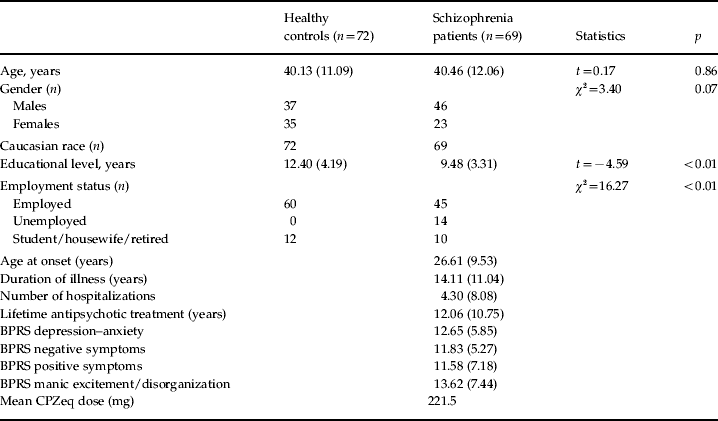
A total of 69 patients with schizophrenia according to DSM-IV criteria [aged 40.46 (s.d.=12.06) years, 46 males] and 72 healthy control subjects [aged 40.13 (s.d.=11.09) years, 37 males] were studied (Table 1). Patients were recruited from the geographically defined catchment area of South Verona (i.e. 100 000 inhabitants) and were being treated by the South Verona Community-based Mental Health Service and by other clinics reporting to the South Verona Psychiatric Care Register (Amaddeo et al. Reference Amaddeo, Burti, Ruggeri and Tansella2009; Amaddeo & Tansella, Reference Amaddeo and Tansella2009). Diagnoses for schizophrenia were obtained using the Item Group Checklist of the Schedule for Clinical Assessment in Neuropsychiatry (IGC-SCAN) (WHO, 1992) and confirmed by the clinical consensus of two staff psychiatrists. The IGC-SCAN was performed by two trained research clinical psychologists with extensive experience in the procedure. In fact, they administered at least 10 IGC-SCANs with a senior investigator trained in SCAN, after having conducted several IGC-SCANs. Moreover, the psychopathological item groups completed by the two raters were compared, in order to discuss any major symptom discrepancies. We also ensured the reliability of the IGC-SCAN diagnoses by holding regular consensus meetings with the psychiatrists treating the patients and a senior investigator. It is worth noting that the Italian version of the SCAN was edited by our group (WHO, 1996) and that our investigators attended specific training courses held by official trainers in order to learn how to administer the IGC-SCAN. Subsequently, diagnoses for schizophrenia were corroborated by the clinical consensus of two staff psychiatrists, according to the DSM-IV criteria. Patients with co-morbid psychiatric disorders, alcohol or substance abuse within the 6 months preceding the study, history of traumatic head injury with loss of consciousness, epilepsy or other neurological diseases were excluded. All but one patient was receiving antipsychotic medications at the time of scanning. Specifically, 25 were on typical antipsychotic drugs (18 on haloperidol, four on fluphenazine, three on zuclopenthixol) and 43 on atypical antipsychotic medication (23 olanzapine, 10 clozapine, seven risperidone, three quetiapine). Of these subjects, four were taking another antipsychotic at the time of imaging (two clotiapine, one thioridazine, one quetiapine). The mean chlorpromazine-equivalent dose was 221.5 mg (see Table 1). Patients' clinical information was retrieved from psychiatric interviews, the attending psychiatrist and medical charts. Clinical symptoms were characterized using the Brief Psychiatric Rating Scale (BPRS, 24-item version; Ventura et al. Reference Ventura, Nuechterlein and Subotnik2000), which was administered by two trained research clinical psychologists. The reliability for the BPRS was established and monitored utilizing procedures similar to the IGC-SCAN.
Sociodemographic and clinical variables for healthy controls and patients with schizophrenia

BPRS, Brief Psychiatric Rating Scale; CPZeq, chlorpromazine equivalent dose.
Values are given as mean and standard deviation or number of participants.
Healthy control subjects had no DSM-IV Axis I disorders, as determined by a brief modified version of the Structured Clinical Interview for DSM-IV, non-patient version (SCID-NP), no history of psychiatric disorders among first-degree relatives, no history of alcohol or substance abuse and no current major medical illness. Typical control subjects were hospital or university staff volunteers or subjects undergoing MR scans for dizziness without evidence of central nervous system abnormalities on the scan, as determined by the neuroradiologist (R.C.). Dizziness was due to benign paroxysmal positional vertigo or to non-toxic labyrinthitis. Control individuals were scanned only after a full medical history had been taken, general neurological, otoscopic, and physical examinations carried out, and the patient had completely recovered from the dizziness. In addition, none of the control subjects was on medication at the time of participation in the study, including drugs for nausea or vertigo.
All participants gave signed informed consent, after having understood all issues involved in participation in the research, which was approved by the Biomedical Ethics Committee of the Azienda Ospedaliera of Verona.
MRI acquisition
MRI scans were acquired with a 1.5T Siemens Magnetom Symphony Maestro Class, Syngo MR 2002B (Siemans, USA). A standard head coil was used for radio frequency transmission and reception of the MR signal and restraining foam pads were utilized for minimizing head motion. T1-weighted images were first obtained to verify each subject's head position and image quality [TR=450 ms, echo time (TE)=14 ms, flip angle=90°, field of view (FOV)=230×230, 18 slices, slice thickness=5 mm, matrix size=384×512, NEX=2]. PD/T2-weighted images were then acquired (TR=2500 ms, TE=24/121 ms, flip angle=180°, FOV=230×230, 20 slices, slice thickness=5 mm, matrix size=410×512, NEX=2), according to an axial plane parallel to the anterior-posterior commissures (AC-PC), to exclude focal lesions. Subsequently, a coronal three-dimensional magnetization-prepared rapid gradient-echo (MP-RAGE) sequence was acquired (TR=2060 ms, TE=3.9 ms, flip angle=15°, FOV=176×235, slice thickness=1.25 mm, matrix size=270×512, TI=1100) to obtain 144 images covering the entire brain. Diffusion weighted echo-planar images (EPIs) in the axial plane parallel to the AC-PC line (TR=3200 ms, TE=94 ms, FOV=230×230, 20 slices, slice thickness=5 mm with 1.5 mm gap, matrix size=128×128, echo-train length=5; these parameters were the same for b=0, b=1000, and the ADC maps). Specifically, three gradients were acquired in three orthogonal directions.
MRI data processing and analysis
Anatomical image analysis
Anatomical imaging data were transferred to a personal computer workstation and analysed using the BRAINS2 software developed at the University of Iowa (http://www.psychiatry.uiowa.edu/mhcrc/IPLpages/BRAINS.htm). The amygdala was traced on the T1-weighted (MP-RAGE sequence) images in the coronal plane according to prior methods from our group (Brambilla et al. Reference Brambilla, Harenski, Nicoletti, Sassi, Mallinger, Frank, Kupfer, Keshavan and Soares2003). All measurements were done by a well-trained rater, who was blinded to subject's identity and achieved an inter-rater reliability (IRR) of r=0.98 for the right amygdala raw volumes, and r=0.91 for the left amygdala raw volumes, established by blindly tracing 10 randomly selected scans and calculated by intra-class correlation coefficient (ICC). The volumes (ml) were obtained by summing the volumes of all relevant slices and were expressed in cm3. ICV was traced in the coronal place along the border of the brain and included the cerebrospinal fluid (CSF), dura mater, sinus, optic chiasma, brainstem, cerebral and cerebellar matter. The inferior border did not extend below the base of the cerebellum. ICV measurements were obtained by a well-trained rater who achieved an IRR of 0.97 measured by ICCs and established by blindly tracing 10 randomly selected scans.
Diffusion image analysis
Images were displayed on a commercial Siemens workstation for the post-processing analyses, including the calculation of ADC values. ADC maps were obtained from the diffusion images with b=1000, according to the following equation: −bADC=ln [A(b)/A(0)], where A(b) is the measured echo magnitude, b is the measure of diffusion weighting and A(0) is the echo magnitude without diffusion gradient applied (Basser & Jones, Reference Basser and Jones2002). The resulting ADC was expressed in units of 10−5 mm2/s. Circular regions of interest (ROI) standardised at five pixels (corresponding to an area of 0.16 cm2 and including five pixels in total) were placed on both right and left amygdala grey matter on the non-diffusion weighted (b=0) EPIs. One axial slice below the mesencephalon was chosen and adjacent slices were checked to ensure that partial volume effects from CSF were minimized. Then, the ROIs were automatically transferred to the corresponding maps to obtain the ADC of water molecules. Two raters achieved high reliability established by tracing eight training scans, as defined by ICCs over 0.80 calculated by taking into consideration the mean ADC values. Then, the same rater, blind to study hypotheses, group assignment, and sociodemographic/clinical data, measured all scans.
Statistical analyses
SPSS for Windows software, version 17 (SPSS Inc., USA), was used to perform all statistical analyses, and the two-tailed statistical significance level was set at p<0.05. First, we compared demographic variables using Student's t test and Pearson's χ2, as appropriate. A general linear model (GLM) for repeated measures (hemisphere as repeated-measures factor) was used to compare the volumes of amygdala between patients with schizophrenia and healthy control subjects with age, gender and ICV as covariates. The same statistical method (GLM for repeated measures, hemisphere as repeated-measures factor) with the covariates age and gender was performed to compare ADCs of amygdala between the two groups. The assumption that the vector of the measures followed a multivariate normal distribution (Shapiro–Wilk test) and the variance–covariance matrices were circular in form (Mauchly's test) were verified. Univariate GLM was performed to compare the volumes and the ADCs of left and right amygdala between patients with schizophrenia and healthy control participants. The effect size, which is the difference in the observed means divided by the pooled standard deviation of the samples, was calculated for both volumes and ADC measurements. Effect sizes are generally considered small if 0.2, medium if 0.5, and large if 0.8 (Cohen, Reference Cohen1988). Pearson's correlation and Spearman's correlation analyses were used to explore possible association between age and clinical variables, respectively, and amygdalar volumes and ADC measures. In this case the Bonferroni correction was used for multiple comparisons considering three clusters of correlations: chronological age, clinical variables and scale measures.
Results
Volume and ADC measures
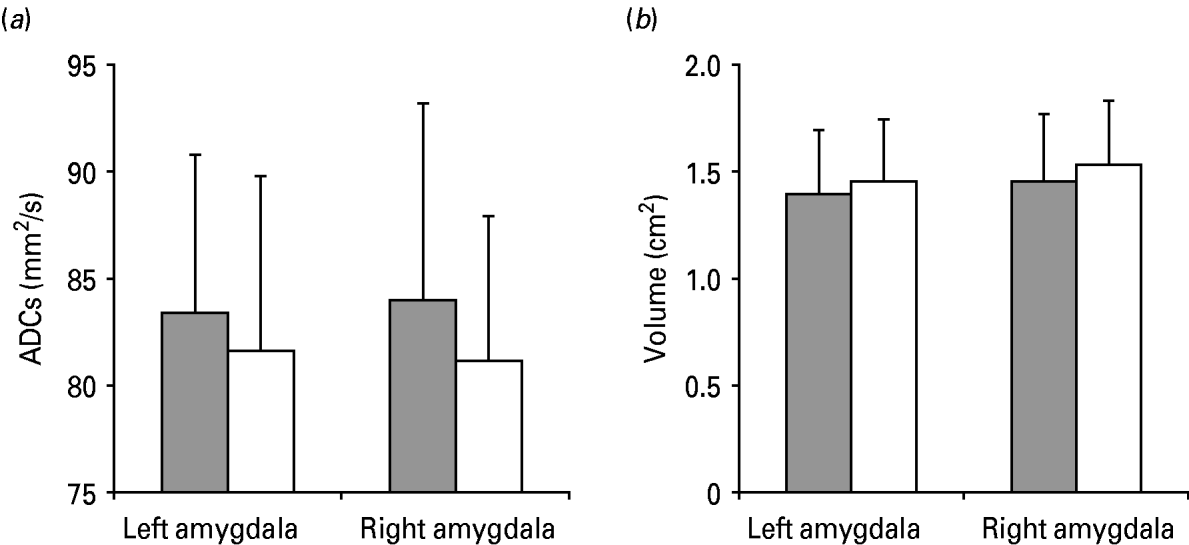
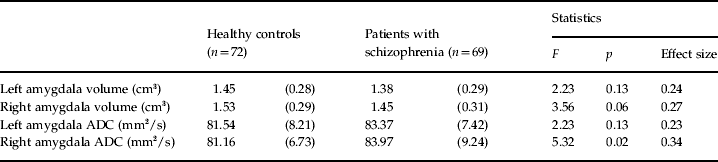
Left and right amygdala volumes did not significantly differ between patients with schizophrenia and healthy individuals [GLM for repeated measures, hemisphere as repeated-measures factor and age, gender and ICV as covariates: F(1, 136)=3.22, p=0.07, observed power=0.43] (Fig. 1b). No interaction between group and hemisphere was found [F(1, 136)=0.47, p=0.49]. The left amygdala volumes did not significantly differ between patients with schizophrenia and healthy individuals [univariate GLM, age, gender and ICV as covariates: F(1, 136)=2.2, p=0.13], whereas a trend, which did not reach statistical significance, was observed for the right amygdala volumes, being smaller in patients in respect to control subjects [univariate GLM, age, gender and ICV as covariates: F(1, 136)=3.56, p=0.06] (Table 2).
Apparent diffusion coefficients (ADCs) (a) and volumes (b) of amygdala in patients with schizophrenia ( ) and normal controls (□). Mean ADCs (mm2/s) and mean volumes (cm2) of the left and right amygdala are shown, with vertical bars representing standard deviations.

Left and right amygdalar volumes and ADCs in healthy controls and patients with schizophreniaFootnote a

ADC, Apparent diffusion coefficient; GLM, general linear model.
Values are given as mean (standard deviation).
a GLM for repeated measures was performed to compare volumes (with age, gender and intracranial volume as covariates: F=3.22, p=0.07) and ADC values (with age and gender as covariates: F=4.90, p=0.028) between patients with schizophrenia and normal controls. In the Table the statistics of the univariate GLM are reported.
In regard to ADCs, patients with schizophrenia had significantly greater ADC values compared with healthy individuals [GLM for repeated measures, hemisphere as repeated-measures factor and age and gender as covariates: F(1, 137)=4.90, p=0.028, observed power=0.59] (Fig. 1a). No interaction between group and hemisphere was shown [F(1, 137)=0.63, p=0.43]. Compared with the control group, patients with schizophrenia had significantly greater values for the right amygdala [univariate GLM, age and gender as covariates: F(1, 137)=5.3, p=0.02], whereas no significant differences were found for the left amygdala [univariate GLM, age and gender as covariates: F(1, 137)=2.23, p=0.13) (Table 2). Even when educational level and occupation were considered as covariates the ADC values for the right amygdala remained significantly reduced in patients suffering from schizophrenia in comparison with healthy controls (GLM for repeated measures, p<0.05). Also, no significant differences were found between the two control subgroups (GLM for repeated measures, age and gender as covariates, p>0.05). The calculated effect sizes in our present study were medium to small for both volumes and ADC values (Table 2).
Age and clinical variables
No correlation was found between age and amygdala volumes either in the control group (left side: r=0.08, p=0.50; right side: r=0.05, p=0.66) or in the schizophrenia group (left side: r=0.11, p=0.34; right side: r=−0.004, p=0.96). Age was significantly correlated with right amygdala ADC measures in the control group (r=−0.27, p=0.019), but not in the schizophrenia group (r=−0.19, p=0.11), although it did not survive the Bonferroni correction (p>0.05). No significant associations were found between age and left amygdala ADCs in both controls (r=−0.14, p=0.22) and patients (r=0.03, p=0.80).
No significant associations were found between clinical features (age at illness onset, length of illness, number of hospitalizations, antipsychotic lifetime medication, chlorpromazine-equivalent dose) and any of the anatomical or ADC measures (Spearman correlation coefficients, p>0.05, after Bonferroni correction).
BPRS scores for depression–anxiety were significantly directly correlated with both right and left amygdalar volumes (r=0.45, p=0.0002; r=0.41, p=0.001, respectively), even after Bonferroni correction (p=0.0008, p=0.004, respectively). Furthermore, significant direct correlations were found between BPRS scores for positive and mania/disorganization symptoms and left amygdalar volumes (r=0.34, p=0.008; r=0.33, p=0.009, respectively), even after Bonferroni correction (p=0.032, p=0.036, respectively).
Discussion
This MRI study showed that the ADCs for the right amygdala were significantly greater in patients with schizophrenia compared with healthy controls, with a trend for significantly decreased volumes. By contrast, left amygdalar size and ADC measures did not significantly differ between groups. In this study we combined the analyses of both amygdalar volumes and microstructural organization in schizophrenia, reporting a dissociation between altered integrity of the right amygdala, as shown by increased ADC values, and partially preserved volumes.
Microstructural integrity measures versus volumetric imaging
Our results show that schizophrenia is associated with an abnormally increased water diffusivity in the right amygdala, suggesting that changes of amygdalar tissue composition in schizophrenia may not necessarily affect the structural gross volume and should be investigated at a cytoarchitectural level. DWI provides evidence of tissue disruption even when conventional volumetric quantification fails to detect size differences between patients and controls (DeLisi et al. Reference DeLisi, Szulc, Bertisch, Majcher, Brown, Bappal, Branch and Ardekani2006), being a complementary neuroimaging strategy to structural imaging. In our study ROIs were placed in the grey matter of the amygdala, being consistent with the finding showing grey matter alterations in schizophrenia (Wright et al. Reference Wright, Ellison, Sharma, Friston, Murray and McGuire1999; Steen et al. Reference Steen, Mull, McClure, Hamer and Lieberman2006). ADC has been used by previous DWI studies to explore grey matter deficits, such as in patients with traumatic brain injury (Hou et al. Reference Hou, Tong, Ashwal, Oyoyo, Joo, Shutter and Obenaus2007; Galloway et al. Reference Galloway, Tong, Ashwal, Oyoyo and Obenaus2008), obsessive–compulsive disorder (Nakamae et al. Reference Nakamae, Narumoto, Shibata, Matsumoto, Kitabayashi, Yoshida, Yamada, Nishimura and Fukui2008) or schizophrenia (Shin et al. Reference Shin, Kwon, Ha, Park, Kim, Hong, Moon, Lee, Kim, Kim and Chung2006). Furthermore, it has been shown by MR spectroscopy (MRS) investigations that in healthy subjects N-acetyl aspartate (NAA), a marker of neuronal integrity/functioning, negatively correlates with ADC (Irwan et al. Reference Irwan, Sijens, Potze and Oudkerk2005). Therefore, increased right amygdalar ADCs reported in our study are consistent with reduced NAA in the same region shown in MRS reports (Nasrallah et al. Reference Nasrallah, Skinner, Schmalbrock and Robitaille1994).
Increased ADC values may probably reflect disruption of the composition of the extracellular interneuronal space, which may cause an alteration in the neuronal and glial cross-talk mediated by neurotransmitters. Abnormalities of neurotransmission systems, such as dopamine, glutamate or γ-amino butyric acid, have strongly been suggested as the core of the pathophysiology of schizophrenia. A model based on the glutamate neurotransmitter hypothesis (Aleman & Kahn, Reference Aleman and Kahn2005) could explain amygdalar volume reductions in patients with schizophrenia. Prolonged hyperactivation of the amygdala during psychotic states could lead to excessive glutamatergic activity and excitotoxicity, resulting in amygdalar lesions and long-term hypofunctioning (Hulshoff Pol et al. Reference Hulshoff Pol, Schnack, Mandl, van Haren, Koning, Collins, Evans and Kahn2001). However, what exactly an ADC increase is caused by is still a matter of investigation, being both intracellular and extracellular space sources of ADC. This is indeed an average of water molecule diffusivity within a selected ROI. Volume fraction alterations of extracellular/intracellular spaces and changes of neuronal cytoskeleton may therefore increase ADC measurements (Syková, Reference Syková2004). In this perspective, our findings may also suggest a reduced dendritic arborization, which has consistently been found in chronic schizophrenia (Sweet et al. Reference Sweet, Henteleff, Zhang, Sampson and Lewis2009). ADC may also be used as a potential marker for alterations in neuron density or for cortical volume deficit (Syková, Reference Syková2004; Ardekani et al. Reference Ardekani, Bappal, D'Angelo, Ashtari, Lencz, Szeszko, Butler, Javitt, Lim, Hrabe, Nierenberg, Branch and Hoptman2005). In this regard, elevation of the sulcal and ventricular CSF volume accompanies cortical brain atrophy (Narr et al. Reference Narr, Sharma, Woods, Thompson, Sowell, Rex, Kim, Asuncion, Jang, Mazziotta and Toga2003; Davis et al. Reference Davis, Kwon, Cardenas and Deicken2004) and results in a higher ADC. Therefore, increases in ADC level may suggest replacement of brain parenchyma by CSF, or volume loss. However, our results partially match this view, because a disrupted tissue organization of the right amygdala was found, despite its partially preserved size. Moreover, a post-mortem examination on amygdalar neuron number by Pakkenberg (Reference Pakkenberg1990) showed no significant alteration in subjects with schizophrenia, although only the basolateral nucleus was included and not the whole region.
Right amygdala abnormalities may be involved in the altered emotional processing in schizophrenia, as supported by the correlations with affective symptoms. Our results are in line with the view proposing that the right hemisphere hypersensitivity to emotional material may play a crucial role for the functional basis of schizophrenia (Oepen et al. Reference Oepen, Funfgeld, Holl, Zimmermann, Landis and Regard1987; Kosaka et al. Reference Kosaka, Omori, Murata, Iidaka, Yamada, Okada, Takahashi, Sadato, Itoh, Yonekura and Wada2002; Exner et al. Reference Exner, Boucsein, Degner, Irle and Weniger2004). It should also be noted that clinical variables (i.e. age at onset, length of illness, number of hospitalizations) as well as antipsychotic treatment and dose did not apparently affect amygdalar measurements. In this regard, there are conflicting findings between studies reporting that psychotropic medications might affect amygdala size (Tebartz van Elst et al. Reference Tebartz, Bäumer, Ebert and Trimble2004) and those suggesting little influence of neuroleptics (Schneider et al. Reference Schneider, Weiss, Kessler, Salloum, Posse, Grodd and Muller-Gartner1998; Whittaker et al. Reference Whittaker, Deakin and Tomenson2001; Kosaka et al. Reference Kosaka, Omori, Murata, Iidaka, Yamada, Okada, Takahashi, Sadato, Itoh, Yonekura and Wada2002). Clearly, studying unmedicated first-episode patients with schizophrenia will provide a further opportunity to assess whether microstructural abnormalities are present prior to the administration of neuroleptic treatment.
Correlation with psychopathological measures
Interestingly, significant direct correlations were found between depression–anxiety, mania and positive symptoms and amygdalar volumes. Psychopathology was measured by the BPRS, which was divided into subscales in accordance with a prior validated method (Ruggeri et al. Reference Ruggeri, Koeter, Schene, Bonetto, Vazquez-Barquero, Becker, Knapp, Knudsen, Tansella and Thornicroft2005). Positive correlations between amygdalar size and depression severity have previously been reported in other diseases, such as borderline personality disorder (Zetzsche et al. Reference Zetzsche, Frodl, Preuss, Schmitt, Seifert, Leinsinger, Born, Reiser, Moller and Meisenzahl2006) and autism (Juranek et al. Reference Juranek, Filipek, Berenji, Modahl, Osann and Spence2006). It is of interest that amygdala dysfunction is implicated in the development of depressive disorders (Drevets, Reference Drevets1998, Reference Drevets and McGinty1999) as well as anxiety disorders (Birbaumer et al. Reference Birbaumer, Grodd, Diedrich, Klose, Erb, Lotze, Schneider, Weiss and Flor1998; Garakani et al. Reference Garakani, Mathew and Charney2006; Talarovicova et al. Reference Talarovicova, Krskova and Kiss2007). Altered amygdalar activation has been reported in anxiety-prone subjects who had higher scores on several measures assessing anxiety proneness (e.g. neuroticism, trait anxiety and anxiety sensitivity) (Stein et al. Reference Stein, Simmons, Feinstein and Paulus2007). The association between amygdalar volume and depressionn–anxiety symptoms suggests that amygdalar abnormalities may be a predisposing factor for increased stress sensitivity. Our findings thus suggest that the amygdala plays a major role in modulating emotions, including depressive, manic and anxious symptoms, in schizophrenia and not only in mood-related disorders. In this regard, it is of interest to note that a prior diffusion tensor imaging (DTI) study (Leitman et al. Reference Leitman, Hoptman, Foxe, Saccente, Wylie, Nierenberg, Jalbrzikowski, Lim and Javitt2007) showed that reduced fractional anisotropy of the amygdala contributes to the inability of patients with schizophrenia in decoding emotional aspects of speech, which is crucial for a preserved social communication (Bellani & Brambilla, Reference Bellani and Brambilla2008; Bellani et al. Reference Bellani, Marzi and Brambilla2009). Therefore, emotions and anxiety should consistently be taken into consideration by future imaging studies in schizophrenia, which may potentially guide further efforts towards developing treatment interventions for alleviating affective symptoms.
Limitations of the study
First, in our study, although we recruited a large number of patients, accurately matching them to control individuals in order to not increase variability, we did not involve first-episode patients, our sample being composed primarily by chronic treated patients. Therefore, we cannot establish whether the amygdala disruption is present early in the course of the illness, or whether it develops over time as a result of the illness course or of psychotropic treatment. Second, part of our control group was selected from individuals undergoing MR scanning for dizziness, which may represent a methodological limitation. However, they were fully recovered at the time of imaging and had no evidence of central nervous system abnormalities on the scan; auditory evoked potentials were not investigated in these subjects. Future studies involving larger samples of high-risk and first-episode patients, as well as long-term follow-up studies, will be needed to characterize whether abnormalities in amygdala structure precede the appearance of symptoms, or appear afterwards, as a result of illness course. Third, the diffusion images were not acquired during cardiac gated imaging and the diffusion tensor sequence (DTI) was not collected. However, both DWI and DTI provide information on subtle tissue organization even when conventional structural MRI fails to detect gross anatomical abnormalities (Basser & Jones, Reference Basser and Jones2002; Taylor et al. Reference Taylor, Hsu, Krishnan and MacFall2004). In this regard, our DWI protocol, being relatively short, has the potential to be added to any conventional volumetric scan, representing a clinical and scientific advantage for the evaluation of brain microstructure organization in schizophrenia in the real world of psychiatric practice.
Conclusions
In conclusion, this study provides evidence of disrupted amygdala cytoarchitecture in the right side, in the presence of minimally preserved volumes, in a large sample of patients with schizophrenia representative of those living in the geographically defined catchment area of South Verona, Italy (i.e. 100 000 inhabitants). Such abnormalities may result from a reduced microstructural integrity of this area or may reflect a reduced dendritic arborization, ultimately leading to abnormal emotional processing in schizophrenia. This study thus confirms the role of the amygdala in the pathophysiology of schizophrenia, which may be related to microscopic alterations detectable by the DWI technique added to any conventional scan session.
Acknowledgements
This work was partly supported by grants from the American Psychiatric Institute for Research and Education (APIRE Young Minds in Psychiatry Award), the Italian Ministry for Education, University and Research (PRIN no. 2005068874), the Veneto StartCup 2007 to P.B. and by a grant from Regione Veneto, Italy (159/03, DGRV no. 4087).
Declaration of Interest
None.