



Introduction
Long before infants produce their first words, the language(s) they hear, the sounds they produce, and their interactions with caregivers, provide critical and necessary building blocks to acquire increasingly complex language. Mounting evidence suggests that variation in the nature and timing of early language input, even within the first year of life, can have a unique and lasting impact on language outcomes across the lifespan (e.g., Kuhl, Reference Kuhl2004; Pierce, Genesee, Delcenserie & Morgan, Reference Pierce, Genesee, Delcenserie and Morgan2017; Werker & Hensch, Reference Werker and Hensch2015). Critically, differences in socioeconomic status (SES) have been associated with variation in both the quantity and quality of language that children hear (Brito, Reference Brito2017; Fernald, Marchman, Weisleder, Reference Fernald, Marchman and Weisleder2013; Gilkerson, Richards, Warren, Oller, Russo & Vohr, Reference Gilkerson, Richards, Warren, Oller, Russo and Vohr2018; Hart & Risley, Reference Hart and Risley1995; Hoff, Reference Hoff2003; Reference Hoff2006; Nelson, Welsh, Trup & Greenberg, Reference Nelson, Welsh, Trup and Greenberg2011; Noble, McCandliss & Farah, Reference Noble, McCandliss and Farah2007; Weisleder & Fernald, Reference Weisleder and Fernald2013), with children raised in low-, compared to high-SES contexts hearing, on average, fewer words and less complex language, and experiencing fewer child-directed interactions. These disparities have led to numerous reports of a “30-million-word gap” between children at opposite ends of the socioeconomic spectrum by the time they reach preschool. However, mounting evidence demonstrates that, despite robust differences, on average, between socioeconomic groups, there is considerable variation in the quantity and quality of children's language input, even within a low SES context (e.g., Gilkerson, Richards, Warren, Montgomery, Greenwood, Kimbrough Oller, Hansen & Paul, Reference Gilkerson, Richards, Warren, Montgomery, Greenwood, Kimbrough Oller, Hansen and Paul2017; Weisleder & Fernald, Reference Weisleder and Fernald2013). For example, Weisleder and Fernald (Reference Weisleder and Fernald2013) found that adult word counts within a predominantly low-SES sample of 19-month-old children ranged from less than 2,000 to more than 29,000 words within a 10-hour recording and counts of child-directed words ranged from 670 to 12,000.
Although considerable individual variability in the early language environment exists within low-SES contexts, it is not well understood which specific variables influence the quantity and quality of early child and caregiver speech, nor specific pathways by which those variables are associated with later language outcomes (Pace, Luo, Hirsh-Pasek & Golinkoff, Reference Pace, Luo, Hirsh-Pasek and Golinkoff2017). Substantial evidence suggests that higher levels of maternal education result in more, and better quality, early language interactions (Hart & Risley, Reference Hart and Risley1995; Hoff Reference Hoff2003; Huttenlocher, Vasilyeva, Waterfall, Vevea & Hedges, Reference Huttenlocher, Vasilyeva, Waterfall, Vevea and Hedges2007); however, the question of which specific factors associated with maternal education are responsible for those associations (e.g., access to resources etc.) has received less attention (but see Hoff & Ginsberg, Reference Hoff and Ginsberg1991; Rowe, Reference Rowe2008). At the same time, high levels of maternal stress might diminish the quality of early caregiver-child interactions; for example, by reducing opportunities for the kinds of sensitive, contingent interactions that have been found to benefit child language outcomes (e.g., Weisleder & Fernald, Reference Weisleder and Fernald2013), and/or by influencing children's ability to elicit such interactions as a result of stress-based alterations to their own early neurodevelopment. Indeed, both early stress (e.g., Pierce, Thompson, Gharib, Schlueter, Reilly, Valdes, Roberts, Conroy, Levitt & Nelson, Reference Pierce, Thompson, Gharib, Schlueter, Reilly, Valdes, Roberts, Conroy, Levitt and Nelson2019) and SES have been found to impact neurodevelopment in language-relevant brain regions (e.g., Merz, Maskus, Melvin, He & Noble, Reference Merz, Maskus, Melvin, He and Noble2020; Pavlakis, Noble, Pavlakis, Ali & Frank, Reference Pavlakis, Noble, Pavlakis, Ali and Frank2015; Romeo, Leonard, Robinson, West, Mackey, Rowe & Gabrieli, Reference Romeo, Leonard, Robinson, West, Mackey, Rowe and Gabrieli2018) in early childhood and beyond. However little work to date has explored these associations during infancy.
Exploring associations between maternal stress, early language, and neurodevelopment during infancy is important because the developmental stage of the child is likely to influence which aspects of early language are affected by SES-related variables, and how. Prior research has found that SES effects on language outcomes (e.g., vocabulary size, processing speed) typically emerge by about 18 months of age, on average (e.g., Fernald et al., Reference Fernald, Marchman and Weisleder2013), and can persist into adulthood, often impacting increasingly complex language and literacy skills (e.g., Pakulak & Neville, Reference Pakulak and Neville2010). However, because of the hierarchical and bidirectional nature of language development (see Werker, Reference Werker2018 for a review) it is possible that factors in the very early language environment might impact the development of foundational language abilities even earlier, within the first year of life. For example, factors that influence how much a child vocalizes, or how many language-rich interactions they experience with a caregiver, might influence early language acquisition in a manner that precedes and predicts the later language outcomes typically found to be associated with SES variables. Understanding how SES impacts the very early language environment is necessary to determine both when SES-related language differences emerge and how they manifest across childhood.
During the first years of life the brain undergoes rapid change as it develops and adapts to the unique environment to which it is exposed (e.g., Greenough, Black & Wallace, Reference Greenough, Black and Wallace1987; Werker & Hensch, Reference Werker and Hensch2015). An optimal way to measure neurodevelopment during infancy is to use electroencephalography (EEG), which is non-invasive and well-tolerated by infants (e.g., Saby & Marshall, Reference Saby and Marshall2012; Xie & Reference Xie, Nelson, Huang and RobertNelson, in press). Oscillatory patterns in the power spectrum of resting or baseline EEG have been found to reflect properties of cortical maturation (e.g., Cuevas & Bell, Reference Cuevas and Bell2011; Eisermann, Kaminska, Moutard, Soufflet & Plouin, Reference Eisermann, Kaminska, Moutard, Soufflet and Plouin2013; Hudspeth & Pribram, Reference Hudspeth and Pribram1992), including increased neural synchrony, and development of cortico-cortical connections and functional networks believed to underlie complex cognitive processes and language (e.g., Uhlhaas, Roux, Singer, Haenschel, Sireteanu & Rodriguez, Reference Uhlhaas, Roux, Singer, Haenschel, Sireteanu and Rodriguez2009). Specifically, studies with infants and young children have revealed that early EEG development is characterized by a relative decrease in power in low frequency bands (e.g., delta and theta) along with a relative increase in power in high frequency bands (e.g., beta and gamma) (Clarke, Barry, McCarthy & Selikowitz, Reference Clarke, Barry, McCarthy and Selikowitz2001; John, Ahn, Prichep, Trepetin, Brown & Kaye, Reference John, Ahn, Prichep, Trepetin, Brown and Kaye1980). This pattern is thought to index a developmental shift in the ratio of short- to long-range connections, indicative of an increasingly mature functional organization of the brain (e.g., Thatcher, North & Biver, Reference Thatcher, North and Biver2008). At the same time, evidence suggests that the development of high frequency beta and gamma activity in particular facilitates the functional networks required for the binding or integration of information, such as the temporally distributed auditory signals that make up language (e.g., Csibra, Davis, Spratling & Johnson, Reference Csibra, Davis, Spratling and Johnson2000; Fries, Reference Fries2009), and may also support perceptual attunement to the native language during the first year of life (Ortiz-Mantilla, Hämäläinen, Realpe-Bonilla & Benasich, Reference Ortiz-Mantilla, Hämäläinen, Realpe-Bonilla and Benasich2016).
Evidence also suggests that oscillatory patterns in baseline EEG in infancy are associated with language outcomes in childhood. For example, Gou, Choudhury, and Benasich (Reference Gou, Choudhury and Benasich2011) found that resting gamma power (31–50 Hz), recorded from frontal electrode sites when children were 16, 24, and 36 months of age, was positively correlated with non-word repetition, and receptive and expressive language scores both when assessed concurrently (Benasich, Gou, Choudhury & Harris, Reference Benasich, Gou, Choudhury and Harris2008) as well as when children were 4 and 5 years old. Gamma power was also observed to be lower in children with a family history of language delay, which was interpreted as a developmental lag that might contribute to the delayed development of complex skills necessary for normative language development (Benasich et al., Reference Benasich, Gou, Choudhury and Harris2008). Similarly, frontal gamma power at 24 months has been positively associated with expressive language abilities in children at high risk for autism spectrum disorder (ASD; Wilkinson, Levin, Gabard-Durnam, Tager-Flusberg & Nelson, Reference Wilkinson, Levin, Gabard-Durnam, Tager-Flusberg and Nelson2019a), while delta and theta power at 6 months was negatively associated with 24 month language outcomes in this high risk group (Wilkinson, Gabard-Durnam, Kapur, Tager-Flusberg, Levin & Nelson, Reference Wilkinson, Gabard-Durnam, Kapur, Tager-Flusberg, Levin and Nelson2019b). This same study also found that developmental trajectories of power from 3 to 24 months in both the theta and gamma frequency ranges predicted 24-month language outcomes for children with and without ASD risk (Wilkinson et al., Reference Wilkinson, Gabard-Durnam, Kapur, Tager-Flusberg, Levin and Nelson2019b).
Among individuals who experienced significant psychosocial adversity early in life compared to those who did not, higher posterior theta, and lower frontal and temporal alpha and beta power has been observed from infancy (Marshall, Fox & BEIP Core Group, Reference Marshall and Fox2004). Effects on the EEG were found to persist through age 16 (Debnath, Tang, Zeanah, Nelson & Fox, Reference Debnath, Tang, Zeanah, Nelson and Fox2020). Similarly, decreased high frequency power (beta and gamma) has been observed in infants from low-SES backgrounds, and those exposed to high levels of maternal stress, from as young as 2–6 months of age (Brito, Fifer, Myers, Elliott & Noble, Reference Brito, Fifer, Myers, Elliott and Noble2016; Pierce et al., Reference Pierce, Thompson, Gharib, Schlueter, Reilly, Valdes, Roberts, Conroy, Levitt and Nelson2019; Tomalski, Moore, Ribeiro, Axelsson, Murphy, Karmiloff-Smith, Johnson, M.H. & Kushnerenko, Reference Tomalski, Moore, Ribeiro, Axelsson, Murphy, Karmiloff-Smith, Johnson and Kushnerenko2013). Patterns such as these have been linked to lower cognitive and language scores in infancy and childhood, are thought to reflect delayed developmental maturation and have been linked to lower cognitive and language scores in infancy and childhood (e.g., Benasich et al., Reference Benasich, Gou, Choudhury and Harris2008; Brito et al., Reference Brito, Fifer, Myers, Elliott and Noble2016; Marshall et al., Reference Marshall and Fox2004; Tarullo, Obradović, Keehn, Rasheed, Siyal, Nelson & Yousafzai, Reference Tarullo, Obradović, Keehn, Rasheed, Siyal, Nelson and Yousafzai2017). Supporting this claim, a recent study found that higher gamma power (25-45 Hz; left-central electrode sites) when infants were 6 months of age mediated an association between SES and language outcomes (expressive language and mean length of utterance) when children were 24 months of age, also suggesting that patterns of early gamma power might help to detect infants at risk for language impairment (Cantiani, Ortiz-Mantilla, Riva, Piazza, Bettoni, Musacchia & Benasich, Reference Cantiani, Ortiz-Mantilla, Riva, Piazza, Bettoni, Musacchia and Benasich2019).
Because considerable variation in the quantity and quality of language input exists within a low-SES context, and because such variation has implications for both neurodevelopment and language outcomes across childhood, understanding the sources of that early variation is critical for determining pathways by which early experience maps onto later language and literacy outcomes. However, little research to date has explored which factors within a low-SES context might influence the early language environment, whether variation in child language behaviors and parent-child interactions might be evident even earlier in development than when SES-effects on language outcomes are typically observed, nor whether associations between early language behaviors and neurodevelopment are present within the first year of life. To address these questions, the present exploratory study used the Language Environment Analysis (LENA) system to collect all-day natural language samples from a socioeconomically diverse sample of infants during their first year of life to 1) assess whether maternal reports of stress and SES-related variables (e.g., maternal education, family income, levels of community poverty) are associated with infant and caregiver language behaviors (i.e., number of adult words, child vocalizations, or caregiver-child interactions) during the earliest stages of language acquisition, and 2) whether these early language behaviors are associated with early neurodevelopment using electroencephalography (EEG). Building on prior research with older children in low-SES contexts we predict maternal reports of stress to be negatively associated with amount of adult speech and number of caregiver-child interactions during the first year of life. Number of child vocalizations is also expected to be lower within a low-SES/high stress context as these factors are associated with child language later in childhood. We further predict that more adult input and caregiver-child interactions should be associated with a more “mature” pattern in baseline EEG (i.e., higher power in high frequency bands (beta and gamma) and lower power in low frequency bands (delta and theta)). In particular we predict early language interactions to be positively associated with frontal gamma power.
Method
Participants
Language Environment Analysis (LENA) recordings were obtained from a subset of infants being followed longitudinally as part of a cohort study examining responses to early adversity (e.g., Pierce et al., Reference Pierce, Thompson, Gharib, Schlueter, Reilly, Valdes, Roberts, Conroy, Levitt and Nelson2019). LENA recordings were completed when infants were 6 (n = 16; 9 female; mean age = 6;14 months, range = 5;24–7;9 months) and 12 months (n = 22; 12 female; mean age = 12;18 months, range = 11;21–13;24 months) of age, on average. Participants were recruited from Boston Children's Hospital Primary Care Center (CHPCC), which predominantly serves families from low-income backgrounds (i.e., qualify for public health insurance). Exclusion criteria were: birth prior to 37 weeks gestational age, low birth weight (< 2500 grams), identified genetic, metabolic, or neurological disorder, uncorrected vision difficulties, or birth related complications (e.g., extended stay in NICU). Written, informed consent was provided by parents or guardians for all participants. The Institutional Review Board of the local institution approved all procedures.
Background and demographic information
Standard demographic information was collected from families at study enrollment when infants were 2 months of age, on average (Table 1). Family income and maternal education were assessed categorically with participants indicating which bracket best represented their particular circumstances (Family income: 9 categories ranging from <$5,000 to $100,000 or more in the last 12 months; Maternal education: 8th grade or less, some high school, high school/GED, Associate's Degree, Bachelor's Degree, Master's Degree, M.D., Ph.D., J.D., or equivalent). Participant zip codes were used to obtain American Community Survey (ACS) 5-year 2015 average census tract data for each participant. From that, percentage of households below the poverty line within each participant's neighborhood, or census tract, was obtained. Percentage of households below the poverty line does not reflect individual family income (i.e., families could report individual income that is higher or lower than neighborhood averages), but reflects the average level of poverty within the broader community. Because not all participants reported family income, and because community-based measures provide an additional source of information about family socioeconomic context, neighborhood poverty levels were used as an additional socioeconomic marker (Krieger, Chen, Waterman, Soobader, Subramanian & Carson, Reference Krieger, Chen, Waterman, Soobader, Subramanian and Carson2003).
Demographic information collected from mother-infant dyads at time of each recording sessiona

a For each demographic variable, number (%) of participants who contributed data is listed along with mean (SD) on that variable when relevant.
b,d,e,f Number of participants that fall into category; cObtained from census data and refers to the mean percentage of households within participants’ census tract that reported family income below the poverty level for census year 2015;
Maternal stress
Exposure to recent stressful life events (e.g., financial difficulties; neighborhood violence) was assessed using a revised 14-item Recent Life Events Questionnaire (RLEQ; based on Brugha, Bebbington, Tennant & Hurry, Reference Brugha, Bebbington, Tennant and Hurry1985). Because both pre- and post-natal stress has been found to influence early neurodevelopment we asked about events that occurred both during pregnancy and since the birth of the child. Maternal appraisals of stress were assessed using the validated and normed 10-item Perceived Stress Scale (PSS; Cohen & Janicki-Deverts, Reference Cohen and Janicki-Deverts2012; Cohen, Kamarck & Mermelstein, Reference Cohen, Kamarck and Mermelstein1983). RLEQ and PSS scores from the 2-month time point alone were used in subsequent analyses in order to match the collection time of SES variables; however, responses on both scales were found to be stable across the first year (2, 6, 9, 12 months; RLEQ: ICC = .413, p = 0.00, Cronbach's alpha = .738; PSS: ICC = .475, p = 0.00, Cronbach's alpha = .844).
Language recordings
Full-day (up to 16 hour) LENA recordings were obtained from infants in their homes when they were 6 and 12 months of age, on average. Infants wore a special vest with a pocket to hold the LENA recorder. Parents were instructed to complete the recording on a typical day at home, when no special activities were planned. Follow up phone calls with families confirmed that the day of recording represented a typical day for the child. Raw recording lengths ranged from 8 hours 47 minutes to 16 hours at 6 months (14/16 recordings contained the complete 16 hours) and 2 hours 4 minutes to 16 hours at 12 months (18/22 recordings contained the complete 16 hours). Raw recordings were processed to remove naps, distant speech, and segments with poor recording quality that might contribute to inaccurate vocalization estimates (e.g., Marchman, Martínez, Hurtado, Grüter & Fernald, Reference Marchman, Martínez, Hurtado, Grüter and Fernald2017), which resulted in average recording lengths of 10 hours 8 minutes at 6 months (SD: 0.07; range: 7 hours 51 minutes to 13 hours 30 minutes) and 10 hours 6 minutes at 12 months (SD: 0.12; range: 4 hours 23 minutes to 15 hours 45 minutes). Based on LENA recommendations, recordings of less than 2 hours were excluded from subsequent analysis. All recordings were included from the 6-month time point. Twenty recordings were included from the 12-month time point (2 excluded for duration).
Automated measures were calculated from the recordings using LENA software. These included adult word counts (AWC), or number of adult words produced near the child, child vocalization counts (CVC), or number of language-related vocalizations produced by the child, not including cries, laughs, or vegetative sounds, and conversational turn counts (CTC), or number of adult-child vocalization pairs that occurred within 5 seconds of each other. To adjust for differences in recording length all measures were divided by total recording time to derive AWC/hour, CVC/hour, and CTC/hour. These hourly values were used in all subsequent analyses.
Baseline EEG
Infant recordings were completed at 6 and 12 months using a 128-Channel Sensor Net System (EGI, Inc., Eugene, OR, USA) composed of an elastic tension structure with 128 vertices evenly distributed across the scalp surface, each composed of an Ag/AgCl-coated, carbon-filled plastic electrode with a small plastic sponge. Prior to application, the sensor net was soaked in a salt-water solution (1L distilled water + 2 tsp potassium chloride (KCl) + 5 mL Baby Shampoo) warmed to body temperature. Electrooculographic electrodes were removed from the net to enhance infants’ tolerance.
Recordings were completed in a dimly lit electrically shielded room. Infants were positioned 60 cm from a computer monitor (Dell Model #P2314Ht, 49 cm x 29 cm) facing forward on their caregiver's lap. EEG was recorded using a NetAmps 300 Amplifier and NetStation Version 4.5.4 (EGI, Inc, Eugene, OR, USA). Data were amplified, filtered (bandpass 0.1-100.0 Hz), and sampled at a frequency of 500 Hz while infants watched a video of infant toys for up to 5 minutes. Impedances were kept under 100 kiloohms, on average. A trained researcher engaged minimally with the infant using a rain stick toy and bubbles to re-direct infants’ attention towards the screen only when necessary. Of the 16 infants who provided LENA recordings at 6 months all completed EEG recordings. Of those, 3 were excluded for poor data quality post-processing (exclusion criteria in following section) resulting in 13 infants with both LENA and EEG data at 6 months. Of the 20 infants who provided usable LENA recordings at 12 months 19 completed EEG recordings (1 net refusal). Of those, 1 was excluded for poor data quality post-processing resulting in 18 infants with both LENA and EEG data at 12 months.
EEG analysis
Raw EEG data files were exported from NetStation 4.5.4 in MATLAB file format (MathWorks, Inc) and pre-processed using the Harvard Automated Processing Pipeline for Electroencephalography (HAPPE; Gabard-Durnam, Mendez Leal, Wilkinson & Levin, Reference Gabard-Durnam, Mendez Leal, Wilkinson and Levin2018), an automated EEG processing pipeline optimized for use with infant data and used with MATLAB version 2014b and EEGLAB version 14.0.0b (Delorme & Makeig, Reference Delorme and Makeig2004). HAPPE was embedded within the Batch EEG Automated Processing Platform (BEAPP; Levin, Méndez Leal, Gabard-Durnam & O'Leary, Reference Levin, Méndez Leal, Gabard-Durnam and O'Leary2018), used for subsequent spectral analysis. Within HAPPE, data were band-pass filtered at 1-249 Hz. A subset of 46 channels was selected for further processing, including standard 10-20 and additional electrodes (10-20: Fp1, Fp2, F7, F3, Fz, F4, F8, C3, C4, T3, T4, T5, T6, P3, P4, Pz, O1, O2; additional: 3, 4, 13, 19, 20, 23, 27, 28, 40, 41, 46, 47, 66, 67, 71, 72, 75, 76, 77, 84, 98, 102, 103, 109, 112, 117, 118, 123). Electrode number and location were selected based on recording length (Gabard-Durnam et al., Reference Gabard-Durnam, Mendez Leal, Wilkinson and Levin2018) and previous infant reports (e.g., Tierney, Gabard-Durnam, Vogel-Farley, Tager-Flusberg & Nelson, Reference Tierney, Gabard-Durnam, Vogel-Farley, Tager-Flusberg and Nelson2012; Tomalski et al., Reference Tomalski, Moore, Ribeiro, Axelsson, Murphy, Karmiloff-Smith, Johnson and Kushnerenko2013). HAPPE uses CleanLine (Mullen, Reference Mullen2012) to remove 60 Hz electrical line-noise, and wavelet-enhanced independent component analysis (w-ICA) along with a Multiple Artifact Rejection Algorithm (MARA; Winkler, Haufe & Tangermann, Reference Winkler, Haufe and Tangermann2011; Winkler, Brandl, Horn, Waldburger, Allefeld & Tangermann, Reference Winkler, Brandl, Horn, Waldburger, Allefeld and Tangermann2014) to correct artifacts such as high-amplitude eye and motor movements (Jung, Humphries, Lee, Makeig, McKeown, Iragui & Sejnowski, Reference Jung, Humphries, Lee, Makeig, McKeown, Iragui, Sejnowski, Jordan, LeCun and Solla1998). Cleaned data were segmented into 2-second segments. Segments with remaining artifact were removed via amplitude-based (+/− 40 uV) criteria before data were re-referenced to the average.
Power spectra were extracted from EEG segments using the BEAPP processing pipeline (Levin et al., Reference Levin, Méndez Leal, Gabard-Durnam and O'Leary2018). A fast Fourier transform (FFT) with a multi-taper window was used to calculate a power spectrum on each segment for each channel. For each participant, the average power spectral density (PSD) across all segments was calculated. Log10 transformed absolute spectral data were averaged for each frequency band of interest: delta (2-4 Hz), theta (4-6 Hz), low alpha (6-9Hz), high alpha (9-13Hz), beta (13-30 Hz) and gamma (30-50Hz), across all included electrodes. Frequency band ranges were chosen based on prior infant research, as well as best practice recommendations deployed in our EEG processing software (e.g., Levin et al., Reference Levin, Méndez Leal, Gabard-Durnam and O'Leary2018; Orekhova, Stroganova, Posikera & Elam, Reference Orekhova, Stroganova, Posikera and Elam2006; Saby & Marshall, Reference Saby and Marshall2012; Xie & Nelson, in press). Relative spectral power was calculated as power within each frequency band divided by total power within both whole brain (all included electrodes) and frontal (F3, F4, Fz, 3, 4, 19, 23) regions of interest. Participants were excluded if data did not meet sufficient quality requirements (< 20 2-second segments, > 9 channels interpolated during processing, >70% rejected independent components, mean and median probability of artifact in remaining independent components > 0.3). Individual and average log10 transformed 6- and 12-month EEG power distributions, at whole brain and frontal regions, are presented in Figure 1.
Distribution of log10 transformed EEG power for whole brain and frontal electrode locations at 6- and 12-month time points. Light grey lines represent individual participant data while black lines represent each group mean. EEG frequency in hertz is plotted on the x-axis and log10 transformed power in microvolts squared is plotted on the y-axis.

Statistical analysis
All variables were tested for normality using the Shapiro-Wilk test of normality. Because of small sample sizes and non-normal distributions observed for several variables, nonparametric Spearman correlations were used to examine associations between a) maternal stress measures, SES indicators, and LENA metrics, and b) infant relative EEG power and LENA metrics at both the 6- and 12-month time points. Significance was set at p < 0.05, 2-sided, for all measures. All correlations with LENA metrics were additionally compared to false discovery rate (FDR) adjusted significance values (Benjamini & Hochberg, Reference Benjamini and Hochberg1995; Hochberg & Benjamini, Reference Hochberg and Benjamini1990) to account for multiple comparisons. Values reported as significant were also significant under FDR-adjustment unless otherwise indicated. Follow-up nonparametric partial Spearman correlations were used to examine associations between maternal stress and LENA metrics, adjusting for neighborhood poverty.
Results
Demographics
Full demographic information is reported in Table 1. At 6 months mean maternal age was 30 years (SD: 4.05; range: 23–37). One mother (6.3%) reported her highest educational attainment as some high school, 5 (31.3%) completed high school, 4 (25.0%) completed an associate's degree, 3 (18.8%) completed a bachelor's degree, and 1 (6.3%) completed a Master's degree. Mean rate of community poverty was 19.3% (SD: 11.1%; range: 4% - 45%). Four infants (25%) were Caucasian, 6 (37.5%) were African American, and 6 (37.5%) reported another race. Three infants (18.8%) were of Hispanic, Latino, or Spanish ethnicity.
At 12 months, 22 infants completed recordings and 20 recordings were included in subsequent analysis (11 female; mean age: 12.55; SD: 0.46; range: 11.7–13.5). Two recordings that were shorter than 2 hours were excluded as LENA recommends a recording duration of at least 2 hours for stability of metric calculations. Thirteen infants who completed a recording at 6 months also completed a recording at 12 months. Mean maternal age was 29 years (SD: 4.21; range 21–37). Two mothers (10.0%) reported their highest educational attainment as some high school, 9 (45.0%) completed high school, 4 (20.0%) completed an associate's degree, 2 (10.0%) completed a bachelor's degree, and 1 (5.0%) completed a Master's degree. Two mothers (10.0%) declined to report their education. Mean rate of community poverty was 18.8% (SD: 8.9%; range: 7% - 45%). Four infants (20%) were Caucasian, 10 (50%) were African American, and 6 (30%) reported another race. Five infants (25%) were of Hispanic, Latino, or Spanish ethnicity.
LENA descriptive results
LENA descriptive results are presented in Table 2. At 6 months mean Adult Word Count/hour (AWC/hour) was 1165.29 (SD: 542.22; range: 402.66–2812.85). Mean Child Vocalization Count/hour (CVC/hour) was 112.59 (SD: 49.54; range: 38.53–203.38) and mean Conversational Turn Count/hour (CTC/hour) was 26.18 (SD: 11.35; range: 9.60–45.16). All participants reported that English was spoken during the time of the recording. Additional languages were also spoken in the home during the recording for 8 families (Arabic, Creole, Spanish, Vietnamese). No differences in LENA metrics were observed for infants who heard one versus multiple languages (all p > 0.3). LENA has been validated for use in multiple languages, including bilingual language environments (e.g., Gilkerson, Zhang, Xu, Richards, Xu, Jiang, Hamsberger & Topping, Reference Gilkerson, Zhang, Xu, Richards, Xu, Jiang, Hamsberger and Topping2015; Orena, Byers-Heinlein & Polka, Reference Orena, Byers-Heinlein and Polka2019; Weisleder & Fernald, Reference Weisleder and Fernald2013).
LENA descriptive statistics for adult word count (AWC)/hour, child vocalization count (CVC)/hour, conversational turn count (CTC)/hour, and reciprocal vocal contingency score for infants at 6 (n = 16) and 12 month (n = 20) recording sessions

At 12 months mean AWC/hour was 1144.48 (SD: 1000.55; range: 130.93–3952.26). Mean CVC/hour was 149.18 (SD: 61.35; range: 55.94–268.35) and mean CTC/hour was 34.27 (SD: 22.40; range: 5.69–95.91). All participants reported that English was spoken during the time of the recording. Additional languages were also spoken during the recording for 8 families (African, Arabic, Creole, German, Spanish, Vietnamese). No differences in LENA metrics were observed for infants who heard one versus multiple languages (all p > 0.4).
For the 13 infants who completed recordings at both 6 and 12 months, stability was low between the two time points for AWC/hour (ICC: 0.19, p = .26; Cronbach's alpha: .324). However, stability of CTC/hour (ICC: 0.62, p = 0.01; Cronbach's alpha: .77) and CVC/hour (ICC: 0.66, p = .007; Cronbach's alpha: .795) was relatively high.
Bivariate correlations between SES variables, maternal reports of stress, and LENA outcomes
In order to explore associations between SES variables (maternal education, family income, neighborhood poverty), maternal reports of stress (RLEQ, PSS), and LENA outcomes (AWC/hour, CVC/hour, CTC/hour) bivariate Spearman correlations were performed at 6 (Table 3) and 12 (Table 4) months. We predicted that higher stress and lower SES should be associated with lower AWC, CVC, and CTC.
Correlations between maternal stress and sociodemographic variables and 6-month LENA metricsa

a Spearman r, two-tailed;
+ p < 0.10; *p < 0.05; **p < 0.01; ***p < 0.001
Correlations between maternal stress and sociodemographic variables and 12-month LENA metricsa

a Spearman r, two-tailed;
+ p < 0.10; *p < 0.05; **p < 0.01; ***p < 0.001
Six-month adult word count
At 6 months AWC/hour was negatively correlated with neighborhood poverty (r = −0.718, p = .003). No other variables were significantly correlated with AWC/hour.
Six-month child vocalization count
At 6 months CVC/hour was negatively correlated with total events on the RLEQ (r = −0.526, p = 0.044), events endorsed during pregnancy (r = −0.619, p = 0.018), events reported since the birth of the child (r = −0.643, p = 0.013), and scores on the PSS (r = −0.703, p = 0.003). No other variables were significantly correlated with CVC/hour.
Six-month conversational turn count
At 6 months CTC/hour was negatively correlated with neighborhood poverty (r = −0.587, p = 0.021), number of stressful events endorsed during pregnancy (r = −0.564, p = 0.035), with a trend for number of stressful events reported since the birth of the child (r = −0.514, p = 0.060). No other variables were significantly correlated with CTC/hour.
Twelve-month adult word count
At 12 months AWC/hour was negatively correlated with number of stressful events endorsed during pregnancy (r = −0.493, p = 0.038) and since the birth of the child (r = −0.540, p = 0.021) as well as with PSS scores (r = −0.490, p = 0.033). No other variables were significantly correlated with AWC/hour.
Twelve-month child vocalization count
At 12 months CVC/hour was negatively correlated with number of stressful events endorsed since the birth of the child (r = −0.564, p = 0.015), and with PSS scores (r = −0.587, p = 0.008). No other variables were significantly correlated with CVC/hour.
Twelve-month conversational turn count
At 12 months CTC/hour was negatively correlated with number of stressful events endorsed since the birth of the child (r = −0.550, p = 0.018) and PSS scores (r = −0.490, p = 0.033). No other variables were significantly correlated with CTC/hour.
Infant sex and age
Additional partial correlations were run adjusting for infant sex and age at time of recording. These variables were not related to stress, SES variables, or to LENA outcomes at either 6 or 12 months, with the exception of older age being associated with lower hourly CTC at 6 months, and males having higher hourly CVC at 6 months and fewer CTC at 12 months. Adjusting for child age and sex, all reported associations between CTC, CVC, and maternal stress measures remained significant at 6 months. At 12 months reported associations between CTC and maternal stress measures were reduced to trend level when adjusting for child sex (p = .052 – .11). However, given that we were underpowered to adjust for these additional variables in this exploratory study it is notable that associations remained at or near significance. Moreover, because there are no associations between infant age or sex and maternal stress measures these variables are unlikely to be driving the observed pattern of results.
Summary
Bivariate results confirm our hypotheses and support the notion that neighborhood poverty and maternal reports of stress are associated with early language behaviors. At both 6 and 12 months mothers who reported more stressful life events had children who produced fewer vocalizations and engaged in fewer conversational turns than children whose mothers reported fewer events. A similar pattern was evident for children of mothers who reported higher as opposed to lower levels of perceived stress. In contrast, higher levels of community poverty, but not maternal stress measures, were associated with lower adult word counts at 6 months. However, by 12 months both child language behaviors and adult word counts were associated with maternal stress measures.
When correlations were performed for only those participants with data at both 6- and 12-months, general patterns of results remain. Therefore, it does not appear that extra variability that might result from increased sample size at the 12-month time point is driving the pattern of associations observed at 12-months.
Correlations between maternal reports of stress and LENA outcomes adjusting for SES
Because maternal reports of stress and SES variables (i.e., levels of neighborhood poverty) were both associated with LENA metrics, partial correlations were performed at 6 (Table 5; Figure 2) and 12 (Table 6; Figure 3) months to examine whether stress variables (RLEQ; PSS) remained associated with LENA outcomes, even after adjusting for level of neighborhood poverty. Again we predicted higher reports of maternal stress to be associated with lower AWC, CVC, and CTC, supporting the prediction that maternal stress accounts for some variation in early language behaviors within a predominantly low- to mid-SES context.
Scatterplots showing significant (p < 0.05) Spearman partial correlations, adjusted for neighborhood poverty, between maternal reports of stress and child vocalizations and conversational turn counts when infants were 6 months of age.
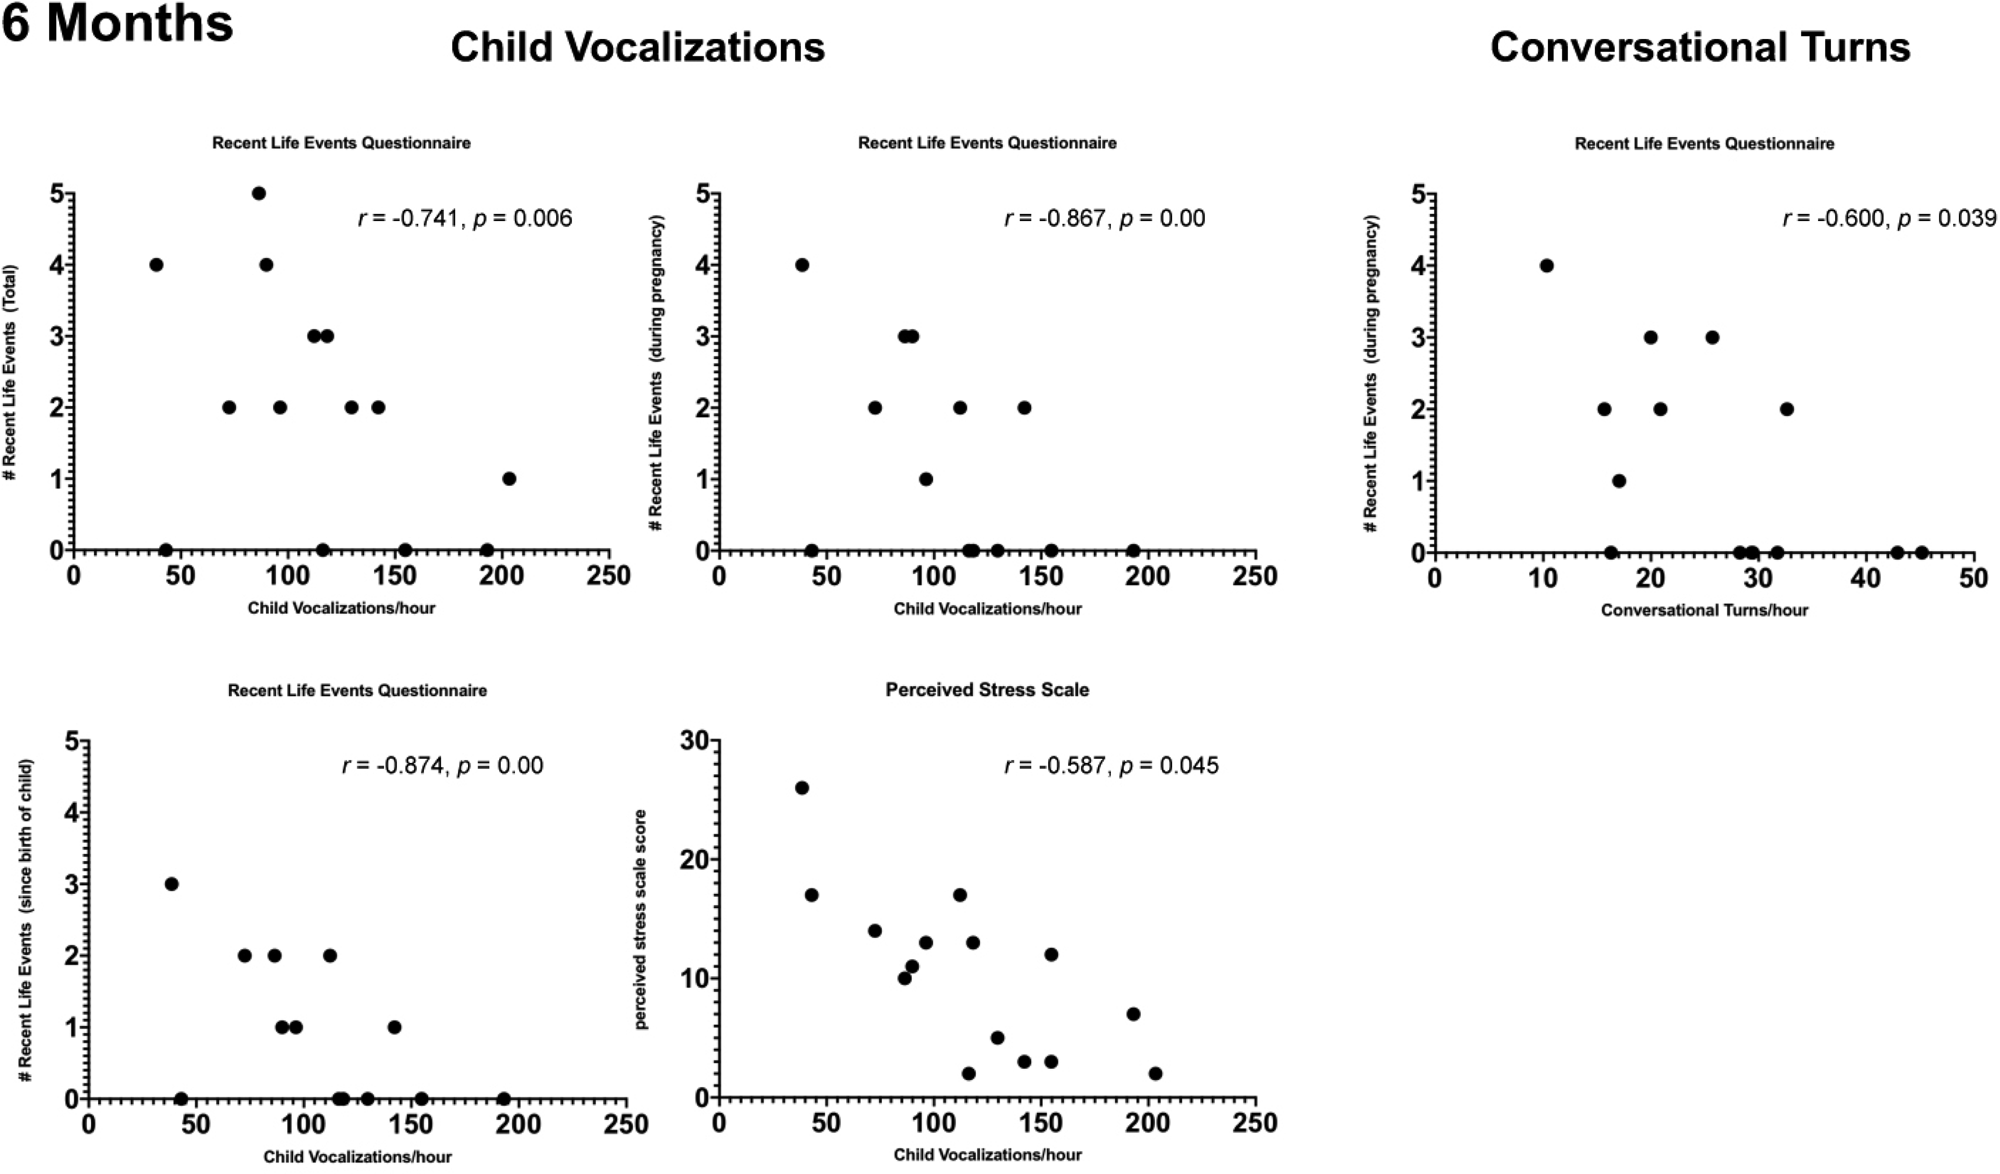
Scatterplots showing significant (p < 0.05) Spearman partial correlations, adjusted for neighborhood poverty, between maternal reports of stress and adult word counts, child vocalizations and conversational turn counts when infants were 6 months of age.

Partial correlations between maternal reports of stress and 6-month LENA metrics, adjusting for neighborhood povertya
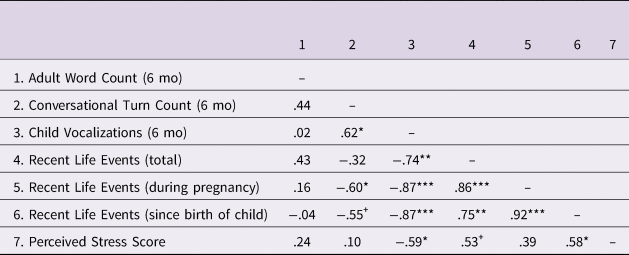
a Partial Spearman r, two-tailed;
+ p < 0.10; *p < 0.05; **p < 0.01; ***p < 0.001
Partial correlations between maternal reports of stress and 12-month LENA metrics, adjusting for neighborhood povertya

a Partial Spearman r, two-tailed;
+ p < 0.10; *p < 0.05; **p < 0.01; ***p < 0.001
Six-month LENA metrics
At 6 months AWC/hour was not correlated with any LENA metric after adjusting for neighborhood poverty.
CVC/hour was negatively correlated with total score on the RLEQ (r = −0.741, p = .006), and with events that occurred during pregnancy (r = −0.867, p = .000), and since the birth of the child (r = −0.874, p = .000). CVC/hour was also negatively correlated with PSS score (r = −0.587, p = .045).
CTC/hour was negatively correlated with events reported during pregnancy (r = −0.600, p = 0.039), with a trend for events that occurred since the birth of the child (r = −0.553, p = 0.062).
Twelve-month LENA metrics
At 12 months AWC/hour was negatively correlated with number of events reported since the birth of the child (r = −0.513, p = 0.035), with trends for number of events during pregnancy (r = −0.463, p = .061), as well as PSS scores (r = −0.449, p = .070).
CVC/hour was negatively correlated with number of events reported since the birth of the child (r = −0.531, p = .028), and with PSS scores (r = −0.526, p = .030).
CTC/hour was correlated with number of events since the birth of the child (r = −0.573, p = 0.016), with trends for number of events during pregnancy (r = −0.466, p = 0.059), and PSS scores (r = −0.437, p = 0.079).
Summary
After adjusting for levels of neighborhood poverty, measures of objective and subjective maternal stress continued to be associated with early child language behaviors and parent-child interactions, confirming our hypothesis.
Correlations between LENA metrics and infant EEG power
In order to test whether aspects of the early language environment were associated with early infant neurodevelopment, bivariate Spearman correlations were performed between LENA language metrics (AWC/hour, CVC/hour, CTC/hour) and relative EEG power in each frequency band (Delta, Theta, Low Alpha, High Alpha, Beta, Gamma). Prior research has found associations between relative frontal EEG power, particularly in the gamma band, and language outcomes; however, associations with power in temporal regions have also been observed (e.g., Benasich et al., Reference Benasich, Gou, Choudhury and Harris2008; Gou et al., Reference Gou, Choudhury and Benasich2011). Moreover, distribution patterns of EEG power, particularly gamma, have been found to change across development (e.g., Anderson & Perone, Reference Anderson and Perone2018; Cuevas & Bell, Reference Cuevas and Bell2011; Takano & Ogawa, Reference Takano and Ogawa1998). For these reasons we examined correlations for both whole brain as well as frontal regions of interest. We predicted higher values on LENA metrics to be associated with a more “mature” pattern of neurodevelopment, as reflected by greater power in high frequency bands (i.e., beta and gamma) and lower power in low frequency bands (i.e., delta and theta).
Six-month LENA metrics and 6-month EEG
Six-month AWC/hour was negatively correlated with 6-month whole brain (r = −0.703, p = 0.007) and frontal (r = −0.621, p = 0.024) theta power, and whole brain (r = −0.577, p = 0.039) and frontal (r = −0.632, p = 0.021) low alpha power (Figure 4). Six-month AWC/hour was also positively correlated with 6-month whole brain beta (r = 0.560, p = 0.046) and gamma (r = 0.610, p = 0.027) power.
Scatterplots (n = 13) displaying significant correlations between (A) 6-month conversational turn count per hour and 6-month whole brain relative EEG power, (B) 6 month adult word count per hour and 6 month frontal EEG power, and (C) 6 month adult word count per hour and 6 month whole brain relative EEG power
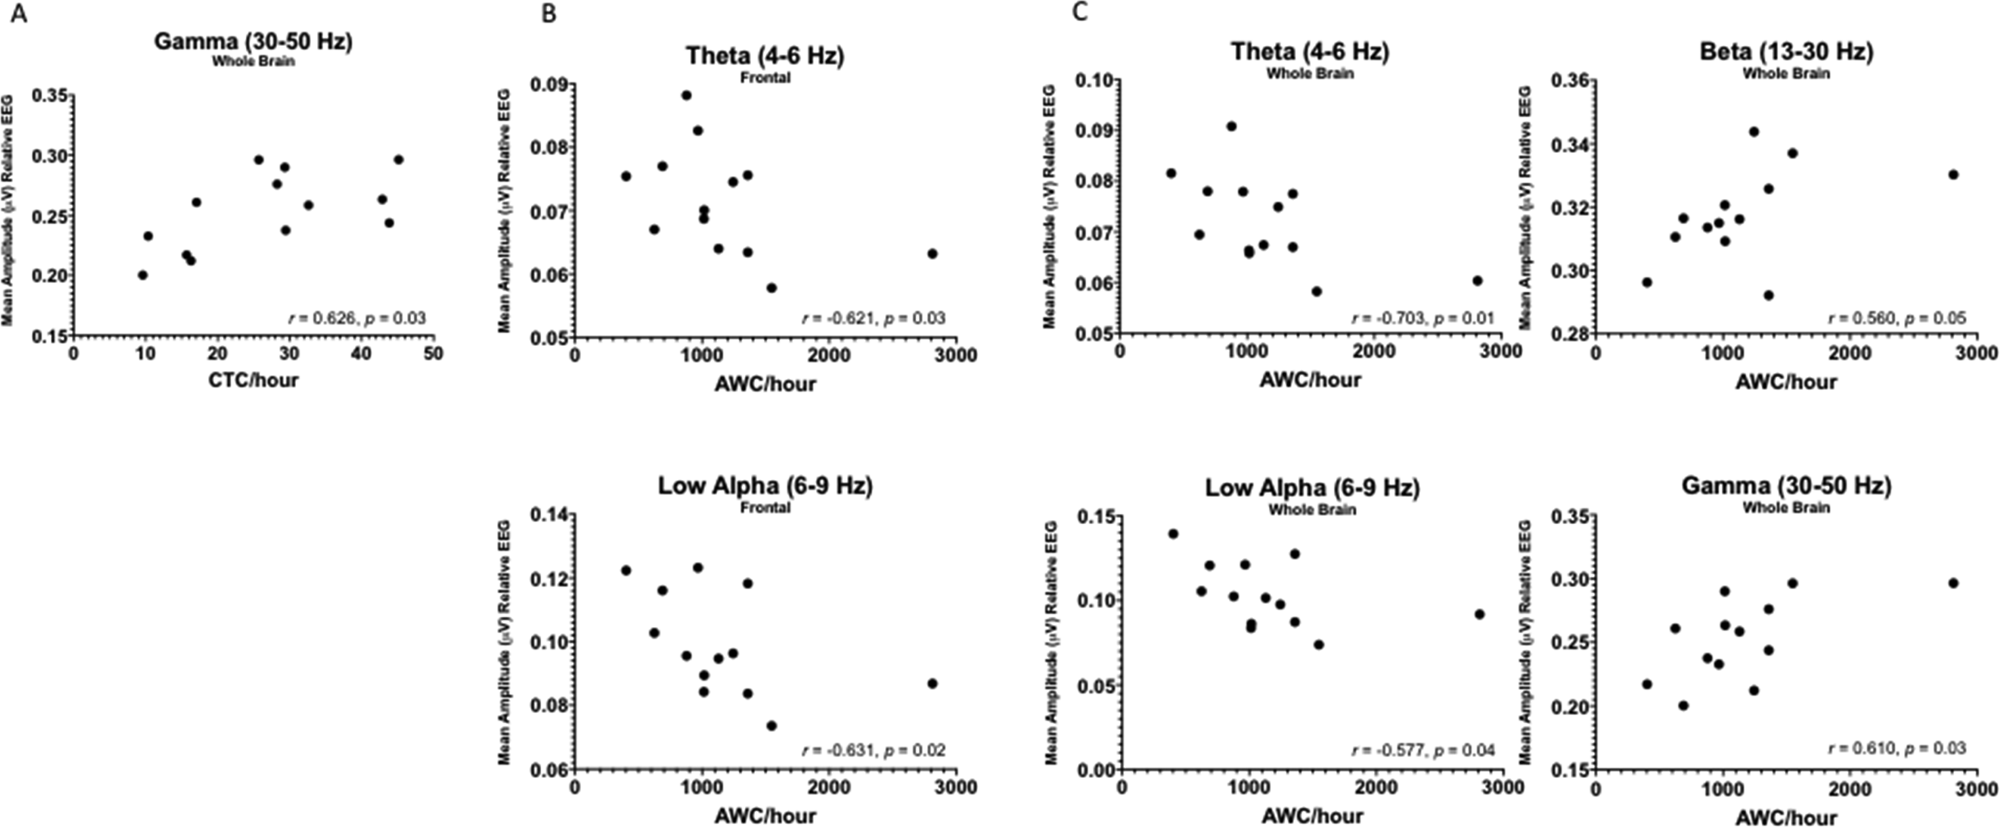
Six-month CTC/hour was positively correlated with 6-month whole brain gamma power (r = 0.626, p = 0.022).
Six-month CVC/hour was not correlated with 6-month EEG power in any frequency band.
Six-month LENA metrics and 12-month EEG
Six-month CTC/hour was negatively correlated with 12-month frontal delta (r = −0.538, p = 0.047) and theta (r = −0.547, p = 0.043) power and positively correlated with 12-month frontal gamma power (r = 0.552, p = 0.041) (Figure 5).
Scatterplots (n = 14) displaying significant correlations between 6-month conversational turn count per hour and 12 month EEG power in Delta, Theta, and Gamma bands at frontal electrode locations.

Six-month AWC/hour and CVC/hour were not related to 12-month EEG power in any frequency band.
Twelve-month LENA metrics and 12-month EEG
No 12-month LENA metrics were correlated with 12-month EEG power in any frequency band in the full sample of 12 month participants, nor when the analysis was restricted to just those participants with data at both 6 and 12 months. Therefore, it does not appear that extra variability at the 12-month time point is driving the lack of correlation between 12-month measures.
Summary
Results revealed that aspects of the language environment at 6 months were associated with infant EEG power at both 6 and 12 months. In particular, more adult words and more conversational turns at 6 months were associated with patterns of 6-month EEG power reflecting higher relative power in high frequency bands, and lower relative power in low frequency bands. Conversational turns at 6 months continued to be associated with a similar pattern of EEG power when infants were 12 months of age. Results partially confirm our hypotheses, and suggest that early neurodevelopmental maturation might influence how parents interact with their children, while early interactions might influence ongoing neurodevelopment.
Discussion
In the present study we report that maternal reports of stress – both exposure to stressful life events and maternal perceptions of stress – were negatively associated with child and caregiver language behaviors within the first year of life. While SES effects on language outcomes (e.g., vocabulary size and complexity) are typically observed by about 18 months (e.g., Fernald et al., Reference Fernald, Marchman and Weisleder2013), the present exploratory study finds evidence that early interactions known to support language acquisition may be influenced by SES context even earlier, within the first year of life. Specifically, mothers who reported more stressful life events and higher perceived stress had children who produced fewer vocalizations and engaged in fewer conversational turns at 6 and 12 months of age, even after adjusting for levels of neighborhood poverty. Moreover, early language behaviors were associated with infant EEG power at 6 and 12 months. Specifically, greater numbers of vocalizations, and more parent-child interactions, were associated with lower relative power in low frequency bands, and higher relative power in high frequency bands, suggesting both that a) level of neurodevelopmental maturation might influence how parents engage with their infants, and b) early language interactions might be associated with the development of more mature patterns of brain activity that could ultimately support subsequent language development.
While living in a low-SES context has been found to be associated with lower quality parent-child interactions and poorer child language outcomes (e.g., Hart & Risley, Reference Hart and Risley1995; Hoff, Reference Hoff2003), considerable variability amongst individuals has been observed (Gilkerson et al., Reference Gilkerson, Richards, Warren, Montgomery, Greenwood, Kimbrough Oller, Hansen and Paul2017; Weisleder & Fernald, Reference Weisleder and Fernald2013). Recently, Gilkerson and colleagues (Reference Gilkerson, Richards, Warren, Montgomery, Greenwood, Kimbrough Oller, Hansen and Paul2017) reported average adult word counts, child vocalization counts, and conversational turn counts for a large sample of 2–48-month-old children from a broad socioeconomic range. Mean language metrics in that study, at 6 and 12 months, were comparable to those observed in the present study. They also observed that children from low-SES backgrounds (i.e., mothers with high school education or below, collapsed across ages) heard fewer adult words, produced fewer vocalizations, and engaged in fewer conversational turns compared with children from higher-SES backgrounds (i.e., children with college-educated mothers), although considerable within-group variability was observed. Results from the present study suggest that other factors, such as variation in exposure to stressful life events and maternal perceptions of stress, account for some of that variability.
Exposure to early life stress might influence the early language environment in several ways. For example, high levels of maternal stress might influence the availability of the caregiver to sensitively and contingently engage with the child or may reflect inadequate resources to do so. Critically, the quality of infants’ early language environments, particularly their interactions with caregivers, appears to mediate observed associations between SES and language outcomes. For example, while Hoff (Reference Hoff2003) found that, on average, mothers in high- compared to low-SES contexts spoke more, used more word types and complex speech, and provided more topic-continuing replies to their 16–31-month-old children, associations between SES and child vocabulary disappeared when these measures of maternal speech quality were controlled. Moreover, Weisleder and Fernald (Reference Weisleder and Fernald2013) found that while children who received more child-directed speech when they were 19 months of age had more efficient word processing and larger expressive vocabularies at 24 months, overheard adult speech was unrelated to child vocabulary outcomes, supporting the necessity of quality early child-caregiver interactions to facilitate the development of language. Gilkerson and colleagues (Reference Gilkerson, Richards, Warren, Oller, Russo and Vohr2018) further demonstrated that conversational turn counts between caregivers and their 18 to 24-month children were positively associated with children's IQ, verbal comprehension, and both receptive and expressive vocabulary when children reached middle school, even after controlling for SES. In the present study maternal reports of stress were negatively associated with number of conversational turns, supporting the notion that high levels of maternal stress, even after adjusting for levels of neighborhood poverty, are associated with a reduction in the types of quality language interactions found to promote language development.
High levels of stress might also influence early caregiver-child interactions by impacting children's own early neurodevelopment, in turn influencing their ability to elicit language-rich interactions from caregivers. While contingent interactions from adults who are sensitive to infants’ cues draw attention to critical features of language, infants also elicit cues from their respective environments. Their ability to do so can differ based on level of language development, or developmental maturation, and caregivers have been found to adjust the quantity and complexity of their utterances to the language abilities of their child (Bruner, Reference Bruner1985), and to use different interactional strategies depending on context (for a review see Pierce & Genesee, Reference Pierce, Genesee, Gruïtér and Paradis2014). For example, parents of children with developmental delays and specific language impairment have been found to use more redirections than parents of typically developing children (Cheskin, Reference Cheskin1982; Marfo, Reference Marfo1991; see Paparella & Kasari, Reference Paparella and Kasari2004, for a review), and mothers of children with better communication abilities were more likely to expand upon their children's utterances, providing a richer source of directed linguistic input (Conti-Ramsden, Reference Conti-Ramsden1990).
The present study found that 6-month adult word counts were positively correlated with concurrent relative EEG power in low frequency bands (theta and low alpha), and negatively correlated with relative EEG power in high frequency bands (beta and gamma). This pattern of EEG power has been associated with maturational delay (e.g., Marshall et al., Reference Marshall and Fox2004; McLaughlin, Fox, Zeanah, Sheridan, Marshall & Nelson, Reference McLaughlin, Fox, Zeanah, Sheridan, Marshall and Nelson2010) as well as learning and attention disorders later in life (e.g., Barry, Clarke & Johnstone, Reference Barry, Clarke and Johnstone2003). Several studies have also reported links between SES, maternal stress, and power in the gamma frequency band (Brito et al., Reference Brito, Fifer, Myers, Elliott and Noble2016; Pierce et al., Reference Pierce, Thompson, Gharib, Schlueter, Reilly, Valdes, Roberts, Conroy, Levitt and Nelson2019; Tomalski et al., Reference Tomalski, Moore, Ribeiro, Axelsson, Murphy, Karmiloff-Smith, Johnson and Kushnerenko2013), suggesting that variables associated with living in a low-SES context might influence early brain development in this way. The observation that a higher adult word count was associated with a more “mature” pattern of concurrent brain activity might suggest that adults provide more linguistic input for children who are more neurodevelopmentally advanced. If true, we might expect CTC to be more strongly associated with 6-month EEG patterns than AWC per se. However, prior studies have found that caregivers provide a comparable number of contingent responses to children with and without language disorders, although within those interactions parents use more complex language when speaking to children without language impairment (e.g., Conti-Ramsden, Reference Conti-Ramsden1990). Because AWC in the present study represents number of words both within and outside of direct interactions, less complex responses might be reflected in both AWC as well as CTC.
The observation that 6-month conversational turn count was negatively correlated with 12-month relative frontal power in low frequency bands (delta and theta), and positively correlated with relative frontal power in high frequency bands (gamma), might suggest that these early language interactions promote early neurodevelopment in a manner that could ultimately facilitate increasingly complex language development. Supporting this notion, a recent study by Romeo and colleagues (Reference Romeo, Leonard, Robinson, West, Mackey, Rowe and Gabrieli2018) found that 4 to 6 year old children who engaged in more conversational turns with their caregivers had greater activation in left inferior frontal gyrus during a language task and this neural activation mediated the relationship between conversational turns and children's verbal skills. This suggests that parent-child interactions might influence how neural processes underlying language abilities are established (Pavlakis et al., Reference Pavlakis, Noble, Pavlakis, Ali and Frank2015). Moreover, low resting frontal gamma power in 16–36 month-old children has also been found to represent a risk factor for language disorder (Benasich et al., Reference Benasich, Gou, Choudhury and Harris2008), and to predict language and cognitive outcomes at 4–5 years of age (Gou et al., Reference Gou, Choudhury and Benasich2011), suggesting that early EEG power indicators might help to identify those children who may be at risk for developmental or language issues later in life. Because we are following these children longitudinally, we aim to determine whether these patterns are associated with language outcomes as children get older (i.e., at the point when SES-related differences in language outcomes typically emerge). We also note that power in low frequency EEG bands appeared to be less variable at 12 months than at 6 months, whereas power in high frequency EEG bands appeared to be more variable at 12 months than at 6 months (Figure 1).
In the present study maternal education and family income were not associated with LENA language outcomes. This is surprising given results from other studies demonstrating the importance of these variables. However, given that our small samples were skewed towards the lower end of the socioeconomic range, and given the categorical nature of these measurements, we may not have had sufficient variability to replicate these associations. In particular, prior studies have found that maternal education of college level or higher, but not lower levels of education, are associated with increases in adult word counts and caregiver-child interactions (Gilkerson et al., Reference Gilkerson, Richards, Warren, Montgomery, Greenwood, Kimbrough Oller, Hansen and Paul2017). We likely did not have enough mothers within this higher range to see significant effects. Moreover, we did not collect information about factors that might track with maternal education (e.g., access to resources, social support), which might, in turn, explain associations between mothers’ attained education and child language outcomes. Additionally, given the nature of the automated analysis performed by LENA software we do not have information about the content of interactions between caregivers and infants and must rely on quantity as a proxy for quality parent-child interactions. While the content of these interactions would provide important additional information, the present analysis strategy allowed for large quantities of data (e.g., day long natural language recordings) to be interpreted from a relatively difficult to reach population. Finally, given small sample sizes in this exploratory study we were underpowered to explore mediations between maternal stress, infant EEG power, and LENA outcomes, nor could we examine stress timing effects or employ multi-level models that would allow us to explore growth trajectories within individuals. Subsequent studies should explore interactions between these variables in greater depth.
Despite these limitations, results from the present exploratory study suggest that differences in early language behaviors and caregiver-child interactions can be observed, within a predominantly low-income sample, from as early as 6 months of age – much earlier than SES-related differences in language outcomes are typically observed. We further demonstrate that maternal reports of stress are associated with early language interactions in a way that might account for some of the variability observed in other samples that have explored links between SES and language. Finally, we demonstrate important and novel preliminary associations between early infant neurodevelopment and the emergence of language behaviors. Understanding interactions between these variables can ultimately help to explain how very early experiences impact the developing brain, and the developing foundations of language, in a manner that could influence language development across the lifespan.
Acknowledgements
We thank Jenny Chan, Gabriela Kovacikova, Anna Hoover, and Hannah Durant for their essential contributions to family recruitment, engagement and database administration. We also thank Dr. Kathleen Conroy for facilitating the study with Boston Children's Hospital Primary Care Center. We thank Young Chang and Ruby Lewis for contributions to management of LENA data. We are greatly appreciative of the children and families who generously participated in this research. This work was supported by JPB Research Network on Toxic Stress: A project of the Center on the Developing Child at Harvard University.



