




1. Introduction
Suspension systems consisting of solid particles and a polymeric host fluid are widely used in industrial materials and products, such as inks, paints and polymer composites. In the manufacturing processes, such suspensions are subject to various types of flow; hence understanding and controlling the rheological properties of them are crucial for efficient productivity. In a polymeric fluid, including polymer solutions and melts, viscoelasticity originates from the change in the conformation of polymer molecules caused by flow history. Since the polymeric host fluid exhibits viscoelasticity, the interaction between the particles and flow in suspensions in viscoelastic fluid flow is elusive. For instance, unique behaviour not observed in Newtonian media has been reported, such as shear thickening even in a dilute particle concentration under simple shear flow (Shaqfeh Reference Shaqfeh2019; Tanner Reference Tanner2019) and the formation of a string of particles under shear flow (Michele, Pätzold & Donis Reference Michele, Pätzold and Donis1977; Scirocco, Vermant & Mewis Reference Scirocco, Vermant and Mewis2004).
To examine the medium's elastic effects on the suspension rheology, suspensions in Boger fluids have been used experimentally. Boger fluids show constant shear viscosity and finite normal stress difference (NSD), which is preferable for separating the effects of the medium's elasticity from the nonlinear effects in the shear viscosity. Experimentally measured shear thickening in suspensions in Boger fluids has been reported, where the suspension viscosity increases with shear rate or shear stress, even at dilute particle concentrations where the inter-particle interactions are negligible (Zarraga, Hill & Leighton Reference Zarraga, Hill and Leighton2001; Scirocco, Vermant & Mewis Reference Scirocco, Vermant and Mewis2005; Dai, Qi & Tanner Reference Dai, Qi and Tanner2014; Tanner Reference Tanner2015). The shear-thickening mechanism has been discussed theoretically (Koch, Lee & Mustafa Reference Koch, Lee and Mustafa2016; Einarsson, Yang & Shaqfeh Reference Einarsson, Yang and Shaqfeh2018) and numerically (Yang, Krishnan & Shaqfeh Reference Yang, Krishnan and Shaqfeh2016; Yang & Shaqfeh Reference Yang and Shaqfeh2018a; Shaqfeh Reference Shaqfeh2019; Vázquez-Quesada et al. Reference Vázquez-Quesada, Espa nol, Tanner and Ellero2019; Matsuoka, Nakayama & Kajiwara Reference Matsuoka, Nakayama and Kajiwara2020). These theoretical and numerical studies reveal that this shear thickening in dilute viscoelastic suspensions is mainly originated by the development of polymeric stress around the particles. While the qualitative shear-thickening mechanism has become progressively clearer, there are still some discrepancies between numerical calculations and measurements in the quantitative prediction of shear-thickening behaviours in viscoelastic suspensions.
To evaluate the complex responses of a viscoelastic suspension under different types of flow, direct numerical simulations (DNS) are carried out, in which the fluid flow around finite-volume solids rather than point masses is solved, to accurately treat hydrodynamic interactions. A few computational studies have reported the dynamics of many-particle systems in viscoelastic suspensions (Hwang, Hulsen & Meijer Reference Hwang, Hulsen and Meijer2004; Jaensson, Hulsen & Anderson Reference Jaensson, Hulsen and Anderson2015; Vázquez-Quesada & Ellero Reference Vázquez-Quesada and Ellero2017; Yang & Shaqfeh Reference Yang and Shaqfeh2018b; Vázquez-Quesada et al. Reference Vázquez-Quesada, Espa nol, Tanner and Ellero2019). Experimentally measured and DNS obtained shear thickening in viscoelastic suspensions were compared. A scaling relation between the shear-thickening part and the suspension stress up to semidilute particle volume fraction  $\phi _p\leqslant 0.1$ has been discussed based on the results of immersed-boundary many-particle DNS using a Giesekus fluid mimicking a Boger fluid from Dai et al. (Reference Dai, Qi and Tanner2014) and Yang & Shaqfeh (Reference Yang and Shaqfeh2018b). However, the relative suspension viscosity predicted by using the scaling relation and the numerical result from a single-particle dilute suspension in an Oldroyd-B medium resulted in an underestimation of the experimental shear thickening at
 $\phi _{p}\leqslant 0.1$ (Yang & Shaqfeh Reference Yang and Shaqfeh2018b). To explain the discrepancy, a lack of constitutive modelling of the elongational response in the fluid was pointed out. Vázquez-Quesada et al. (Reference Vázquez-Quesada, Espa nol, Tanner and Ellero2019) performed a smoothed particle hydrodynamics simulation using an Oldroyd-B medium up to
 $\phi _{p}\leqslant 0.3$, and showed that the relative suspension viscosity from a many-particle simulation is larger than that from a single-particle simulation even at a dilute particle volume fraction, thus indicating that the interaction between particles is important even in dilute suspensions. The corresponding numerical result for the suspension viscosity agrees quantitatively with experimental data for a dilute suspension (
 $\phi _{p}=0.05$) but was different for semidilute conditions (
 $\phi _{p}=0.1, 0.3$). It is still unclear whether the Oldroyd-B model can quantitatively predict shear thickening in semidilute suspensions in Boger fluids.
In this study, the smoothed profile method (SPM), which is a DNS method originally developed for Newtonian suspension systems, is extended to study the bulk shear rheology of a suspension in a viscoelastic medium in a three-dimensional (3-D) space. To impose simple shear flow on a suspension under periodic boundary conditions rather than wall-driven shear flow in a confined system, a time-dependent oblique coordinate system is used for the fluid; its formulation conforms to Lees–Edwards boundary conditions for particle dynamics and is preferred for examining the bulk stress as well as local stress in suspensions without wall effects.
To elucidate the key factor for the quantitative prediction of the shear thickening in suspensions in Boger fluids, DNS of many-particle suspensions in a multi-mode Oldroyd-B fluid is performed using SPM. The suspension viscosity and the NSD are compared with published experimental results (Yang & Shaqfeh Reference Yang and Shaqfeh2018b) at dilute to semidilute conditions. Additionally, the effect of suspension microstructures on the suspension viscosity is examined by comparing a many-particle system with a single-particle system which corresponds to a cubic array suspension in our DNS. Next, the contribution of each polymer relaxation mode to the suspension shear thickening is evaluated. The suspension stress decomposition into the stresslet and the particle-induced fluid stress is conducted to discuss scaling relations for these contributions. Finally, the change in the flow pattern and elastic stress development in many-particle suspensions is discussed.
The paper is organized as follows. In § 2, our numerical method is explained. The governing equations for a suspension in a viscoelastic medium based on a smoothed profile of particles are described in § 2.1. The calculation of stress for the rheological evaluation in SPM is described in § 2.2. The boundary conditions are explained in § 2.3. In § 3, the numerical results are presented. First, our DNS method is validated by the rheological evaluation for a single-particle system in a single-mode Oldroyd-B fluid in § 3.1. Next, shear-thickening behaviours in dilute and semidilute viscoelastic suspensions are studied by performing a many-particle calculation in a multi-mode Oldroyd-B fluid in § 3.2. The results are summarized in § 4.
2. Numerical method
In SPM, the fluid–solid interaction is treated by applying the smoothed profile function of a solid particle (Nakayama & Yamamoto Reference Nakayama and Yamamoto2005; Nakayama, Kim & Yamamoto Reference Nakayama, Kim and Yamamoto2008). Since a regular mesh rather than a surface-conforming mesh can be used for continuum calculations in SPM, the calculation cost of fluid fields, which is dominant in total calculation costs, is nearly independent of the number of particles (Nakayama et al. Reference Nakayama, Kim and Yamamoto2008), thus making the direct simulation of a many-particle system feasible. SPM has been applied to suspensions in Newtonian fluids to evaluate the shear viscosity (Iwashita & Yamamoto Reference Iwashita and Yamamoto2009; Kobayashi & Yamamoto Reference Kobayashi and Yamamoto2011; Molina et al. Reference Molina, Otomura, Shiba, Kobayashi, Sano and Yamamoto2016), complex modulus (Iwashita, Kumagai & Yamamoto Reference Iwashita, Kumagai and Yamamoto2010) and particle coagulation rate (Matsuoka et al. Reference Matsuoka, Fukasawa, Higashitani and Yamamoto2012) of Brownian suspensions up to  $\phi _p \leqslant 0.56$. The application of SPM was extended to complex host fluids, such as electrolyte solutions (Kim, Nakayama & Yamamoto Reference Kim, Nakayama and Yamamoto2006; Nakayama et al. Reference Nakayama, Kim and Yamamoto2008; Luo, Beskok & Karniadakis Reference Luo, Beskok and Karniadakis2010), and to active swimmer suspensions (Molina, Nakayama & Yamamoto Reference Molina, Nakayama and Yamamoto2013).
2.1. Governing equations
Consider the suspension of  $N$ neutrally buoyant and non-Brownian spherical particles with radius
 $a$, mass
 $M$ and moment of inertia
 $\boldsymbol{\mathsf{I}}_p=2Ma^2\boldsymbol{\mathsf{I}}/5$ in a viscoelastic fluid, where
 $\boldsymbol{\mathsf{I}}$ is the unit tensor. In SPM, the velocity field
 $\boldsymbol {u}(\boldsymbol {r}, t)$ at position
 $\boldsymbol {r}$ and time
 $t$ is governed as follows:
 \begin{gather} \rho\left(\frac{\partial}{\partial t} +\boldsymbol{u}\boldsymbol{\cdot}\boldsymbol{\nabla}\right)\boldsymbol{u} =\boldsymbol{\nabla}\boldsymbol{\cdot}(\boldsymbol{\sigma}_n+\boldsymbol{\sigma}_p) +\rho\phi\boldsymbol{f}_p, \end{gather}
 \begin{gather}\boldsymbol{\nabla}\boldsymbol{\cdot}\boldsymbol{u}=0, \end{gather}
where  $\rho$,
 $\boldsymbol {\sigma }_n=-p\boldsymbol{\mathsf{I}}+2\eta _s\boldsymbol{\mathsf{D}}$,
 $\boldsymbol {\sigma }_p$,
 $\boldsymbol{\mathsf{D}}=(\boldsymbol {\nabla }\boldsymbol {u} +\boldsymbol {\nabla }\boldsymbol {u}^\textrm {T})/2$ and
 $p$ are the fluid mass density, Newtonian solvent stress, polymer stress, strain-rate tensor and pressure, respectively. In this study, the polymer stress term is newly incorporated into the previous hydrodynamic equation for a Newtonian fluid in SPM. In SPM, the particle profile field is introduced as
 $\phi (\boldsymbol {r},t)\equiv \sum _{i=1}^N\phi _i$, where
 $\phi _i\in [0,1]$ is the
 $i$th particle profile function having a continuous diffuse interface domain with thickness
 $\xi$; the inside and outside of the particles are indicated by
 $\phi =1$ and
 $\phi =0$, respectively. Details on the specific definition and the properties of the profile function were reported by Nakayama et al. (Reference Nakayama, Kim and Yamamoto2008). The body force
 $\rho \phi \boldsymbol {f}_p$ in (2.1) enforces particle rigidity in the velocity field (Nakayama et al. Reference Nakayama, Kim and Yamamoto2008; Molina et al. Reference Molina, Otomura, Shiba, Kobayashi, Sano and Yamamoto2016). In SPM, the continuum velocity field is defined in the entire domain, including the fluid and solids. The velocity field
 $\boldsymbol {u}$ is interpreted as
 \begin{equation} \boldsymbol{u}(\boldsymbol{r},t)=(1-\phi)\boldsymbol{u}_f+\phi\boldsymbol{u}_p, \end{equation}
where  $\boldsymbol {u}_f$ and
 $\boldsymbol {u}_p$ are the fluid and particle velocity fields, respectively. The specific implementation of
 $\boldsymbol {u}_f$,
 $\boldsymbol {u}_p$ and
 $\phi \boldsymbol {f}_p$ is explained in appendix B.
For the time evolution of polymer stress  $\boldsymbol {\sigma }_p$, any constitutive equations proposed to reproduce the rheological behaviour of real viscoelastic fluids can be used. In this study, the single- or multi-mode Oldroyd-B model, which is a minimal viscoelastic model for Boger fluids, is applied:
 \begin{gather} \left(\frac{\partial}{\partial t} +\boldsymbol{u}\boldsymbol{\cdot}\boldsymbol{\nabla}\right) \boldsymbol{\mathsf{C}}^{(k)} =(\boldsymbol{\nabla}\boldsymbol{u})^\textrm{T} \boldsymbol{\cdot} \boldsymbol{\mathsf{C}}^{(k)} + \boldsymbol{\mathsf{C}}^{(k)}\boldsymbol{\cdot}(\boldsymbol{\nabla}\boldsymbol{u}) -\frac{\boldsymbol{\mathsf{C}}^{(k)}-\boldsymbol{\mathsf{I}}}{\lambda^{(k)}}, \end{gather}
 \begin{gather}\boldsymbol{\sigma}_p=\sum_k\boldsymbol{\sigma}_p^{(k)} =\sum_k\frac{\eta_p^{(k)}}{\lambda^{(k)}} ( \boldsymbol{\mathsf{C}}^{(k)}- \boldsymbol{\mathsf{I}}), \end{gather}
where  $\boldsymbol{\mathsf{C}}^{(k)}(\boldsymbol {r},t)$,
 $\lambda ^{(k)}$ and
 $\eta _p^{(k)}$ are the conformation tensor, relaxation time and polymer viscosity of the
 $k$th relaxation mode, respectively. The conformation tensor of each relaxation mode
 $\boldsymbol{\mathsf{C}}^{(k)}$ obeys an independent but same form of the constitutive equation as expressed by (2.4). The total polymer stress is obtained by summing up the polymer stress of each mode
 $\boldsymbol {\sigma }_p^{(k)}$ by using (2.5). In the single-mode Oldroyd-B model, the mode index
 $k$ is omitted for simplicity.
Microscopically, an Oldroyd-B fluid corresponds to a dilute suspension of dumbbells with a linear elastic spring in a Newtonian solvent (Bird et al. Reference Bird, Curtiss, Armstrong and Hassager1987). The conformation tensor is related to the average stretch and orientation of the dumbbells. The first and second terms on the right-hand side of (2.4) represent the affine deformation of  $\boldsymbol{\mathsf{C}}^{(k)}$, by which
 $\boldsymbol{\mathsf{C}}^{(k)}$ is rotated and stretched, and the last term is the irreversible relaxation of
 $\boldsymbol{\mathsf{C}}^{(k)}$. At steady state in simple shear flow, the shear viscosity and the first and second NSDs are
 $\eta _0=\eta _s+\sum _k\eta _p^{(k)}$,
 $N_1=2\sum _k\eta _p^{(k)}\lambda ^{(k)}\dot {\gamma }^2$ and zero, respectively, where
 $\dot {\gamma }$ indicates the applied shear rate. The steady-shear property of the Oldroyd-B model mimics that of Boger fluids and is characterized by rate-independent viscosity and finite elasticity. Boger fluids are often used to experimentally evaluate the effect of fluid elasticity separately from that of viscosity (Boger Reference Boger1977; James Reference James2009).
The individual particles evolve by
 \begin{gather} \dot{\boldsymbol{R}}_i=\boldsymbol{V}_i, \end{gather}
 \begin{gather}M_i\dot{\boldsymbol{V}}_i=\boldsymbol{F}^H_i+\boldsymbol{F}^C_i, \end{gather}
 \begin{gather}\boldsymbol{\mathsf{I}}_{p,i}\boldsymbol{\cdot}\dot{\boldsymbol{\varOmega}}_i =\boldsymbol{N}^H_i, \end{gather}
where  $\boldsymbol {R}_i$,
 $\boldsymbol {V}_i$ and
 $\boldsymbol {\varOmega }_i$ are the position, velocity and angular velocity of the
 $i$th particle, respectively,
 $\boldsymbol {F}_i^H$ and
 $\boldsymbol {N}_i^H$ are the hydrodynamic force and torque from the fluid (Nakayama et al. Reference Nakayama, Kim and Yamamoto2008; Molina et al. Reference Molina, Otomura, Shiba, Kobayashi, Sano and Yamamoto2016), respectively, and
 $\boldsymbol {F}_i^C$ is the inter-particle potential force due to the excluded volume that prevents particles from overlapping. The non-slip boundary condition for the velocity field is assigned at particle surfaces. The specific implementation of
 $\boldsymbol {F}_i^H$,
 $\boldsymbol {N}_i^H$ and
 $\boldsymbol {F}_i^C$ is explained in appendix B.
The governing equations can be non-dimensionalized by length unit  $a$, velocity unit
 $a\dot {\gamma }$ and stress unit
 $\eta _0\dot {\gamma }$. In the following, a tilde (
 $\,\tilde {\cdot }\,$) indicates a non-dimensional variable. For the fluid momentum equation,
 \begin{equation} {Re}\left(\frac{\partial}{\partial \tilde{t}} +\tilde{\boldsymbol{u}}\boldsymbol{\cdot} \tilde{\boldsymbol{\nabla}}\right)\tilde{\boldsymbol{u}} =\tilde{\boldsymbol{\nabla}}\boldsymbol{\cdot}(\tilde{\boldsymbol{\sigma}}_n +\tilde{\boldsymbol{\sigma}}_p)+{Re}\,\phi\tilde{\boldsymbol{f}}_p, \end{equation}
where  $\tilde {\boldsymbol {\sigma }}_n= -\tilde {p}\boldsymbol{\mathsf{I}}+2\beta \tilde {\boldsymbol{\mathsf{D}}}$ and the Reynolds number is defined as
 ${Re}=\rho a^2\dot {\gamma }/\eta _0$. In this study,
 ${Re}$ is kept small to exclude inertial effects from the rheological evaluations. For the single-mode Oldroyd-B constitutive equation,
 \begin{equation} \left(\frac{\partial}{\partial \tilde{t}} +\tilde{\boldsymbol{u}}\boldsymbol{\cdot}\tilde{\boldsymbol{\nabla}}\right) \boldsymbol{\mathsf{C}} =(\tilde{\boldsymbol{\nabla}}\tilde{\boldsymbol{u}})^\textrm{T} \boldsymbol{\cdot} \boldsymbol{\mathsf{C}}+ \boldsymbol{\mathsf{C}} \boldsymbol{\cdot}(\tilde{\boldsymbol{\nabla}}\tilde{\boldsymbol{u}}) -\frac{\boldsymbol{\mathsf{C}}-\boldsymbol{\mathsf{I}}}{{Wi}}, \end{equation}
where  $\tilde {\boldsymbol {\sigma }}_p= (1-\beta )(\boldsymbol{\mathsf{C}}-\boldsymbol{\mathsf{I}})/{Wi}$. A single-mode Oldroyd-B fluid is characterized by two non-dimensional parameters:
 $\beta$ and
 ${Wi}$. The viscosity ratio
 $\beta =\eta _s/\eta _0=\eta _s/(\eta _s+\eta _p)$ reflects the relative contribution of the solvent viscosity to the total zero-shear viscosity. The Weissenberg number is defined as
 ${Wi}=\dot {\gamma }\lambda$ and measures the relative shear rate to the relaxation rate
 $1/\lambda$.
2.2. Stress calculation
The momentum equation for the suspension is formally expressed as,
 \begin{equation} \frac{\textrm{D}}{\textrm{D}t}(\rho\boldsymbol{u}) =\boldsymbol{\nabla}\boldsymbol{\cdot}\boldsymbol{\varSigma}^{sus}, \end{equation}
where  $\textrm {D}/\textrm {D}t$ is the material derivative and
 $\boldsymbol {\varSigma }^{sus}$ represents the dispersion stress tensor, including the pressure, stresslet and fluid (viscous and polymer) stress. To analyse the effect of solid inclusion in the suspension rheology, the instantaneous volume-averaged stress of the suspension
 $\boldsymbol {\varSigma }^{sus}$ is decomposed according to Yang et al. (Reference Yang, Krishnan and Shaqfeh2016) as follows:
 \begin{align} \boldsymbol{\sigma}^{sus} &=\frac{1}{V}\int_{D_V}\boldsymbol{\varSigma}^{sus}\,\textrm{d}\boldsymbol{r} \end{align}
 \begin{align} &=\boldsymbol{\sigma}^{F0}+\frac{N}{V}(\boldsymbol{\varSigma}+ \boldsymbol{\mathsf{S}}), \end{align}
 \begin{align} \boldsymbol{\varSigma} &=\frac{1}{N}\int_{D_V}(\boldsymbol{\sigma}^F-\boldsymbol{\sigma}^{F0})\, \mathrm{d}\boldsymbol{r}, \end{align}
 \begin{align} \boldsymbol{\mathsf{S}} &=\frac{1}{N}\int_{S_p}(\boldsymbol{r} (\boldsymbol{n}\boldsymbol{\cdot}\boldsymbol{\sigma}^F))^{sym}\,\mathrm{d}S. \end{align}
Here  $D_V$ is the entire domain,
 $V$ is the volume of
 $D_V$ and
 $S_p$ is the surface of the particles;
 $\boldsymbol {\sigma }^F$ is the stress in the fluid region and
 $\boldsymbol {\sigma }^{F0}$ is the fluid stress without particles under simple shear flow;
 $(\boldsymbol{\mathsf{A}})^{sym}$ denotes the symmetric part of a tensor
 $\boldsymbol{\mathsf{A}}$;
 $\boldsymbol {\varSigma }$ represents the stress induced by particle inclusion per particle in the fluid region; and
 $\boldsymbol{\mathsf{S}}$ is the stresslet.
In the SPM formalism, by comparing (2.1) with (2.11), the following relation is obtained:
 \begin{equation} \boldsymbol{\nabla}\boldsymbol{\cdot}\boldsymbol{\varSigma}^{sus} =\boldsymbol{\nabla}\boldsymbol{\cdot}(\boldsymbol{\sigma}_n +\boldsymbol{\sigma}_p)+\rho\phi\boldsymbol{f}_p. \end{equation}
Therefore,  $\boldsymbol {\sigma }^{sus}$ is evaluated as (Nakayama et al. Reference Nakayama, Kim and Yamamoto2008; Iwashita & Yamamoto Reference Iwashita and Yamamoto2009; Molina et al. Reference Molina, Otomura, Shiba, Kobayashi, Sano and Yamamoto2016)
 \begin{equation} \boldsymbol{\sigma}^{sus}=\frac{1}{V}\int_{D_V}[\boldsymbol{\sigma}_n+ \boldsymbol{\sigma}_p-\boldsymbol{r}\rho\phi\boldsymbol{f}_p]\,\textrm{d} \boldsymbol{r}, \end{equation}
where an identity for a second-rank tensor,  $\boldsymbol {\sigma }= [\boldsymbol {\nabla }\boldsymbol {\cdot }(\boldsymbol {r\sigma })]^\textrm {T}- \boldsymbol {r}\boldsymbol {\nabla }\boldsymbol {\cdot }\boldsymbol {\sigma }$ is used for the derivation. In this study, the Reynolds stress term is not considered due to the small-Reynolds-number conditions. By assuming ergodicity, the ensemble average of the stress
 $\langle \boldsymbol {\sigma }^{sus}\rangle$ is equated to the average over time.
Evaluation of (2.14) and (2.15) requires surface or volume integrals. To calculate these integrals numerically using the immersed boundary method, the appropriate location of the particle–fluid interface should be carefully examined (Yang & Shaqfeh Reference Yang and Shaqfeh2018b). In contrast, in SPM, due to the diffuse interface of the smoothed profile function, both  $\boldsymbol {\varSigma }$ and
 $\boldsymbol{\mathsf{S}}$ are evaluated by the volume integral as follows. By comparing (2.17) and (2.13)–(2.15), we have
 \begin{gather} \boldsymbol{\varSigma}\approx\frac{1}{N}\int_{D_V} [ (1-{\lfloor\phi\rfloor} )(\boldsymbol{\sigma}_n+\boldsymbol{\sigma}_p)^F -(\boldsymbol{\sigma}_n+\boldsymbol{\sigma}_p)^{F0}]\,\textrm{d}\boldsymbol{r}, \end{gather}
 \begin{gather}\boldsymbol{\mathsf{S}}\approx{-}\frac{1}{N}\int_{D_V} \boldsymbol{r}\rho\phi\boldsymbol{f}_p\,\textrm{d}\boldsymbol{r}. \end{gather}
Equation (2.19) indicates the relation between the stresslet and SPM body force  $\rho \phi \boldsymbol {f}_p$. Since the stresslet is originated from the stress within a particle, it is calculated with
 $\rho \phi \boldsymbol {f}_p$ that originates from the particle rigidity. Note that, in the particle region, there is no viscous stress or polymer stress, i.e.
 $\boldsymbol {\sigma }^F=0$ in principle. In (2.18), this property is explicitly accounted for with the prefactor
 $(1-\lfloor \phi \rfloor )$, where
 $\lfloor \cdot \rfloor$ is the floor function. In practice, this prefactor is also effective in explicitly suppressing the accumulated numerical error in the stress field in the particle region when calculating
 $\boldsymbol {\varSigma }$. This method of calculating the stress components in SPM was examined in our previous paper (Matsuoka et al. Reference Matsuoka, Nakayama and Kajiwara2020), and the results agreed with those determined by a surface-conforming mesh method (Yang & Shaqfeh Reference Yang and Shaqfeh2018a).
2.3. Boundary conditions
To explain the boundary conditions of the sheared system, the single-particle system that is applied in § 3.1 is taken as an example. Figure 1 shows schematic diagrams of the simulation system. One particle is located in the centre  $(r_x=r_y=r_z=0)$ of a cubic domain of
 $[-L/2,L/2]^3$, where
 $L$ is the box length of the domain. Here
 $x$,
 $y$ and
 $z$ indicate the flow, velocity-gradient and vorticity directions, respectively. Then, simple shear flow
 $\boldsymbol {U}=\dot {\gamma }r_y\boldsymbol {e}_x$ is imposed by the time-dependent oblique coordinate system explained in appendix A, where
 $\boldsymbol {e}_i\ (i=x,y,z)$ is the Cartesian basis set. The corresponding velocity boundary conditions at the faces of the system are naturally established by the periodicity as follows:
 \begin{gather} \boldsymbol{u}(L/2,r_y,r_z)=\boldsymbol{u}({-}L/2,r_y,r_z), \end{gather}
 \begin{gather}\boldsymbol{u}(r_x,L/2,r_z)=\boldsymbol{u}(r_x-\gamma L,-L/2,r_z)-\dot{\gamma}L\boldsymbol{e}_x, \end{gather}
 \begin{gather}\boldsymbol{u}(r_x,r_y,L/2)=\boldsymbol{u}(r_x,r_y,-L/2), \end{gather}
where the simple periodic boundary conditions for the flow (2.20) and vorticity (2.22) directions and the shear periodic boundary condition for the velocity-gradient (2.21) direction are established. The periodic boundary conditions for the conformation tensor are the same as (2.20)–(2.22) except that the last term in (2.21) is not included.
Schematic diagrams of the simulation set-up: (a) single-particle system and (b) the sliding cell interpretation of Lees–Edwards boundary conditions. Here  $U_x=\dot {\gamma }r_y$ represents the velocity of the mean shear flow; and
 $L$ is the box length of the cubic domain. In (b), the image cells along the vorticity direction are not shown for simplicity.

Lees–Edwards boundary conditions for particles can be interpreted as a sliding cell expression, as shown in figure 1(b). Initially, the image cells are aligned along all directions infinitely. Under simple shear flow, the upper and lower image cell layers stacked in the velocity-gradient direction slide in the flow direction with velocity  $U_x=\pm \dot {\gamma }L$. The position and velocity of the particle going across the top and bottom faces of the main cell are modified as if the particle moved into the sliding image cell. These periodic boundary conditions in our method are preferred in evaluating bulk suspension rheology without the influence of the shear-driving walls. In our previous study, using this boundary condition, 3-D steady shear simulations for a single-particle viscoelastic suspension system were conducted (Matsuoka et al. Reference Matsuoka, Nakayama and Kajiwara2020). Similar periodic boundary conditions were adopted for two-dimensional (2-D) steady shear flow simulations (Hwang et al. Reference Hwang, Hulsen and Meijer2004; Jaensson et al. Reference Jaensson, Hulsen and Anderson2015) and 3-D dynamic shear flow simulations (D'Avino et al. Reference D'Avino, Greco, Hulsen and Maffettone2013) of viscoelastic suspensions. In contrast to recent 3-D steady shear flow simulations for many-particle systems which utilize walls to impose the shear flow (Yang & Shaqfeh Reference Yang and Shaqfeh2018b; Vázquez-Quesada et al. Reference Vázquez-Quesada, Espa nol, Tanner and Ellero2019), this study presents for the first time wall-free 3-D steady shear flow simulations for a many-particle viscoelastic suspension system. The details of the numerical solution procedure are described in appendix B.
3. Results and discussion
In this section, the developed DNS method is applied to the rheological evaluations of sheared viscoelastic suspensions. First, to show the validity of rheological evaluations by our developed DNS method, the suspension viscosity of the single-particle dilute system is evaluated and compared to previously reported numerical and theoretical results. Further examinations of our DNS method are explained in appendix C. Next, detailed rheological evaluation is conducted for a semidilute viscoelastic suspension, which contains many particles immersed in a multi-mode Oldroyd-B fluid, and the results are compared with previously reported experimental results.
3.1. Suspension rheology of single-particle system
A perturbation analysis of the suspension in a single-mode Oldroyd-B medium by Einarsson et al. (Reference Einarsson, Yang and Shaqfeh2018) predicted the shear thinning in the stresslet and the shear thickening in the particle-induced fluid stress at  $O(\phi _p{Wi}^2)$:
 \begin{equation} \eta_r=1+2.5\phi_p+\phi_p(1-\beta)(\alpha_S^{{stresslet}}+\alpha_S^{{fluid}}), \end{equation}
where  $\alpha _S^{{stresslet}}=-1.43{Wi}^2-0.06(1-\beta ){Wi}^2$ and
 $\alpha _S^{{fluid}}=2.05{Wi}^2+0.03(1-\beta ){Wi}^2$ are the contributions from the stresslet and particle-induced fluid stress (§ 2.2), respectively. DNS of a single particle in an Oldroyd-B medium by Yang & Shaqfeh (Reference Yang and Shaqfeh2018a) showed shear thickening in the particle-induced fluid stress around a particle. To confirm that the method developed in this work can be applied for rheological evaluation, the viscosity and the bulk stress of a single-particle suspension in an Oldroyd-B medium is evaluated. The numerical set-up is the same as that explained in § 2.3 (figure 1a). The system size is
 $L=128\varDelta$ and the particle radius and interfacial thickness are
 $a=8\varDelta$ and
 $\xi =2\varDelta$, respectively. This corresponds to
 $\phi _p=0.001023$. All calculations are conducted with a small Reynolds number
 ${Re}\leqslant 0.051$, i.e. the effect of inertia is negligible.
Figure 2 shows the  ${Wi}$ dependence of the steady-state relative shear viscosity,
 $\eta _r=\langle \sigma _{xy}^{{sus}}\rangle /(\eta _0\dot {\gamma })$, of the single-mode Oldroyd-B suspension at
 $\beta =0.5$. Shear thickening is observed in the suspension viscosity for increasing
 ${Wi}$. In the
 ${Wi}\rightarrow 0$ limit, the relative viscosity (
 $\eta _{r,0}=1.002522$, which is obtained from fitting the numerical results at low
 ${Wi}$ by using
 $\eta _r=\eta _{r,0}+b_{{f}}{Wi}^2$) approaches Einstein's theoretical value,
 $\eta _r=1+2.5\phi _p=1.002557$. The small discrepancy from the theoretical value in
 $\eta _{r,0}$ is mostly attributed to the stresslet contribution and is suggested to be due to the diffused interface of the particle surface in SPM. The developed method reveals the
 ${Wi}^2$ dependence as predicted by (3.1) at roughly
 ${Wi}<1$; the inset of figure 2 shows this clearer, where the thickening part
 $\eta _r-\eta _{r,0}$ in the relative viscosity is shown. However, at
 ${Wi}\gtrsim 1$, shear thickening is slower than
 ${Wi}^2$ growth because the perturbation analysis is expected to be valid at
 ${Wi}\ll 1$. For a more detailed comparison,
 $\alpha _S^{{stresslet}}$ and
 $\alpha _S^{{fluid}}$ at
 $\beta =0.5$ are evaluated separately as
 \begin{gather} \alpha_S^{{stresslet}}=\frac{N\langle {\mathsf{S}}_{xy}\rangle/V -\eta_0\dot{\gamma}(\eta_{r,0}-1)}{\eta_0\dot{\gamma}\phi_p(1-\beta)}, \end{gather}
 \begin{gather}\alpha_S^{{fluid}}=\frac{N\langle \varSigma_{xy}\rangle/V -\eta_p\dot{\gamma}}{\eta_0\dot{\gamma}\phi_p(1-\beta)}, \end{gather}
as shown in figure 3 with a previous DNS result obtained by using a surface-conforming mesh (Einarsson et al. Reference Einarsson, Yang and Shaqfeh2018); the results agree with the DNS by Einarsson et al. By comparing with DNS results, the  $O({Wi}^2)$ prediction (solid line) is found to be valid at
 ${Wi} \lesssim 0.3$ for
 $\alpha _S^{{stresslet}}$ and
 ${Wi} \lesssim 0.5$ for
 $\alpha _S^{{fluid}}$. At higher
 ${Wi}$ values, the
 ${Wi}$ dependence is slower than
 ${Wi}^2$ growth, which is observed both in
 $|\alpha _S^{{stresslet}}|$ and in
 $\alpha _S^{{fluid}}$.
The  ${Wi}$ dependence of the relative viscosity of a dilute Oldroyd-B suspension at
 $\beta =0.5$. The inset shows the
 ${Wi}$ dependence of the thickening part of
 $\eta _r$. Red open circles represent results from this work. The black lines correspond to the theoretical prediction by Einarsson et al. (Reference Einarsson, Yang and Shaqfeh2018) using (3.1).

The  ${Wi}$ dependence of (a) stresslet
 $\alpha _S^{{stresslet}}$ and (b) particle-induced fluid stress
 $\alpha _S^{{fluid}}$ contributions to the suspension viscosity at
 $\beta =0.5$. Red filled circles represent results from this work, and blue squares are the DNS results by Einarsson et al. (Reference Einarsson, Yang and Shaqfeh2018). The black line is plotted according to the theory by Einarsson et al. (Reference Einarsson, Yang and Shaqfeh2018).

The agreement between the obtained results and those from perturbation theory and a previous DNS study verifies the capability of the developed SPM for the rheological evaluation of suspensions in viscoelastic media. By using the presented numerical method, the influence of  $\beta$ on the rheology of a dilute suspension in an Oldroyd-B medium has been explored in detail (Matsuoka et al. Reference Matsuoka, Nakayama and Kajiwara2020).
3.2. Suspension rheology of many-particle system
For dilute and semidilute particle concentrations, the rheology of many-particle systems is studied in contrast to the single-particle system considered in § 3.1. The numerical condition in this study is decided in accordance with the experimental conditions previously reported by Yang & Shaqfeh (Reference Yang and Shaqfeh2018b). They have performed detailed rheological measurements of a viscoelastic medium, including the elongation viscosity, in addition to rheological measurements of a suspension system. Thus, their experimental results are likely to be the most complete dataset available for quantitative rheological evaluation by DNS. Furthermore, as mentioned in their paper, wall effects for the rheological measurements are expected to be negligible in their experiments, which is suitable for our shear periodic boundary condition explained in § 2.3.
3.2.1. Numerical conditions
The system and particle sizes are the same as in § 3.1, i.e.  $L=128\varDelta$,
 $a=8\varDelta$ and
 $\xi =2\varDelta$. Considering dilute to semidilute particle concentrations, one has
 $\phi _p=0.001$, 0.025, 0.05 and
 $0.1$ by setting the number of particles to 1, 24, 49 and 98, respectively. The initial positions of the particles are set to be randomly distributed and non-overlapping, with the inter-surface distance set to at least
 $2\varDelta$. For each
 $\phi_p$ except for
 $\phi_p=0.001$ (single-particle system), at least three different realizations are calculated. An experimental result reported by Yang & Shaqfeh (Reference Yang and Shaqfeh2018b) is considered where the rheology of a suspension in a Boger fluid consisting of polybutene, polyisobutylene and kerosene was evaluated. For the rheological characterization of the Boger fluid, both steady-shear and small-amplitude oscillatory shear (SAOS) measurements were reported (Yang & Shaqfeh Reference Yang and Shaqfeh2018b). In principle, the parameters in the Oldroyd-B model can be estimated from either the steady-shear or SAOS data; however, due to the limited range of the rate window, the zero-shear first NSD was available only from the SAOS data. Furthermore, in their experiment, the suspension viscosity begins to show shear thickening at
 $\dot {\gamma }\approx 0.2\ \textrm {s}^{-1}$, a shear rate that is below the rate window of steady-shear
 $N_1$ data. Therefore, the parameters estimated from the SAOS data listed in table 1 are used here to solve the corresponding four-mode Oldroyd-B fluid as a suspending medium. Note that Yang & Shaqfeh (Reference Yang and Shaqfeh2018b) also reported the DNS prediction with experimental data, where, in contrast to this work, the single-mode Oldroyd-B model with parameters estimated from the steady-shear property of the suspending Boger fluids resulted in an underestimation of the suspending viscosity. The discrepancy between their simulation and experimental results is discussed later (§ 3.2.3).
Parameters for a four-mode Oldroyd-B fluid. The values are from table 1 of Yang & Shaqfeh (Reference Yang and Shaqfeh2018b), which are estimated from the small-amplitude oscillatory shear measurement of a Boger fluid.

After the steady state is reached, the viscometric functions of the many-particle suspension are time-averaged over at least  $\dot {\gamma }\Delta t=10$ from
 $\dot {\gamma }t \geqslant 10\max \{1,\dot {\gamma }\lambda ^{(1)}\}$. Finally, the time-averaged values are ensemble-averaged over different realizations to obtain the viscometric functions of bulk suspensions. The error bars in the following figures correspond to three times the standard deviation from the sample mean. The Weissenberg number is defined based on the longest relaxation time
 $\lambda ^{(1)}=3.2\ \textrm {s}$ as
 ${Wi}=\dot {\gamma }\lambda ^{(1)}$. All calculations were conducted at a small Reynolds number
 ${Re}\leqslant 0.018$ where the effect of inertia is not significant.
3.2.2. Suspension viscosity and first NSD coefficient
Figure 4 shows the steady-state suspension viscosity normalized by  $\eta _0$ for different
 ${Wi}$ as functions of
 $\phi _p$; the theoretical trends for a Newtonian suspension in the creeping flow regime are also shown. Here,
 $\eta _r=1+2.5\phi _p+\alpha \phi _p^2$, where
 $\alpha =0$ for Einstein (Reference Einstein1911) theory (short-dashed line) and
 $\alpha =5.2$ for Batchelor & Green (Reference Batchelor and Green1972) theory (long-dashed line). In addition, the empirical Eilers fit for the numerical result of Newtonian suspensions by Haddadi & Morris (Reference Haddadi and Morris2014),
 $\eta _r=(1+\frac {1}{2}[\eta ]\phi _p/(1-\phi _p/\phi _{p,m}))^2$, with
 $[\eta ]=2.5$ and
 $\phi _{p,m}=0.63$, is also plotted (solid line). At
 ${Wi}=0.1$, the suspension viscosity agrees well with the predictions by Batchelor–Green and Eilers fit for Newtonian suspensions. This is expected because the polymer stress is expected to fully relax at
 ${Wi}\ll 1$ to exhibit almost Newtonian behaviour. In contrast, as
 ${Wi}$ increases, the suspension viscosity increases to be above the prediction for Newtonian suspensions.
The  $\phi _p$ dependence of the relative viscosity of suspensions at
 ${Wi}=0.1$ (blue circles),
 $0.5$ (green triangles),
 $1.0$ (orange squares) and
 $2.0$ (red diamonds). The short-dashed and long-dashed lines correspond to the theoretical predictions for a Newtonian suspension by Einstein (Reference Einstein1911) and Batchelor & Green (Reference Batchelor and Green1972), respectively. The empirical prediction from Haddadi & Morris (Reference Haddadi and Morris2014) is shown as a solid line.

In figure 5, the viscosity (figure 5a) and first NSD coefficient (figure 5b) as functions of  ${Wi}$ are compared with the experimental result by Yang & Shaqfeh (Reference Yang and Shaqfeh2018b) for different
 $\phi _p$. The viscosity at the
 ${Wi}\to 0$ limit calculated by Eilers fit in figure 4 for each
 $\phi _{p}$ is also shown in figure 5(a). The numerical results of this work agree quantitatively with the experimental results up to a semidilute case of
 $\phi _{p}=0.1$. The first NSD coefficient of the suspension,
 $\varPsi _1=\langle \sigma _{xx}^{{sus}}-\sigma _{yy}^{{sus}}\rangle /\dot {\gamma }^2$, normalized by that of the medium, is shown in figure 5(b). As
 ${Wi}$ increases,
 $\varPsi _{1,r}$ also increases. Although the ranges of
 ${Wi}$ of the experimental and numerical results do not overlap, the numerical results of this work smoothly connect with the experimental results.
Viscometric functions of suspensions as functions of  ${Wi}$ and
 $\phi _p$: (a) relative viscosity and (b) relative first NSD coefficient of suspensions. The closed symbols are simulated results from this work, and the open symbols are experimental results from Yang & Shaqfeh (Reference Yang and Shaqfeh2018b). The blue squares, green triangles and red circles correspond to the results for
 $\phi _p=0.025$, 0.05 and
 $0.1$, respectively. Experimental
 $\eta _{r}$ and
 $\varPsi _{1,r}$ are calculated using
 $\eta (\phi _p, \dot {\gamma })$ and
 $\varPsi _{1}(\phi _p, \dot {\gamma })$ reported by Yang & Shaqfeh (Reference Yang and Shaqfeh2018b). The dashed lines in (a) are values predicted by the Eilers fit (Haddadi & Morris Reference Haddadi and Morris2014). Solid lines are guides to the eye. The insets in (a,b) show the DNS results at
 $\phi _p=0.1$ by the multi-mode model (red circles) and the effective single-mode model (black squares) explained in § 3.2.3.

Note that, while the DNS results agree with the experimental  $\eta _r$, the DNS using an Oldroyd-B model reported by Yang & Shaqfeh (Reference Yang and Shaqfeh2018b) underestimated it. The main difference between this work and that of Yang & Shaqfeh is the estimation of the zero-shear
 $N_{1}$ of the suspending Boger fluid;
 $N_{1}$ from the SAOS measurement is approximately twice as large as that from the steady-shear measurement; the difference occurs because the steady-shear measurement did not reach the terminal region and showed a decreased
 $N_{1}$. These results suggest that predicting suspension shear thickening at around
 ${Wi}=1.0$ requires an accurate estimation of
 $N_1$ of the suspending medium in the shear-rate range where the shear thickening starts to occur. For the Boger fluid used in Yang & Shaqfeh (Reference Yang and Shaqfeh2018b), this range is supposed to be the terminal region, which cannot be reached by the steady-shear measurement. The estimation of
 $N_1$ directly affects the level of polymer stress around the particles, because, as past studies on dilute systems have revealed (Yang & Shaqfeh Reference Yang and Shaqfeh2018a; Matsuoka et al. Reference Matsuoka, Nakayama and Kajiwara2020), the elastic stress due to the stretched conformation nearby upstream of the particles contributes to the macroscopic shear stress. In Yang & Shaqfeh (Reference Yang and Shaqfeh2018b), their model's underestimation of the medium's elongational property is argued to be one reason why their DNS prediction underestimates the measured shear thickening of suspensions. Although our four-mode Oldroyd-B model shows slightly higher elongational viscosity than that by the single-mode model used in Yang & Shaqfeh (Reference Yang and Shaqfeh2018b), our multi-mode model still underestimates the measured elongational viscosity of the medium. This result suggests that suspension shear thickening in Boger fluids at around
 $Wi=1.0$ can be predicted with the Oldroyd-B model without additional modelling of the elongational response.
To demonstrate the difference between many-particle and single-particle systems at dilute conditions, a single-particle simulation is conducted at  $\phi_p\approx0.025$ by setting the particle radius
 $a=23\varDelta$ and system size
 $L=128\varDelta$ in the single-particle system shown in figure 1(a); the Reynolds number is kept small (
 ${Re}=0.076$). Because of the periodic boundary conditions, this single-particle system corresponds to the sheared cubic array system shown in figure 1(b). In figure 6(a), the suspension viscosity between single-particle (cubic array structure) and many-particle (random structure) systems is compared. The single-particle result indicates lower viscosity, whereas the shear-thickening behaviour is almost the same as that of the many-particle system. At
 ${Wi}\rightarrow 0$, the viscosity from the single-particle system agrees with the Einstein prediction. This also agrees with the results of a cubic array system in a Newtonian medium (Nunan & Keller Reference Nunan and Keller1984; Phan-Thien, Tran-Cong & Graham Reference Phan-Thien, Tran-Cong and Graham1991). Correspondingly,
 $\langle {\mathsf{S}}_{xy}\rangle$ for the single-particle system agrees with the Einstein stresslet (the inset of figure 9a).
DNS results at  $\phi _p=0.025$: (a) suspension viscosity for single-particle (red circles) and many-particle (blue squares) systems; and (b) microstructure in a many-particle system at
 ${Wi}=2.0$. In (a), the black lines are predictions for Newtonian suspensions according to the theories of Batchelor & Green (dashed) and Einstein (dot-dashed). Solid lines are guides to the eye.

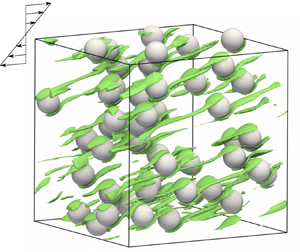
Figure 6(b) shows the microstructure of the many-particle system in a sheared steady state at  $\phi _p=0.025$ and
 ${Wi}=2$. In many-particle systems, particles are randomly dispersed and occasionally get very close to each other, which induces the large stresslet contribution. On the other hand, in the single-particle system, the inter-particle distance remains above a certain level as shown in figure 1(b). Therefore, the viscosity shift between the two systems is attributed to the difference in the stresslet contribution by microstructures. Note that particle alignment, which is sometimes observed experimentally in suspensions with viscoelastic fluids (Michele et al. Reference Michele, Pätzold and Donis1977; Scirocco et al. Reference Scirocco, Vermant and Mewis2004), is not observed at all
 $\phi _p$ and
 ${Wi}$ in our study. This suggests that our simulation conditions are out of range for an alignment critical condition predicted by DNS using Oldroyd-B and Giesekus matrices (Hwang & Hulsen Reference Hwang and Hulsen2011; Jaensson, Hulsen & Anderson Reference Jaensson, Hulsen and Anderson2016). The result from this work, showing that the suspension microstructure affects the viscosity even at dilute conditions, is consistent with the results of a previous study (Vázquez-Quesada et al. Reference Vázquez-Quesada, Espa nol, Tanner and Ellero2019). Furthermore, similar shear-thickening behaviour independent of the microstructures suggests that the shear thickening at dilute conditions is mainly originated from the polymer stress in the vicinity of a particle, which is consistent with a previous study (Yang & Shaqfeh Reference Yang and Shaqfeh2018a,b).
3.2.3. Relaxation mode decomposition of polymer stress
In the modelling of the suspensions in a Boger fluid, the four-mode Oldroyd-B model is used for the suspending medium. The separate contributions from each relaxation mode to the suspension shear thickening are discussed. The viscosity and the first NSD coefficient from the  $k$th mode are defined as
 $\langle \eta _{p}^{(k)} \rangle \equiv [\int _{D_V}(1-\lfloor \phi \rfloor )\sigma _{p,xy}^{(k)} \,\textrm {d}\boldsymbol {r}/V]/\dot {\gamma }$ and
 $\langle \varPsi _{1,p}^{(k)} \rangle \equiv [\int _{D_V}(1-\lfloor \phi \rfloor )(\sigma _{p,xx}^{(k)}-\sigma _{p,yy}^{(k)})\, \textrm {d}\boldsymbol {r}/V]/\dot {\gamma }^2$ (
 $k=1,2,3,4$), respectively. Figure 7 shows the
 $k$th viscosity normalized by
 $\eta _0$ and the
 $k$th first NSD coefficient normalized by
 $\varPsi _1$ at
 $\phi _p=0$ as functions of
 ${Wi}$ at
 $\phi _p=0.1$. Both for the viscosity (figure 7a) and for the first NSD coefficient (figure 7b), only the first mode exhibits shear thickening, whereas the other faster modes show a rate-independent contribution. This is expected, because the
 ${Wi}$ considered here is much smaller than
 $\lambda ^{(1)}/\lambda ^{(2)}=12.3$; the elastic stress from the second and subsequent modes fully relaxes to show a zero-shear response.
Proportions of each relaxation mode in the polymer stress contribution (for  $k=1$ (red circles), 2 (orange triangles), 3 (green squares) and 4 (blue diamonds), and the sum of the mode contributions (black downward-pointing triangles)): (a) shear viscosity and (b) first NSD coefficient at
 $\phi _p=0.1$. The values of
 $\langle \eta _{p}^{(k)}\rangle$ and
 $\langle \varPsi _{1,p}^{(k)}\rangle$ are normalized by
 $\eta _0$ and
 $\varPsi _1(\phi _p=0)=2\sum _{k=1}^4\eta _p^{(k)}\lambda ^{(k)}$, respectively. Note that the stresslet contributions are not included in the figure. Lines are guides to the eye. By definition, the order of
 $\langle \eta _{p}^{(k)}\rangle$ and
 $\langle \varPsi _{1,p}^{(k)}\rangle$ at
 ${Wi}\rightarrow 0$ corresponds to the order of
 $\eta _p^{(k)}$ and
 $\eta _p^{(k)}\lambda ^{(k)}$ in table 1, respectively. That is why
 $\langle \eta _{p}^{(4)}\rangle >\langle \eta _{p}^{(3)}\rangle$ in (a). In (b),
 $\langle \varPsi _{1,p}^{(4)}\rangle$ is not shown because it is smaller than
 $\langle \varPsi _{1,p}^{(3)}\rangle$.

The results in figure 7 suggest that single-mode modelling for the suspending medium is likely to be sufficient to predict the rheological response at the  ${Wi}\leqslant 2.5$ considered in the current simulation. If only the first mode is responsible for the polymer stress, the effective parameters for a single-mode Oldroyd-B fluid are determined from table 1 to be
 $\lambda ^{eff}=\lambda ^{(1)}=3.2$ s,
 $\eta _p^{eff}=\eta _p^{(1)}=0.67\ \textrm {Pa}\ \textrm {s}$ and
 $\eta _{s}^{eff}=\eta _{s}+\sum _{k=2}^4\eta _{p}^{(k)}=2.81\ \textrm {Pa}\ \textrm {s}$, resulting in
 $\beta ^{{eff}}=\eta _{s}^{{eff}}/\eta _0=0.807$. This effective
 $\beta$ value is smaller than the
 $\beta =0.9$ used in DNS (Yang & Shaqfeh Reference Yang and Shaqfeh2018b), which underpredicted the experimental suspension rheology. In the inset of figure 5, the DNS result of the presented effective single-mode model (black squares) is compared with that of the multi-mode model (red circles), showing good agreement with the multi-mode results and thus experimental results (Yang & Shaqfeh Reference Yang and Shaqfeh2018b). This difference between the
 $\beta$ values originates from the difference in the estimation of the zero-shear NSD coefficient of the Boger fluid that was mentioned in § 3.2.2. In the system considered in this work, only
 $\lambda ^{(1)}$ is relevant to the studied range of
 ${Wi}$. Whether single-mode modelling can be used for the quantitative prediction of suspension rheology for other types of suspending media depends on both the relaxation time distribution of the fluid and the distribution of the local shear rate in the fluid, which is dependent on the fluid rheology as well as
 $\phi _{p}$. In § 3.2.5, we study how the local shear-rate distribution, flow pattern and the elastic stress development change with
 $\phi _{p}$ and
 ${Wi}$.
3.2.4. Decomposition of the total suspension stress
The  $\phi _p$ dependence of the shear thickening of the suspension in the Oldroyd-B medium is discussed. The contributions from the stresslet,
 $\boldsymbol{\mathsf{S}}$, and the particle-induced fluid stress,
 $\boldsymbol {\varSigma }$, to the suspension rheology are shown in figure 8, where the shear component is normalized by
 $\eta _0\dot {\gamma }a^{3}$ to correspond to a non-dimensional viscosity, and the first NSD component is normalized by
 $\eta _0\lambda ^{(1)}\dot {\gamma }^{2}a^{3}$ to correspond to the non-dimensional NSD coefficient. For the viscosity component in figure 8(a), as
 ${Wi}$ increases, the stresslet viscosity,
 $\langle {\mathsf{S}}_{xy}\rangle /(\eta _0\dot {\gamma }a^{3})$, decreases, and the particle-induced fluid viscosity,
 $\langle \varSigma _{xy}\rangle /(\eta _0\dot {\gamma }a^{3})$, increases more than the change in the stresslet viscosity. Specifically, at
 ${Wi}=2.0$, the decrease in
 $\langle {\mathsf{S}}_{xy}\rangle /(\eta _0\dot {\gamma }a^{3})$ is less than two, but the increase in
 $\langle \varSigma _{xy}\rangle /(\eta _0\dot {\gamma }a^{3})$ is more than three for all
 $\phi _{p}$ considered. This result clearly demonstrates that the shear thickening of the suspension viscosity originates from an increase in
 $\langle \varSigma _{xy}\rangle$, which is consistent with what has been reported in previous work (Yang & Shaqfeh Reference Yang and Shaqfeh2018a,b; Matsuoka et al. Reference Matsuoka, Nakayama and Kajiwara2020). As
 $\phi _p$ increases, the increase in
 $\langle \varSigma _{xy}\rangle /(\eta _0\dot {\gamma }a^{3})$ with
 ${Wi}$ is enhanced, whereas the decrease in
 $\langle {\mathsf{S}}_{xy}\rangle /(\eta _0\dot {\gamma }a^{3})$ with
 ${Wi}$ remains slow, which explains the enhancement of the shear thickening with
 $\phi _{p}$ shown in figure 5(a). For the first NSD component (figure 8b), the general trends with respect to
 ${Wi}$ and
 $\phi _p$ are similar to that of the viscosity component. These trends were also reported in a previous numerical study up to
 ${Wi}\leqslant 1.0$ (Yang & Shaqfeh Reference Yang and Shaqfeh2018b). Because
 $N_{1}$ is very small and
 $N_{1}\propto \langle {\mathsf{S}}_{xx-yy}\rangle$ at the
 ${Wi}\to 0$ limit, the numerical fluctuation in calculating such a small value is large for
 $\langle {\mathsf{S}}_{xx-yy}\rangle /(\eta _0\lambda ^{(1)}\dot {\gamma }^2a^3)$ at
 ${Wi}\leqslant 0.5$.
Contributions to the total suspension stress from stresslet  $\boldsymbol{\mathsf{S}}$ (red) and particle-induced fluid stress
 $\boldsymbol {\varSigma }$ (blue) at
 $\phi _p=0.001$ to 0.1 (from light to dark colour): (a) contributions to the total shear stress normalized by
 $\eta _0\dot {\gamma }a^3$; and (b) contributions to the total first NSD normalized by
 $\eta _0\lambda ^{(1)}\dot {\gamma }^2a^3$. Solid lines are guides to the eye.

The reduction rate of the stresslet viscosity with  ${Wi}$ does not strongly depend on
 $\phi _{p}$. Therefore,
 $\langle {\mathsf{S}}_{xy}\rangle /(\eta _0\dot {\gamma }a^{3})$ is mainly determined by that at the
 ${Wi}\to 0$ limit. This reduction of
 $\langle \boldsymbol{\mathsf{S}}\rangle /(\eta _0\dot {\gamma }a^{3})$ with
 ${Wi}$ indicates the reduced viscous traction on the particles that originates from the increased fraction of the elastic energy dissipation with
 ${Wi}$, which is also related to the slowdown of the particle rotation rate with
 ${Wi}$ discussed in § 2. The change of
 $\langle {\mathsf{S}}_{xy}\rangle$ to that at the
 ${Wi}\to 0$ limit,
 $\langle {\mathsf{S}}_{xy,0}(\phi _{p})\rangle$, is plotted in figure 9(a) versus an effective Weissenberg number explained later; in figure 10(a), it is plotted against the suspension shear stress
 $\langle \sigma _{xy}^{{sus}}\rangle$ normalized by
 $\eta _0/\lambda ^{(1)}$. The numerical result for
 $\langle {\mathsf{S}}_{xy}\rangle$ at
 ${Wi}=0.1$ depicted in the inset of figure 9(a) almost agrees with the theoretical Batchelor–Green stresslet,
 $\langle {\mathsf{S}}_{xy,0}\rangle /(\eta _0\dot {\gamma }a^3)=(4{\rm \pi} /3) (2.5+\alpha \phi _p)$ for
 $\phi _p\leqslant 0.05$, and with the empirical Eilers stresslet fitted for numerical results by Haddadi & Morris (Reference Haddadi and Morris2014):
 \begin{equation} \frac{\langle{\mathsf{S}}_{xy,0}\rangle}{\eta_0\dot{\gamma}a^3} =\frac{4{\rm \pi}}{3\phi_p}\left[\left(1+\frac{\frac{1}{2}[\eta]\phi_p} {1-\phi_p/\phi_{p,m}}\right)^2-1\right], \end{equation}
for  $\phi _p \leqslant 0.1$. Based on this observation,
 $\langle {\mathsf{S}}_{xy,0}\rangle$ in figure 9(a) is calculated with (3.4).
Viscoelastic contributions to the total suspension shear stress as a function of the effective Weissenberg number at  $\phi _p=0.001$ to 0.1 (from light to dark colour). (a) Stresslet contribution to shear stress. The ordinate represents the polymeric part of
 $\langle {\mathsf{S}}_{xy}\rangle$, i.e.
 $\langle {\mathsf{S}}_{xy}\rangle -\langle {\mathsf{S}}_{xy,0}\rangle$, where
 $\langle {\mathsf{S}}_{xy,0}\rangle$ is the Newtonian part of
 $\langle {\mathsf{S}}_{xy}\rangle$ represented by (3.4). The inset shows the
 $\phi _p$ dependence of
 $\langle {\mathsf{S}}_{xy}\rangle$ at
 ${Wi}=0.1$ (red circles). The result from single-particle simulation at
 $\phi _p=0.025$ is also shown (red square). The black lines are predictions according to theories of Einstein (dotted), Batchelor & Green (dot-dashed) and Eilers fit by Haddadi & Morris (solid). The contributions for the shear stress are normalized by
 $\eta _0\dot {\gamma }a^3$. (b) Particle-induced fluid stress contributions for shear stress. The effective Weissenberg number
 $\widetilde {{Wi}}$ is defined with the average strain rate in the fluid region at each
 $\phi _p$. In both panels, the red and blue solid lines are guides to the eye.

Viscoelastic contributions to the total suspension shear stress as a function of the suspension shear stress at  $\phi _p=0.001$ to
 $0.1$ (from light to dark colour): (a) stresslet, (b) particle-induced fluid stress, (c) normalized polymer dissipation function of the first relaxation mode, and (d) the thickening portion of the relative viscosity. The suspension shear stress in the abscissa in each panel is non-dimensionalized as
 $\langle \sigma _{xy}^{{sus}}\rangle \lambda ^{(1)}/\eta _0$. Solid lines are guides to the eye.

In the suspension, a local shear rate can be larger than the applied rate  $\dot {\gamma }$. To take this into account, the effective Weissenberg number
 $\widetilde {{Wi}}= \tilde {\dot {\gamma }}\lambda ^{(1)}$ is defined by using the average shear rate
 $\tilde {\dot {\gamma }}(\phi _p,{Wi})=\sqrt {\langle 2\boldsymbol{\mathsf{D}} \boldsymbol {:}\boldsymbol{\mathsf{D}}\rangle _{{f}}}$, where
 $\langle A\rangle _{{f}}= \int _{D_V}(1-\lceil \phi \rceil )A \, \textrm {d} \boldsymbol {r}/[(1-\phi _{p})V]$ represents the volume average of a local variable
 $A$ over the fluid region and
 $\lceil \cdot \rceil$ indicates the ceiling function. For dilute cases (
 $\phi _p\leqslant 0.05$), the changes of the stresslet viscosity as a function of
 $\widetilde {{Wi}}$ in figure 9(a) are nearly coincident. For a semidilute case (
 $\phi _p=0.1$), the stresslet viscosity change agrees with the dilute cases for
 $\widetilde {{Wi}}\lesssim 1.5$. At higher
 $\widetilde {{Wi}}\gtrsim 1.5$, the negative slope of the stresslet viscosity becomes smaller than that in the dilute cases, though this change is not large compared to that at
 ${\mathsf{S}}_{xy,0}(\phi _{p})/(\eta _0\dot {\gamma }a^{3})$. The change of
 $\langle {\mathsf{S}}_{xy}\rangle /(\eta _0\dot {\gamma }a^{3})$ as a function of
 $\langle \sigma _{xy}^{{sus}}\rangle \lambda ^{(1)}/\eta _{0}$ in figure 10(a) shows a similar trend to that presented in figure 9(a). Although both
 ${Wi}$ and
 $\phi _p$ increase
 $\widetilde {{Wi}}$ and thus the elastic contribution in the fluid, the stresslet changes with
 $\phi _p$ and
 $\widetilde {{Wi}}$ at
 $\phi _p=0.1$ are in opposite directions. This suggests the stresslet change due to microstructure at
 $\phi _p=0.1$ in addition to the change induced by polymer stress around individual particles. For
 $\langle {\mathsf{S}}_{xx-yy}\rangle$, the large error at
 ${Wi}=0.1$ makes it difficult to evaluate the analysis as it is done for
 $\langle {\mathsf{S}}_{xy}\rangle$.
Next, the particle-induced fluid viscosity  $\langle \varSigma _{xy}\rangle /(\eta _0\dot {\gamma }a^{3})$ which directly accounts for the elastic stress is discussed. At
 $\widetilde {{Wi}}\lesssim 1$ in figure 9(b), the particle-induced fluid viscosity does not depend on
 $\phi _p$ because the elastic stress almost relaxes at
 $\widetilde {{Wi}}\lesssim 1$. This region of
 $\widetilde {{Wi}}$ corresponds to the zero-shear plateau of the suspension viscosity. At
 $\widetilde {{Wi}}> 1$, the increase of
 $\langle \varSigma _{xy}\rangle /(\eta _0\dot {\gamma }a^{3})$ with
 $\widetilde {{Wi}}$ is enhanced as
 $\phi _p$ increases, indicating increased elastic stress with
 $\phi _p$. Since the elastic stress is dependent on flow history and is not a simple function of the shear rate, the rate of increase of
 $\langle \varSigma _{xy}\rangle /(\eta _0\dot {\gamma }a^{3})$ with respect to
 $\widetilde {{Wi}}$ changes with
 $\phi _{p}$.
The plot of  $\langle \varSigma _{xy}\rangle /(\eta _0\dot {\gamma }a^{3})$ as a function of
 $\langle \sigma _{xy}^{{sus}}\rangle \lambda ^{(1)}/\eta _{0}$ in figure 10(b) does not depend on
 $\phi _p$ for dilute conditions (
 $\phi _p\leqslant 0.05$), which is consistent with the previous work (Yang & Shaqfeh Reference Yang and Shaqfeh2018b). At a semidilute condition (
 $\phi _p=0.1$),
 $\langle \varSigma _{xy}\rangle /(\eta _0\dot {\gamma }a^{3})$ is slightly lower than that in the dilute cases, but the rate of increase is almost the same as that in the dilute condition. In figure 10(b), after a slow increase at
 $\langle \sigma _{xy}^{{sus}}\rangle \lambda ^{(1)}/\eta _{0}\ll 1$, the particle-induced fluid viscosity increases linearly to
 $\langle \sigma _{xy}^{{sus}}\rangle \lambda ^{(1)}/\eta _{0}\gtrsim 0.5$. The purely elastic contribution is directly evaluated by the polymer dissipation function,
 $\varPhi _p^{(k)}= (\eta _p^{(k)}/(2(\lambda ^{(k)})^2))\{\textrm {tr}\,\boldsymbol{\mathsf{C}}^{(k)}+\textrm {tr}\,\boldsymbol{\mathsf{C}}^{(k)-1}-6\}$. By using
 $\varPhi _p$, an extra elastic contribution compared to a pure Oldroyd-B fluid is discussed in Vázquez-Quesada et al. (Reference Vázquez-Quesada, Espa nol, Tanner and Ellero2019). By definition, the polymer dissipation function is a scalar of
 $\boldsymbol{\mathsf{C}}$ and thus independent of the direction of
 $\boldsymbol{\mathsf{C}}$;
 $\textrm {tr}\,\boldsymbol{\mathsf{C}}-3$ and
 $\textrm {tr}\,\boldsymbol{\mathsf{C}}^{-1}-3$ measure the stretch and compression of
 $\boldsymbol{\mathsf{C}}$, respectively.
Figure 10(c) shows the normalized polymer dissipation function of the first mode,  $2\langle \varPhi _p^{(1)}\rangle _{f}(\lambda ^{(1)})^2/\eta _p^{(1)}$, as a function of
 $\langle \sigma _{xy}^{{sus}}\rangle \lambda ^{(1)}/\eta _{0}$. Figure 10(c) shows that the normalized polymer dissipation function at different
 $\phi _p$ collapses onto a single master curve, directly suggesting the similarity of the elastic contribution up to
 $\phi _p\leqslant 0.1$.
Figure 10(d) shows the shear-thickening part per particle defined as  $\eta _{r,t}=[\eta _r(\phi _p,{Wi})-\eta _r(\phi _p,{Wi}\rightarrow 0)]/\phi _p$ as a function of suspension shear stress, where
 $\eta _r(\phi _p,{Wi}\rightarrow 0)$ is approximated by
 $\eta _r(\phi _p,{Wi}=0.1)$ because
 $\eta _r$ almost reaches the zero-shear plateau even at
 ${Wi}=0.1$. Up to semidilute cases (
 $\phi _p\leqslant 0.1$), the increases in
 $\eta _{r,t}$ with
 $\langle \sigma _{xy}^{{sus}}\rangle$ nearly coincide. Previous work (Yang & Shaqfeh Reference Yang and Shaqfeh2018b) reported that the variation of
 $\eta _{r,t}$ with
 $\langle \sigma _{xy}^{{sus}}\rangle$ did not depend on
 $\phi _p$ for
 $\phi _{p}\leqslant 0.1$, which is also confirmed in this work.
3.2.5. Flow characterization of viscoelastic suspension
The probability density functions (p.d.f.s) of the local shear rate  $\dot {\gamma }_{{local}}=\sqrt {2\boldsymbol{\mathsf{D}}\boldsymbol {:}\boldsymbol{\mathsf{D}}}$ in the fluid domain for different
 $\phi _p$ and
 ${Wi}$ are presented in figure 11(a). To sample the different particle configurations under flow for many-particle systems, the p.d.f. is calculated from data over 25 snapshots per sample (in all, 75 snapshots) at the steady state by every
 $\dot {\gamma }\Delta t=0.215$ strain increment in three different initial particle configuration samples. Here
 $\dot {\gamma }_{{local}}\neq \dot {\gamma }$ is from the inhomogeneous flow near the particles, whereas
 $\dot {\gamma }_{{local}}=\dot {\gamma }$ is mainly from the region far from the particles where the flow is close to homogeneous shear flow. For the same
 ${Wi}$, as
 $\phi _p$ increases, the shape of the p.d.f. broadens and the peak position in the p.d.f. gradually shifts towards large shear rate. This trend is clearly observed by the
 $\phi _p$ dependence of the mean
 $\langle \dot {\gamma }_{local}\rangle _{f}$ and standard deviation
 $\sigma (\dot {\gamma }_{local})$ (the inset in figure 11a). Specifically,
 $\dot {\gamma }_{{local}}/\dot {\gamma }\lesssim 2$ for
 $\phi _{p}=0.001$ (single-particle result), while
 $\dot {\gamma }_{{local}}/\dot {\gamma }\lesssim 5$ for
 $\phi _{p}=0.1$. In general, a large shear rate is effective in exciting the fast relaxation mode. At
 ${Wi}=0.1$, the normalized first relaxation rate
 $(\lambda ^{(1)}\dot {\gamma })^{-1}=10$ is beyond the range of the local shear rate for
 $\phi _{p}\leqslant 0.1$; therefore, the elastic response is irrelevant. At
 ${Wi}=2$, where the first mode is relevant, the normalized second relaxation rate is
 $(\lambda ^{(2)}\dot {\gamma })^{-1}=6.15$, thus indicating that the second mode is still irrelevant to the elastic response.
The  $\phi _p$ and
 ${Wi}$ dependence of the local strain rate in the fluid region. (a) P.d.f. of
 $\dot {\gamma }_{{local}}$, where
 $\phi _p=0.1$ (red), 0.05 (orange), 0.025 (green) and 0.001 (blue), and the dotted and solid lines represent p.d.f.s at
 ${Wi}=0.1$ and
 $2.0$, respectively. The strain rate is normalized by the imposed shear rate
 $\dot {\gamma }$, and the arrows indicate the first and second relaxation rates at
 ${Wi}=2.0$. The inset shows the
 $\phi _p$ dependence of the mean and standard deviation for
 $Wi=0.1$ (open symbols) and 2.0 (closed symbols). (b) P.d.f. of
 $\dot {\gamma }_{local}$ centred at the mean and normalized by the standard deviation. The inset shows the
 $\phi _p$ dependence of the skewness and kurtosis. The line types are the same as those in (a). The dashed line indicates the standard Gaussian distribution. (c) Average local strain rate, where blue squares and red circles correspond to
 $Wi=0.1$ and 2.0, respectively, and the line is the result from homogenization theory.

The p.d.f. of the local shear rate, which is centred at the mean and is normalized by the standard deviation, is shown in figure 11(b). At  $\phi _p=0.001$, the normalized p.d.f. is highly skewed and has fat tails. This corresponds to large positive values of the skewness
 $M_3(\dot {\gamma }_{local})$ and kurtosis
 $M_4(\dot {\gamma }_{local})$ (the inset in figure 11b), where
 $M_n(\,f)=\langle (\,f-\langle f\rangle _{f})^n\rangle _{f}/\sigma ^n(\,f)$ is the normalized
 $n$th-order statistic of
 $f$. As
 $\phi _p$ increases, the shape of the p.d.f. becomes closer to the Gaussian distribution (the dashed line), which corresponds to the decrease of
 $M_3(\dot {\gamma }_{local})$ and
 $M_4(\dot {\gamma }_{local})$. However, even at
 $\phi _p=0.1$, the p.d.f. remain positively skewed, suggesting the asymmetric nature of the local shear-rate distribution. In addition, the shape of the p.d.f. in figure 11(a,b) is not sensitive to the change in
 $Wi$.
Figure 11(c) shows the root-mean-square of the local shear rate,  $\tilde {\dot {\gamma }}=\sqrt {\langle \dot {\gamma }_{{local}}^2\rangle _{f}}$, as a function of
 $\phi$ at
 ${Wi}=0.1$ and
 $2.0$. This average shear rate increases with
 $\phi _p$ because the deformable fluid volume decreases with
 $\phi _p$. This phenomenon is expected to be common in solid suspensions. For comparison, a prediction for the average shear rate by a homogenization theory for viscous fluid (Chateau, Ovarlez & Trung Reference Chateau, Ovarlez and Trung2008),
 \begin{equation} \tilde{\dot{\gamma}}=\dot{\gamma} \sqrt{\frac{\eta_r(\phi_p,{Wi}\rightarrow0)}{1-\phi_p}}, \end{equation}
is drawn in figure 11(b), where  $\eta _r$ in (3.5) is calculated with the Eilers fit by Haddadi & Morris (Reference Haddadi and Morris2014). Although the increasing trend of the average shear rate with
 $\phi _p$ is similar, the average shear rate in the studied viscoelastic medium is slightly smaller than that predicted by (3.5). This is partly because (3.5) does not consider suspension microstructures explicitly. In fact, even for a Newtonian medium, (3.5) was reported to overestimate the suspension viscosity obtained by DNS at high
 $\phi _p$ (Alghalibi et al. Reference Alghalibi, Lashgari, Brandt and Hormozi2018). From figure 11, the level of shear rate is hardly affected by
 ${Wi}$ for
 ${Wi}\leqslant 2$, and the fluctuation of
 $\dot {\gamma }_{{local}}$ is mainly dominated by the solid volume fraction.
Next, the local flow pattern is discussed for different  $\phi _{p}$ and
 ${Wi}$. The topological aspect of the local flow pattern defined by
 $\boldsymbol {\nabla }\boldsymbol {u}$ can be characterized by two scalars: multi-axiality of the strain rate and irrotationality of
 $\boldsymbol {\nabla }\boldsymbol {u}$ (Nakayama, Kajiwara & Masaki Reference Nakayama, Kajiwara and Masaki2016). The multi-axiality of flow in the incompressible flow is conveniently identified by the strain-rate state, which is defined as
 \begin{equation} s=\frac{3\sqrt{6}\det\boldsymbol{\mathsf{D}}} {(\boldsymbol{\mathsf{D}}\boldsymbol{:}\boldsymbol{\mathsf{D}})^{3/2}}, \end{equation}
where  $s\in [-1,1]$ by definition. For uniaxial elongational flow, where stretching in one direction and compression in the other two directions occur,
 $s>0$, whereas for biaxial elongational flow, where compression in one direction and stretching in the other two directions occur,
 $s<0$. For planar flow, where stretching occurs in one direction, compression occurs in another direction and no strain is found in the other direction,
 $s=0$. The magnitude of
 $s$ is determined by the relative magnitude of the three principal strain rates of
 $\boldsymbol{\mathsf{D}}$. Figure 12(a) shows p.d.f.s of
 $s$ for different
 $\phi _p$ and
 ${Wi}$. Since homogeneous shear flow is planar flow,
 $s=0$ when
 $\phi _p\to 0$. As
 $\phi _{p}$ and/or
 ${Wi}$ increase, the fraction of the planar flow indicated by
 $s=0$ decreases, and the fraction of triaxial flow indicated by
 $s\neq 0$ increases. This trend is also captured by the mean and standard deviation of
 $s$ (the inset in figure 12a).
P.d.f. of (a) strain-rate state  $s$ and (b) irrotationality
 $E$ in the fluid region at various values of
 $\phi _p$ (0.1 (red), 0.05 (orange), 0.025 (green) and 0.001 (blue)). For each
 $\phi _p$,
 ${Wi}=0.1$ (dotted lines) and 2.0 (solid lines). The inset shows the
 $\phi _p$ dependence of the mean (red circles) and standard deviation (blue squares). The open and solid symbols in the inset indicate the results of
 ${Wi}=0.1$ and
 $2.0$, respectively.

The relative contribution of vorticity to the strain rate is characterized by irrotationality, which is defined as
 \begin{equation} E=\frac{\sqrt{\boldsymbol{\mathsf{D}}\boldsymbol{:}\boldsymbol{\mathsf{D}}}} {\sqrt{\boldsymbol{\mathsf{D}}\boldsymbol{:}\boldsymbol{\mathsf{D}}} +\sqrt{\boldsymbol{\varOmega}\boldsymbol{:}\boldsymbol{\varOmega}^\textrm{T}}}, \end{equation}
where  $\boldsymbol {\varOmega }= (\boldsymbol {\nabla }\boldsymbol {u}-\boldsymbol {\nabla }\boldsymbol {u}^\textrm {T})/2$ is the vorticity tensor. By definition,
 $E\in [0,1]$. For rigid-body rotation,
 $E=0$; and
 $E=1$ for irrotational flow. As the vorticity contribution decreases,
 $E$ increases. Figure 12(b) shows the p.d.f. of the irrotationality for different
 $\phi _p$ and
 ${Wi}$. In homogeneous simple shear flow at
 $\phi _{p}\to 0$, the flow is half rotational, i.e.
 $E=1/2$. As
 $\phi _p$ increases, the fraction of
 $E=1/2$ decreases, whereas the fraction of
 $E\neq 1/2$ increases. In particular, the fraction of
 $E>1/2$ is larger than that of
 $E<1/2$, indicating that the region with more irrotational flow than homogeneous shear flow increases with
 $\phi _p$. Since the vorticity contribution makes the fluid element avoid stretching, a large
 $E$ value suggests that the flow is strain-dominated to promote stretching of the conformation. As
 $Wi$ increases, the width of the
 $E$ p.d.f. gets narrower. The trend of the
 $E$ p.d.f. with
 $\phi _p$ and
 ${Wi}$ is summarized by the mean and standard deviation of
 $E$ (the inset in figure 12b). The insets in figure 12(a,b) indicate that the flow pattern as measured by
 $s$ and
 $E$ is mostly dominated by
 $\phi _p$. These changes in the p.d.f.s of
 $s$ and
 $E$ reflect the modulation of the flow caused by the particle inclusion, which is further examined in the following section.
To discuss the correlation between the strain-rate state and irrotationality and the spatial variation of the flow pattern, a joint p.d.f. of  $s$ and
 $E$ for different
 $\phi _p$ at
 ${Wi}=0.1$ and
 $2.0$ is shown in figure 13; snapshots of
 $s$ and
 $E$ on a shear plane at different
 $\phi _p$ and
 ${Wi}$ are presented in figures 14 and 15, respectively. The simple shear flow corresponds to
 $(s,E)=(0,1/2)$. At
 ${Wi}=0.1$ and
 $\phi _p=0.001$ and 0.025 (figures 13a and 13c, respectively), the
 $s$–
 $E$ distribution appears like the face of a fox; high-
 $E$ flow is actually non-planar high-
 $|s|$ flow, which forms the fox's ears. At
 ${Wi}=0.1$, the distribution of
 $s$ is almost symmetric for different
 $\phi _{p}$ (figure 13a,c,e,g), thus reflecting the fore–aft symmetry of the flow around a particle (
 $s$ and
 $E$ at
 $\phi _p=0.025$ in figure 14). For irrotational flow of
 $E>0.5$, the fraction of the planar flow of
 $s=0$ is relatively small, and hence the triaxial flow of
 $s\neq 0$ is predominant. This reflects the flow in the upstream and downstream regions of the particles (
 $s$ and
 $E$ at
 $\phi _p=0.025$ in figure 14), where the flow is forced to avoid the particles to generate irrotational bifurcating (biaxial elongational) flow upstream and irrotational converging (uniaxial elongational) flow downstream (Einarsson et al. Reference Einarsson, Yang and Shaqfeh2018; Yang & Shaqfeh Reference Yang and Shaqfeh2018a; Vázquez-Quesada et al. Reference Vázquez-Quesada, Espa nol, Tanner and Ellero2019; Matsuoka et al. Reference Matsuoka, Nakayama and Kajiwara2020). As
 ${Wi}$ increases, the distribution of
 $s$ at
 $E>1/2$ becomes asymmetric (figure 13b,d,f); the fraction of
 $s>0$ is larger than that of
 $s<0$. This corresponds to symmetry breaking in the upstream and downstream flows around the particles with an increase of
 ${Wi}$. As shown in the
 $E$ distribution at
 $\phi _{p}=0.025$ and
 ${Wi}=2.0$ (figure 15), high-
 $E$ regions around a particle shift anticlockwise with respect to the symmetric distribution at
 ${Wi}=0.5$. Because of this change, in the upstream region of the particle, the vorticity contribution increases with
 ${Wi}$, leading to a decrease in
 $E$, whereas
 $E$ in the downstream region does not change significantly. This change of flow patterns with
 ${Wi}$ is attributed to the local flow modulation by large polymer stress gradients around particles, which was examined in detail in our previous study for a single-particle system (Matsuoka et al. Reference Matsuoka, Nakayama and Kajiwara2020). Although
 ${Wi}$ affects the local flow pattern around a particle, the microstructure does not change obviously with
 $Wi$, as seen in figures 14 and 15.
The 2-D p.d.f.s of strain-rate state  $s$ and irrotationality
 $E$ in the fluid region: (a,b)
 $\phi _p=0.001$; (c,d)
 $\phi _p=0.025$; (e,f)
 $\phi _p=0.05$; and (g,h)
 $\phi _p=0.1$. The top and bottom rows indicate the results at
 ${Wi}=0.1$ and
 $2.0$, respectively. The contour lines correspond to
 $\textrm {p.d.f.}=10^k$ with
 $k=-4,-3,-2,-1,0,1,2$.

Spatial distribution of the flow pattern characterized by: (a,b) strain-rate state  $s$; (c,d) irrotationality
 $E$; (e,f) normalized polymer stretch of the first mode
 $(\text {tr}\,\boldsymbol{\mathsf{C}}^{(1)}-3)/(2{Wi}^2)$; and (g,h) normalized shear stress of the first mode
 $\sigma _{p,xy}^{(1)}/(\eta _{p}^{(1)}\dot {\gamma })$ on a shear plane (
 $x,y$ plane) at
 ${Wi}=0.5$. The top (a,c,e,g) and bottom (b,d,f,h) rows are the results at
 $\phi _p=0.025$ and
 $0.1$, respectively.

Spatial distribution of the flow pattern characterized by: (a,b) strain-rate state  $s$; (c,d) irrotationality
 $E$; (e,f) normalized polymer stretch of the first mode
 $(\text {tr}\,\boldsymbol{\mathsf{C}}^{(1)}-3)/(2{Wi}^2)$; and (g,h) normalized shear stress of the first mode
 $\sigma _{p,xy}^{(1)}/(\eta _{p}^{(1)}\dot {\gamma })$ on a shear plane (
 $x,y$ plane) at
 ${Wi}=2.0$. The top (a,c,e,g) and bottom (b,d,f,h) rows are the results at
 $\phi _p=0.025$ and
 $0.1$, respectively.

In this study, our DNS of many-particle systems enables us to examine the effect of the particle volume fraction on the local flow patterns. As  $\phi _p$ increases, the
 $s$–
 $E$ p.d.f. spreads out widely (from left to right panels in figure 13). In addition to the increase in the fraction of the characteristic flow field around single particles, this
 $s$–
 $E$ distribution also reflects the spatial overlap of the characteristic flow field between particles, which is shown in figures 14 and 15. Especially, the high-
 $E$ fox ears in the
 $s$–
 $E$ p.d.f. are smeared out with increased
 $\phi _p$ because the interaction between particles becomes predominant to modify the flow between particles. Figure 16 shows the colour contour of the strain-rate state at the highly irrotational region of
 $E\geqslant 0.65$ at
 ${Wi}=2.0$. At the dilute condition of
 $\phi _p=0.025$, the highly irrotational region adjacent to each particle is isolated over most of the time (figure 16b). In contrast, as
 $\phi _p$ increases, additional bifurcating irrotational regions develop between particles when two particles get closer (figure 16c,d).
The isovolume visualization of a highly irrotational region at  ${Wi}=2.0$: (a)
 $\phi _p=0.001$, (b)
 $0.025$, (c)
 $0.05$ and (d)
 $0.1$. The isovolume represents a region where
 $E\geqslant 0.65$, and the colour represents the strain-rate state
 $s$.

Finally, the development of polymer stretch and polymer shear stress at different  $\phi _p$ and
 ${Wi}$ is discussed with a focus on the longest relaxation mode (
 $k=1$) responsible for shear thickening. The snapshots of the normalized polymer stretch
 $(\textrm {tr}\,\boldsymbol{\mathsf{C}}^{(1)}-3)/(2{Wi}^2)$ and the normalized polymer shear stress
 $\sigma _{p,xy}^{(1)}/\eta _{p}^{(1)}\dot {\gamma }=C_{xy}^{(1)}/{Wi}$ at
 $\phi _p=0.025$ and
 $0.1$ are shown in figure 14 for
 ${Wi}=0.5$ and in figure 15 for
 ${Wi}=2.0$. The polymer shear stress distribution is similar to that of the normalized stretch.
At  ${Wi}=0.5$ (figure 14), polymer stretch is promoted in the irrotational flow at the fore and aft of a particle. This results in two high-stretch regions; one is the recirculation region adjacent to the particle, and the other is downstream of the particle. In the recirculation flow around a particle, the polymer is subjected to repeated stretch and reorientation, thus resulting in a high-stretch region around the particle (Yang & Shaqfeh Reference Yang and Shaqfeh2018a; Matsuoka et al. Reference Matsuoka, Nakayama and Kajiwara2020). On the other hand, outside the recirculation flow, the polymer that has passed through the irrotational region around a particle is advected downstream to form another high-stretch region slightly diagonal to the flow direction.
In a dilute condition of  $\phi _p=0.025$, the high-stretch regions associated with different particles rarely interact with each other. As
 $\phi _p$ increases, a downstream high-stretch region shared by two particles is observed that occurs after the two particles pass each other. In the case of
 ${Wi}=0.5$ in figure 14, the downstream high-stretch region relaxes and does not reach far; hence the structure of the elastic stress at
 $\phi _p=0.1$ is similar to that in dilute cases. This is consistent with what was observed in figure 9(b); the relationship between the particle-induced fluid stress
 $\langle \varSigma _{xy}\rangle$ and
 $\widetilde {{Wi}}$ does not depend on
 $\phi _p$ when
 $\widetilde {{Wi}}\lesssim 1.5$.
On the other hand, at  ${Wi}=2.0$ (figure 15), the downstream high-stretch region between particles does not relax immediately and extends over a long distance. Figure 17 shows a 3-D view of the high-stretch region at different
 $\phi _p$ and
 ${Wi}=2.0$, where the isovolume of
 $\textrm {tr}\,\boldsymbol{\mathsf{C}}^{(1)}$ that is more than twice the stretch in an Oldroyd-B fluid under homogeneous shear flow is visualized. As
 $\phi _p$ increases, the streak-shaped high-stretch regions bridging two separated particles become more evident. At
 $\phi _p=0.1$, most particles share high-stretch regions with other particles. This result suggests that the development of elastic stress at
 $\phi _p=0.1$ and
 ${Wi}\gtrsim 2$ is qualitatively different from that in dilute cases. However, despite this distinctive microscopic picture observed in the polymer stretching, the effect of such polymer stretching structures on the averaged bulk polymer stress is still not significant in the scope of the present study, as seen in figures 9 and 10. The polymer stretching structure between many particles identified in figure 17 would cause a qualitative change in the suspension rheology at higher
 $\phi _p$ and/or
 ${Wi}$ where such structures would become more frequent and persistent.
Polymer high-stretch region at  ${Wi}=2.0$: (a)
 $\phi _p=0.025$, (b)
 $0.05$ and (c)
 $0.1$. The isovolume of
 $\textrm {tr}\,\boldsymbol{\mathsf{C}}^{(1)}\geqslant 2(2\widetilde {{Wi}}^2+3)$ is visualized in green, where the threshold is twice the value of
 $\text {tr}\,\boldsymbol{\mathsf{C}}$ in the Oldroyd-B fluid under homogeneous shear flow.

4. Conclusions
To elucidate the key factor for the quantitative prediction of the shear thickening in suspensions in Boger fluids, DNS of many-particle suspensions in a multi-mode Oldroyd-B fluid is performed using SPM. To evaluate the suspension rheology in bulk systems, rather than applying a wall-driven confined system, simple shear flow is imposed by Lees–Edwards periodic boundary conditions for the particle dynamics; a time-dependent moving frame that evolves with the mean shear flow is applied to create simple shear flow for the fluid dynamics. Our DNS is validated by analysing the viscoelastic flow in a single-particle suspension in an Oldroyd-B fluid under simple shear. Good agreement is obtained with analytical solutions as well as with numerical results for the shear thickening in the suspension viscosity as well as in the viscosity from the particle-induced fluid stress, and the shear thinning in the viscosity from the stresslet.
The shear rheology of many-particle systems is investigated from dilute to semidilute conditions up to  $\phi _p\leqslant 0.1$ and
 ${Wi}\leqslant 2.5$. Based on previous experimental work on a suspension in a Boger fluid (Yang & Shaqfeh Reference Yang and Shaqfeh2018b), a four-mode Oldroyd-B fluid is used as a matrix to mimic the linear modulus of the Boger fluid. The presented many-particle, multi-mode results for the shear-thickening behaviour of a suspension quantitatively agree with the experimental results. Furthermore, for
 ${Wi}\leqslant 2.5$, an effective set of parameters is derived for single-mode Oldroyd-B modelling for the matrix by considering a relevant mode in the four-mode modelling. The many-particle results with this effective single-mode model also reproduce the experimentally observed shear-thickening behaviour in a suspension; this is in contrast to the underestimation obtained by another DNS study that used a different set of the fluid parameters (Yang & Shaqfeh Reference Yang and Shaqfeh2018b). The presented results elucidate that, with an accurate estimation of
 $N_1$ of the matrix in the shear-rate range where the shear thickening starts to occur, shear thickening in a suspension in a Boger fluid at around
 ${Wi}=1$ can be predicted with a relevant mode Oldroyd-B model. This finding in our study prompts us to consider shear thickening of suspensions in more complex viscoelastic media showing strong nonlinearity in viscosity and
 $N_1$. In such cases, a proper estimation of nonlinear matrix
 $N_1$ as well as viscosity should be required to predict suspension rheology. Understanding the effects of matrix nonlinearity on suspension rheology is our future work.
At a dilute suspension, the single-particle and many-particle systems are compared, clarifying that the single-particle simulation underestimates the stresslet contribution due to the lack of relative motion between particles, which is another factor affecting the quantitative prediction of the suspension rheology. The underestimation of the suspension viscosity in a single-particle calculation was pointed out in a previous work with a wall-driven system (Vázquez-Quesada et al. Reference Vázquez-Quesada, Espa nol, Tanner and Ellero2019). We revealed that the cause of the quantitative discrepancy comes from the stresslet contribution by the suspension microstructure. The suspension stress decomposition into the stresslet and the particle-induced fluid stress demonstrated the scaling of the polymer contribution to the total shear thickening as was reported in a previous DNS result up to  $\phi _p\leqslant 0.1$ and
 ${Wi}\leqslant 1.0$ (Yang & Shaqfeh Reference Yang and Shaqfeh2018b). The underlying similarity of the elastic contribution at different
 $\phi _p\leqslant 0.1$ was directly confirmed by the scaling relation of the normalized polymer dissipation function with respect to the suspension shear stress. Lastly, the flow pattern and the elastic stress development are examined for different values of
 $\phi _p$ and
 ${Wi}$. In dilute cases, shear thickening is attributed to the elastic stress near each particle. As
 $\phi _p$ and/or
 ${Wi}$ increase, the relative motion of the particles affects the local flow pattern and polymer stretch around the particles. At
 ${Wi}\gtrsim 2$ in the semidilute case, the elastic stress between the passing particles does not fully relax to form an additional streak-shaped region of high elastic stress. Although the impact of such polymer stretching structures on the bulk suspension rheology is likely to be small within the scope of this study, further study for the microstructures and corresponding polymer stretching structures at higher
 $\phi _p$ and
 ${Wi}$ will be necessary.
Acknowledgements
The numerical calculations were mainly carried out using the computer facilities at the Research Institute for Information Technology at Kyushu University.
Funding
This work was supported by Grants-in-Aid for Scientific Research (JSPS KAKENHI) under Grant No. JP18K03563.
Declaration of interests
The authors report no conflict of interest.
Appendix A. Tensorial representation of equations in an oblique coordinate system
A.1. Oblique coordinate system
To impose simple shear flow on the system, a time-dependent oblique coordinate  $\hat {\boldsymbol {r}}$ evolving with mean shear velocity
 $\boldsymbol {U}=\dot {\gamma }r^2\boldsymbol {e}_1$ is introduced as
 \begin{gather} \hat{r}^1=r^1-\dot{\gamma}tr^2, \end{gather}
 \begin{gather}\hat{r}^2=r^2, \end{gather}
 \begin{gather}\hat{r}^3=r^3, \end{gather}
 \begin{gather}\hat{t}=t, \end{gather}
where the quantities with a caret  $(\,\hat {\cdot }\,)$ represent variables observed in the oblique coordinate system, and the upper indices 1, 2 and 3 represent the shear flow, velocity gradient and vorticity direction, respectively. By introducing an oblique coordinate system, advection by the mean flow, whose term explicitly depends on
 $r^2$, i.e.
 $(\boldsymbol {U}\boldsymbol {\cdot }\boldsymbol {\nabla })= \dot {\gamma }r^2\partial /\partial r^1$, is eliminated from the shear-enforced hydrodynamic equations. This enables the use of the periodic boundary conditions (Rogallo Reference Rogallo1981; Kobayashi & Yamamoto Reference Kobayashi and Yamamoto2011; Molina et al. Reference Molina, Otomura, Shiba, Kobayashi, Sano and Yamamoto2016). From the coordinate transformation, the covariant and contravariant transformation matrices
 $[\boldsymbol {\varLambda }]_{\nu \mu }=\varLambda ^{\nu }{}_{\mu }=\partial r^{\nu }/\partial \hat {r}^{\mu }$ and
 $[\boldsymbol {\varLambda }']_{\mu \nu }=\varLambda '^{\mu }{}_{\nu }=\partial \hat {r}^{\mu }/\partial r^{\nu }$ are derived as
 \begin{equation} \boldsymbol{\varLambda}= \left( \begin{array}{@{}ccc@{}} 1 & \gamma(t) & 0 \\ 0 & 1 & 0 \\ 0 & 0 & 1 \end{array} \right), \quad \boldsymbol{\varLambda}'= \left(\begin{array}{@{}ccc@{}} 1 & -\gamma(t) & 0 \\ 0 & 1 & 0 \\ 0 & 0 & 1 \end{array} \right), \end{equation}
respectively, where  $\boldsymbol {\varLambda }\boldsymbol {\cdot }\boldsymbol {\varLambda '}= \boldsymbol {\varLambda }'\boldsymbol {\cdot }\boldsymbol {\varLambda }=\boldsymbol{\mathsf{I}}$ by definition. Einstein's summation rule is applied hereafter.
By using transformation matrices, the covariant and contravariant basis vectors  $\hat {\boldsymbol {E}}_{\mu }$ and
 $\hat {\boldsymbol {E}}^{\mu }$, respectively, and the corresponding components of the position vectors
 $\boldsymbol {r}=r_{\mu }\boldsymbol {e}^{\mu }=r^{\mu }\boldsymbol {e}_{\mu }=\hat {r}^{\mu } \hat {\boldsymbol {E}}_{\mu }=\hat {r}_{\mu }\hat {\boldsymbol {E}}^{\mu }$, are represented as
 \begin{gather} \hat{\boldsymbol{E}}_{\mu}=\varLambda{^{\nu}}{}_{\mu}\,\boldsymbol{e}_{\nu},\quad \hat{\boldsymbol{E}}^{\mu}=\varLambda{^{\mu}}{}_{\nu}\,\boldsymbol{e}^{\nu}, \end{gather}
 \begin{gather}\hat{r}_{\mu}=\varLambda{^{\nu}}{}_{\mu}\,r_{\nu},\quad \hat{r}^{\mu}=\varLambda{^{\mu}}{}_{\nu}\,r^{\nu}. \end{gather}
Since the oblique coordinate system is not an orthogonal system, covariant and contravariant bases are used, where  $\hat {\boldsymbol {E}}_{\mu }\boldsymbol {\cdot }\hat {\boldsymbol {E}}^{\nu } =\delta _{\mu }{}^{\nu }$ holds. The lower and upper indices (
 $\mu ,\nu =1, 2, 3$) of the tensor variables represent the covariant and contravariant components of the tensor, respectively.
Figure 18 shows a schematic diagram of this transformation; a 2-D diagram on the shear plane is used for the sake of explanation. At  $t=0$, the basis vectors of the oblique coordinates
 $\hat {\boldsymbol {E}}_1$ and
 $\hat {\boldsymbol {E}}_2$ coincide with those of the static Cartesian coordinates
 $\boldsymbol {e}_1$ and
 $\boldsymbol {e}_2$. At
 $t>0$, the second basis vector of the oblique coordinate changes with time. The contravariant metric tensor for the oblique coordinate is defined as
 \begin{equation} G^{\mu\nu}\equiv\hat{\boldsymbol{E}}^{\mu}\boldsymbol{\cdot}\hat{\boldsymbol{E}}^{\nu} = \left( \begin{array}{@{}ccc@{}} 1+\gamma^2(t) & -\gamma(t) & 0 \\ -\gamma(t) & 1 & 0 \\ 0 & 0 & 1 \end{array} \right). \end{equation}
Note that, in the static Cartesian coordinate system, there is no distinction between the covariant and contravariant expressions, i.e.  $r_{\mu }=r^{\mu }$ and
 $\boldsymbol {e}_{\mu }=\boldsymbol {e}^{\mu }$, and the metric tensor is identical to the unit tensor, i.e.
 $\boldsymbol{\mathsf{G}}=\boldsymbol{\mathsf{I}}$. In the oblique system in figure 18, where the coordinates are non-orthogonal but linear and spatially homogeneous, the metric tensor is time-varying and spatially constant. In this situation, the Christoffel term in the covariant differentiation is zero, and the covariant differentiation is represented by usual partial differentiation:
 $\hat {\boldsymbol {\nabla }}_{\mu }=\partial /\partial \hat {r}^{\mu }$.
Schematic diagram of the oblique coordinate system. Here  $\hat {\boldsymbol {E}}_1$ and
 $\hat {\boldsymbol {E}}_2$ and
 $\boldsymbol {e}_1$ and
 $\boldsymbol {e}_2$ are the basis vectors in the oblique system and those in the static Cartesian system, respectively; and
 $r^1$ and
 $r^2$ are the components of the position vector in the Cartesian system. The Cartesian system and the initial oblique system coincide (blue square). At
 $t>0$, the oblique system is sheared (pink parallelogram) by the strain of
 $\dot {\gamma }t$, where
 $\dot {\gamma }$ is the applied shear rate. The region of the oblique system outside the initial square (right triangle) can be periodically transformed back into the square (left triangle).

The periodicity in the governing equations can also be achieved by only the coordinate transformation (A1)–(A4) with the orthogonal basis system (Rogallo Reference Rogallo1981; Onuki Reference Onuki1997) without using the oblique dual-basis system. This single-basis formalism has the advantage that the tensorial representation for an equation is expressed uniquely but has the disadvantage that a spatial differential operator includes the cross oblique term explicitly. In contrast, the dual-basis formalism adopted in our method has the advantage that the forms of differential operators and governing equations in the oblique coordinate system are almost the same as that in the orthogonal system, as explained in § 2, although these forms have dual (covariant and contravariant) expressions. This simple expression of the governing equations in the coordinate system is preferable for a convenient implementation of the practical simulation code.
A.2. Governing equations in the oblique coordinate system
The tensorial component representation of the fluid momentum equation on the general coordinate system (Luo & Bewley Reference Luo and Bewley2004; Venturi Reference Venturi2009; Molina et al. Reference Molina, Otomura, Shiba, Kobayashi, Sano and Yamamoto2016) is
 \begin{equation} \frac{\delta\hat{u}^{\mu}}{\delta \hat{t}}=\rho^{{-}1}\hat{\boldsymbol{\nabla}}_\nu\hat{\sigma}^{\nu\mu}+\hat{\phi}\hat{f}_p^{\mu}. \end{equation}
The left-hand side of (A9) is the intrinsic time derivative in the general coordinate system,
 \begin{equation} \frac{\delta \hat{A}^{\mu}}{\delta \hat{t}}\equiv\frac{\partial \hat{A}^{\mu}}{\partial \hat{t}} +(\hat{u}^{\nu}-\hat{U}^{\nu})\hat{\boldsymbol{\nabla}}_{\nu}\hat{A}^{\mu} +\hat{A}^{\nu}\hat{\boldsymbol{\nabla}}_{\nu}\hat{U}^{\mu}, \end{equation}
where  $\hat {U}^{\mu }\equiv -\partial \hat {r}^{\mu }/\partial t$ is the moving velocity of the coordinate, and for simple shear flow
 $\boldsymbol {U}=\dot {\gamma }(t)r^2\boldsymbol {e}_1= \dot {\gamma }(t)\hat {r}^2\hat {\boldsymbol {E}}_1$. Since
 $\hat {A}^{\mu }$ is defined in the moving system, the advection in the second term in (A10) is by the relative velocity to the coordinate flow. The last term in (A10) arises from the affine deformation caused by the coordinate flow. Introducing the relative fluid velocity to the coordinate flow
 $\boldsymbol {\xi }=\boldsymbol {u}-\boldsymbol {U}$, (A9) becomes
 \begin{equation} (\hat{\partial}_{\hat{t}}+\hat{\xi}^{\nu}\hat{\boldsymbol{\nabla}}_{\nu}) \hat{\xi}^{\mu}=\rho^{{-}1}\hat{\boldsymbol{\nabla}}_{\nu}\hat{\sigma}^{\nu\mu}+ \hat{\phi}\hat{f}_p^{\mu}-2\dot{\gamma}(t)\hat{\xi}^2\delta^{\mu,1}, \end{equation}
with the incompressibility condition  $\hat {\boldsymbol {\nabla }}_{\mu }\hat {\xi }^{\mu }=0$, where
 $\hat {\partial }_{\hat {t}}\equiv \partial /\partial \hat {t}|_{\hat {r}^{\mu }}=\partial /\partial t|_{r^{\mu }}+\dot {\gamma }(t)r^2\partial /\partial r^1$. The last term in (A11) arises from the spatial gradient of the coordinate flow. Since this equation does not explicitly depend on the coordinate components
 $\hat {r}^{\mu }$, periodic boundary conditions can be assigned to (A11), and hence (A11) can be solved by a spectral method (Rogallo Reference Rogallo1981; Canuto et al. Reference Canuto, Hussaini, Quarteroni and Zang1988). The stress tensor gradient in a Newtonian fluid is obtained as
 \begin{equation} \hat{\boldsymbol{\nabla}}_{\nu}\hat{\sigma}_n^{\nu\mu}={-}G^{\nu\mu} \hat{\boldsymbol{\nabla}}_{\nu}\hat{p}+\eta_sG^{\nu\gamma} \hat{\boldsymbol{\nabla}}_{\nu}\hat{\boldsymbol{\nabla}}_{\gamma}\hat{\xi}^{\mu}. \end{equation}
In a viscoelastic fluid, the polymer stress gradient term  $\hat {\boldsymbol {\nabla }}_{\nu }\hat {\sigma }_p^{\nu \mu }$ is considered in addition to (A12). In our method, the tensorial expression for the constitutive equation of the polymer stress is additionally introduced in a manner consistent with the previous Newtonian formulation (Molina et al. Reference Molina, Otomura, Shiba, Kobayashi, Sano and Yamamoto2016).
The intrinsic time derivative for conformation tensor  $\boldsymbol{\mathsf{C}}= \hat {C}^{\mu \nu }\hat {\boldsymbol {E}}_{\mu }\hat {\boldsymbol {E}}_{\nu }$, which is represented by its second-rank contravariant tensor, is expressed as (Venturi Reference Venturi2009)
 \begin{equation} \frac{\delta \hat{C}^{\mu\nu}}{\delta \hat{t}}\equiv\frac{\partial \hat{C}^{\mu\nu}}{\partial\hat{t}} +(\hat{u}^{\gamma}-\hat{U}^{\gamma})\hat{\boldsymbol{\nabla}}_{\gamma}\hat{C}^{\mu\nu} +\hat{C}^{\mu\gamma}\hat{\boldsymbol{\nabla}}_{\gamma}\hat{U}^{\nu} +\hat{C}^{\gamma\nu}\hat{\boldsymbol{\nabla}}_{\gamma}\hat{U}^{\mu}, \end{equation}
and the upper-convected time derivative is expressed by
 \begin{equation} \frac{\textrm{d}_c\hat{C}^{\mu\nu}}{\textrm{d}\hat{t}}\equiv\frac{\delta \hat{C}^{\mu\nu}}{\delta\hat{t}}-\hat{C}^{\gamma\nu}\hat{\boldsymbol{\nabla}}_{\gamma} \hat{u}^{\mu}-\hat{C}^{\mu\gamma}\hat{\boldsymbol{\nabla}}_{\gamma}\hat{u}^{\nu}. \end{equation}
Substituting (A13) into (A14), one obtains
 \begin{equation} \frac{\textrm{d}_c\hat{C}^{\mu\nu}}{\textrm{d}\hat{t}}=\frac{\partial \hat{C}^{\mu\nu}}{\partial\hat{t}} +\hat{\xi}^{\gamma}\hat{\boldsymbol{\nabla}}_{\gamma}\hat{C}^{\mu\nu} -\hat{C}^{\mu\gamma}\hat{\boldsymbol{\nabla}}_{\gamma} \hat{\xi}^{\nu}-\hat{C}^{\gamma\nu}\hat{\boldsymbol{\nabla}}_{\gamma}\hat{\xi}^{\mu}. \end{equation}
By using (A15), the single-mode Oldroyd-B constitutive equation in the general coordinate system is represented as
 \begin{gather} \frac{\partial \hat{C}^{\mu\nu}}{\partial\hat{t}} +\hat{\xi}^{\gamma}\hat{\boldsymbol{\nabla}}_{\gamma}\hat{C}^{\mu\nu} =\hat{C}^{\mu\gamma} \hat{\boldsymbol{\nabla}}_{\gamma}\hat{\xi}^{\nu} +\hat{C}^{\gamma\nu}\hat{\boldsymbol{\nabla}}_{\gamma} \hat{\xi}^{\mu}-\frac{1}{\lambda} (\hat{C}^{\mu\nu}-G^{\mu\nu} ), \end{gather}
 \begin{gather}\hat{\sigma}_p^{\mu\nu}=\frac{\eta_p}{\lambda} (\hat{C}^{\mu\nu}-G^{\mu\nu} ). \end{gather}
Here, again, (A16) is independent of the coordinate components and has the same form as that in the orthogonal coordinate system. Therefore, periodic boundary conditions can be assigned to (A16).
Appendix B. Numerical implementation
B.1. Time-stepping algorithm for the coupling between fluid and particles
A flow chart showing the calculation procedure for one time step is shown in figure 19. The couplings between the flow and conformation and between the fluid and particles are established in the following explicit fractional step approach. Throughout the evolution process, field variables are converted from real space to wavenumber space and vice versa as necessary. In this section, continuum variables in the Fourier space are denoted by the subscript  $\boldsymbol {k}$, where
 $\boldsymbol {k}$ represents the wavenumber vector. The discretized
 $n$th time step is indicated by the superscript of a variable as
 $(\cdot )^{n}$. Here, the constitutive equation is a single-mode Oldroyd-B model to ease explanation, and the extension to the multi-mode constitutive equations is straightforward. The calculation proceeds according to the following procedure.
(i) Initialization of variables (M-1). Starting with the coordinate strain
 $\gamma =0$, the field variables are initialized as $\boldsymbol {u}=\boldsymbol {\xi }=\boldsymbol {0}$ and $\boldsymbol{\mathsf{C}}=\boldsymbol{\mathsf{I}}$ at $t=0$ over the entire domain. Correspondingly, the translational and angular velocities of the particles are set to zero. For a many-particle system, the positions of the particles are randomly generated to keep the distance between particle surfaces at least $2\varDelta$, where $\varDelta$ is the grid size.
Figure 19.
Flow chart of the main calculation procedure over one time step.
(ii) Update of the conformation tensor field (C-1). The conformation tensor
$\hat {\boldsymbol{\mathsf{C}}}$ is updated to the next time step by integrating (A16) or (B31) over time to obtain the polymer stress field. As mentioned in § 2.2, the small error of $\hat {\boldsymbol{\mathsf{C}}}$ accumulates in the inner particle region according to the time evolution. This error can be eliminated by resetting $\hat {\boldsymbol{\mathsf{C}}}=\boldsymbol{\mathsf{G}}$ over the $\hat {\phi }=1$ region if necessary. In this study, this reset operation is safely omitted because the error is sufficiently small.(iii) Update of the intermediate velocity field (V-1). Equation (A11) without the
$\hat {\phi }\hat {\boldsymbol {f}}_p$ term is time-integrated to obtain an intermediate velocity field $\hat {\boldsymbol {\xi }}^*$. In this step, the fluid stress, i.e. the solvent and polymer stresses, are considered, and the solid–fluid coupling is not considered.(iv) Update of the shear strain (M-2). After the field calculations, the shear strain is updated:
$\gamma ^{n+1}=\gamma ^n+\dot {\gamma }\Delta t$, where $\Delta t$ is the time increment. This corresponds to the deformation of the oblique coordinate system. In this step, if the apparent shear strain equals the threshold value $\gamma _{{th}}$, the remeshing process is conducted. In this study, $\gamma _{{th}}=1$.(v) Remeshing (M-3). Practically, as time evolves, the oblique mesh is gradually distorted, which can lead to a decrease in accuracy. To continue the simulation as the strain increases infinitely while maintaining accuracy, the strained oblique coordinates should be reset to a less strained state or to the static Cartesian coordinates at some finite shear strain (Rogallo Reference Rogallo1981). In this study, the oblique coordinate system is reset to the orthogonal Cartesian coordinate system when
$\gamma$ reaches $\gamma _{{th}}=1$. First, the shear strain of the oblique system is reset as $\gamma \leftarrow \gamma -\gamma _{{th}}$. Then, the field variables $\hat {\boldsymbol {\xi }}^*$ and $\hat {\boldsymbol{\mathsf{C}}}$ on the oblique grid outside of the initial orthogonal grid are remapped through the periodic boundary in the flow direction. Simultaneously, the components of the variables in the oblique coordinate system are transformed to those in the reset coordinate system by the transformation matrix. Correspondingly, the metric tensor (A8) and the norm of the wavenumber vector in the spectral scheme, $\hat {\boldsymbol {k}}\boldsymbol {\cdot }\hat {\boldsymbol {k}}$, are updated. The norm of wavenumber vector in the wavenumber space corresponds to the Laplacian operator in real space, i.e. $G^{\mu \nu }\hat {\boldsymbol {\nabla }}_{\mu }\hat {\boldsymbol {\nabla }}_{\nu }\ \Longleftrightarrow \ -G^{\mu \nu }\hat {k}_{\mu }\hat {k}_{\nu }= -\hat {\boldsymbol {k}}\boldsymbol {\cdot }\hat {\boldsymbol {k}}$, and then
(B1)where\begin{equation} \hat{\boldsymbol{k}}\boldsymbol{\cdot}\hat{\boldsymbol{k}} =\hat{k}_1^2+(\hat{k}_2-\gamma\hat{k}_1)^2+\hat{k}_3^2, \end{equation}$\hat {k}_i$ is the $i$th component of the covariant wavenumber vector in the oblique coordinate system.(vi) Interpolation and transformation of the intermediate velocity field (M-4). To simplify the reconstruction of the
$\phi$ field based on particle positions, the coupling between the fluid and particle is treated on the usual static orthogonal coordinate system. The grid points in the oblique coordinate system do not always coincide with those in the static orthogonal coordinate system. Therefore, the intermediate velocity field $\hat {\boldsymbol {\xi }}^*$ on the oblique grids should be interpolated to the static orthogonal grids. This is done by using a periodic cubic spline interpolation (Molina et al. Reference Molina, Otomura, Shiba, Kobayashi, Sano and Yamamoto2016). After the interpolation, the oblique-basis components of $\hat {\boldsymbol {\xi }}^*$ are transformed to those in Cartesian basis. In this step, the absolute velocity field $\boldsymbol {u}^*$ is constructed using the transformed $\boldsymbol {\xi }^*$ and the base flow $\dot {\gamma }r^2\boldsymbol {e}_1$:
(B2)\begin{equation} \boldsymbol{u}^*=(\dot{\gamma}r^2\delta^{\mu,1} +\varLambda^{\mu}_{\ \nu}\hat{\xi}^{\nu*})\boldsymbol{e}_{\mu}. \end{equation}(vii) Update of the particle position (P-1). Hereafter, the calculation is conducted in the orthogonal coordinate system (blue block in figure 19). Using the particle velocity at the previous time step
$\boldsymbol {V}^n$, the position of the $i$th particle is updated:
(B3)In this step, if the updated particle position crosses the top and bottom boundaries, the position and velocity of the particle are modified according to the Lees–Edwards boundary conditions (Lees & Edwards Reference Lees and Edwards1972; Kobayashi & Yamamoto Reference Kobayashi and Yamamoto2011; Molina et al. Reference Molina, Otomura, Shiba, Kobayashi, Sano and Yamamoto2016). In this time, the\begin{equation} \boldsymbol{R}_i^{n+1}=\boldsymbol{R}_i^n +\int_{t^n}^{t^{n+1}}\boldsymbol{V}_i^n\,\textrm{d}t. \end{equation}$\phi$ field is also updated by using the new particle positions consistent with Lees–Edwards boundary conditions. Then, the intermediate particle velocity field $\boldsymbol {u}_p^*$ is calculated:
(B4)where\begin{equation} \phi^{n+1}\boldsymbol{u}_p^*=\sum_i\phi_i^{n+1}[\boldsymbol{V}_i^n +\boldsymbol{\varOmega}_i^n\times\boldsymbol{r}_i^{n+1}], \end{equation}$\boldsymbol {r}_i=\boldsymbol {r}-\boldsymbol {R_i}$. This corresponds to the mapping of the Lagrangian particle velocity on the Euler velocity field.(viii) Calculation of hydrodynamic forces acting on particles (M-5). The hydrodynamic force and torque exerted on the particles
$\boldsymbol {F}^H$ and $\boldsymbol {N}^H$ are calculated by the change in momentum in the particle domain:
(B5)\begin{gather} \int_{t^n}^{t^{n+1}}\boldsymbol{F}_i^H\,\textrm{d}t= \int\rho\phi_i^{n+1}(\boldsymbol{u}^*-\boldsymbol{u}_p^*)\,\textrm{d}\boldsymbol{r}, \end{gather}(B6)\begin{gather}\int_{t^n}^{t^{n+1}}\boldsymbol{N}_i^H\,\textrm{d}t= \int\boldsymbol{r}_i^{n+1}\times\rho\phi_i^{n+1} (\boldsymbol{u}^*-\boldsymbol{u}_p^*)\,\textrm{d}\boldsymbol{r}. \end{gather}(ix) Update of the particle velocity and angular velocity (P-2). Using (B5) and (B6), the particle velocities are updated as
(B7)\begin{gather} \boldsymbol{V}_i^{n+1}=\boldsymbol{V}_i^n+\frac{1}{M_i}\int_{t^n}^{t^{n+1}} [\boldsymbol{F}_i^H+\boldsymbol{F}_i^C ]\,\textrm{d}t, \end{gather}(B8)In this study, for the inter-particle force\begin{gather}\boldsymbol{\varOmega}_i^{n+1}=\boldsymbol{\varOmega}_i^n+ \boldsymbol{\mathsf{I}}_{p,i}^{{-}1} \boldsymbol{\cdot}\int_{t^n}^{t^{n+1}}\boldsymbol{N}_i^H\,\textrm{d}t. \end{gather}$\boldsymbol {F}^C$, the soft-core (truncated Lennard-Jones) potential, which produces the short-range repulsive force, is adopted:
(B9)\begin{gather} \boldsymbol{F}^C_i(\boldsymbol{R})={-}\sum_{j\neq i}^N F_{{soft}}(r_{ij})\frac{\boldsymbol{r}_{ij}}{|\boldsymbol{r}_{ij}|}, \end{gather}(B10)\begin{gather}F_{{soft}}(r_{ij})={-}\left(\frac{\partial U_{{soft}}}{\partial r}\right)_{r=r_{ij}}, \end{gather}(B11)where\begin{gather}U_{{soft}}(r)=\begin{cases} 4\epsilon\left[\left(\dfrac{2a}{r}\right)^{36}-\left(\dfrac{2a}{r}\right)^{18}\right] +\epsilon & (r < r_c), \\ 0 & (r\geqslant r_c), \end{cases} \end{gather}$\boldsymbol {r}_{ij}=\boldsymbol {R}_j-\boldsymbol {R}_i$ is the distance vector from the $i$th particle to the $j$th particle and $r_c=2^{1/18}(2a)$. Vector $\boldsymbol {r}_{ij}$ is modified according to periodic boundary conditions if necessary. This potential force is simply applied to avoid particle overlap. The force parameter $\epsilon$, which tunes the interaction strength, is set at $\epsilon /(\eta _0\dot {\gamma }a^3)=0.561$ in all many-particle calculations in this study. Under denser particle concentration conditions, where the particle collisions and/or friction and its contribution to the total stress can become significant, more realistic modelling of inter-particle force may be required.(x) Calculation of the coupling term for fluid (M-6). Now that both the positions and velocities of particles have been updated, the final particle velocity field
$\boldsymbol {u}_p$ is obtained as
(B12)Then, the body force\begin{equation} \phi^{n+1}\boldsymbol{u}_p^{n+1}=\sum_i\phi_i^{n+1} [\boldsymbol{V}_i^{n+1}+\boldsymbol{\varOmega}_i^{n+1}\times\boldsymbol{r}_i^{n+1} ]. \end{equation}$\phi \boldsymbol {f}_p$ is calculated as
(B13)To calculate the stresslet (2.19), (B13) is further transformed as\begin{equation} \int_{t^n}^{t^{n+1}}\phi\boldsymbol{f}_p(\boldsymbol{x},t)\,\textrm{d}t= \phi^{n+1}(\boldsymbol{u}_p^{n+1}-\boldsymbol{u}^*). \end{equation}(B14)The first term on the right-hand side is expressed by the changes in particle velocity\begin{equation} \int_{t^n}^{t^{n+1}}\phi\boldsymbol{f}_p\,\textrm{d}t= \phi^{n+1}(\boldsymbol{u}_p^{n+1}-\boldsymbol{u}^*_p) -\phi^{n+1}(\boldsymbol{u}^*-\boldsymbol{u}_p^*). \end{equation}$\Delta \boldsymbol {V}_i=\boldsymbol {V}_i^{n+1}-\boldsymbol {V}_i^n$ from (B7) and in angular velocity $\Delta \boldsymbol {\varOmega }_i=\boldsymbol {\varOmega }_i^{n+1} -\boldsymbol {\varOmega }_i^n$ from (B8), as
(B15)where\begin{equation} \phi^{n+1}(\boldsymbol{u}_p^{n+1}-\boldsymbol{u}_p^*)=\sum_i\phi_i^{n+1} [\Delta\boldsymbol{V}_i^H+\Delta\boldsymbol{\varOmega}_i^H\times\boldsymbol{r}_i^{n+1}] +\sum_i\phi_i^{n+1}\Delta\boldsymbol{V}_i^C, \end{equation}$\Delta \boldsymbol {V}_i^H$, $\Delta \boldsymbol {\varOmega }_i^H$ and $\Delta \boldsymbol {V}_i^C$ are the updates by the hydrodynamic forces $\boldsymbol {F}_i^H$ and $\boldsymbol {N}_i^H$ and the inter-particle force $\boldsymbol {F}_i^C$, respectively. Therefore, $\phi \boldsymbol {f}_p$ can be decomposed into the individual contributions from the hydrodynamic interactions $\phi \boldsymbol {f}_p^H$ and direct inter-particle interactions $\phi \boldsymbol {f}_p^C$, as $\phi \boldsymbol {f}_p=\phi \boldsymbol {f}_p^H+\phi \boldsymbol {f}_p^C$. The individual contributions of the body force are expressed to first order in time as
(B16)\begin{gather} \phi\boldsymbol{f}_p^H\Delta t=\sum_i\phi_i^{n+1}[\Delta\boldsymbol{V}_i^H+ \Delta\boldsymbol{\varOmega}_i^H\times\boldsymbol{r}_i^{n+1}] -\phi^{n+1}(\boldsymbol{u}^*-\boldsymbol{u}_p^*), \end{gather}(B17)In the calculation of the stresslet contribution from\begin{gather}\phi\boldsymbol{f}_p^C\Delta t= \sum_i\phi_i^{n+1}\Delta\boldsymbol{V}_i^C. \end{gather}$\phi \boldsymbol {f}_p^C$, the direct virial expression was used instead of (B17) for computational efficiency (Molina et al. Reference Molina, Otomura, Shiba, Kobayashi, Sano and Yamamoto2016):
(B18)where\begin{equation} \boldsymbol{\mathsf{S}}^C={-}\frac{1}{N}\int_{D_V} \boldsymbol{r}\rho\phi\boldsymbol{f}_p^C\textrm{d}\boldsymbol{r} ={-}\frac{1}{N}\sum_{i < j}\boldsymbol{r}_{ij}\boldsymbol{F}_{ij}^C, \end{equation}$\boldsymbol {F}_{ij}^C$ is the inter-particle force on the $i$th particle due to the $j$th particle. In this study, for conditions up to $\phi _p=0.1$ and ${Wi}=2.5$, the contribution of ${\mathsf{S}}_{12}^C$ to the total stresslet ${\mathsf{S}}_{12}$ is small compared to the hydrodynamic contributions ($\langle {\mathsf{S}}_{12}^C\rangle /\langle {\mathsf{S}}_{12}\rangle <0.05$ at $\phi _p=0.1$).(xi) Update of the velocity field (V-2). Finally, the integrated body force
$\phi \boldsymbol {f}_p$ is remapped and transformed from the orthogonal coordinate system to the oblique coordinate system and added to the intermediate velocity field $\hat {\boldsymbol {\xi }}^*$:
(B19)At this stage, incompressibility is assigned in the Fourier space,\begin{equation} \hat{\boldsymbol{\xi}}^{n+1}=\hat{\boldsymbol{\xi}}^* + \widehat{\left[\int_{t^n}^{t^{n+1}}\phi\boldsymbol{f}_p\,\textrm{d}s\right]}. \end{equation}(B20)This solenoidal projection is also adopted after calculating\begin{equation} \hat{\boldsymbol{\xi}}_{\boldsymbol{k}}\leftarrow \hat{\boldsymbol{\xi}}_{\boldsymbol{k}}- \frac{(\hat{\xi}_{\boldsymbol{k}}\boldsymbol{\cdot}\hat{\boldsymbol{k}})} {\hat{\boldsymbol{k}}\boldsymbol{\cdot}\hat{\boldsymbol{k}}}\hat{\boldsymbol{k}}. \end{equation}$\hat {\boldsymbol {\xi }}^*$ (V-1).The described fractional steps are repeated until the calculated time reaches the target final time. Further information about the time-stepping algorithm is detailed in previous work (Nakayama et al. Reference Nakayama, Kim and Yamamoto2008; Molina et al. Reference Molina, Otomura, Shiba, Kobayashi, Sano and Yamamoto2016).


B.2. Spatial discretization and time integral scheme
Since the periodic boundary conditions are assigned in each direction, the continuum variables such as  $\hat {\boldsymbol {\xi }}$ and
 $\hat {\boldsymbol{\mathsf{C}}}$ are Fourier-transformed. In real space, the continuum variables are collocated on the equispaced mesh point with spacing
 $\varDelta$. Spatial derivatives are calculated in Fourier space while the second-order terms like the advection term in (A11) and (A16) are calculated by a transformation method (Orszag Reference Orszag1969).
For the integration of  $\hat {\boldsymbol {\xi }}_{\boldsymbol {k}}$ over time, the exact linear part method, which is preferred for solving stiff equations (Beylkin, Keiser & Vozovoi Reference Beylkin, Keiser and Vozovoi1998), is adopted, where the nonlinear part is discretized by the Euler method.
For the polymer constitutive equation, the explicit Euler method (first-order) is adopted. In this study, to evaluate a single-particle system that corresponds to very dilute suspensions ( $\phi _p\sim 0.001$), the discretized equation (A16) is solved directly. This naive implementation has been stable and accurate in such dilute conditions. However, at high
 $\phi _p$ and
 ${Wi}$ conditions, the large growth rate of the polymer stress around the particles violates the positive-definiteness of the conformation tensor, thus resulting in an inaccurate solution or divergence. Therefore, to evaluate a many-particle system that corresponds to semidilute suspensions (
 $0.025\leqslant \phi _p\leqslant 0.1$), the log-conformation formalism is used in which the time evolution equation of
 $\log \boldsymbol{\mathsf{C}}$ rather than
 $\boldsymbol{\mathsf{C}}$ is solved to guarantee the positive-definiteness of
 $\boldsymbol{\mathsf{C}}$ (Fattal & Kupferman Reference Fattal and Kupferman2004; Hulsen, Fattal & Kupferman Reference Hulsen, Fattal and Kupferman2005). A detailed description of the log-conformation formalism is provided in appendix B.3.
The particle position is updated by discretizing (B3) by the Euler method (first-order) at the first time step and the second-order Adams–Bashforth scheme later. In the update of the particle velocity (B7) and (B8), the impulsive hydrodynamic force and torque are calculated by applying (B5) and (B6), respectively, and the potential force  $\boldsymbol {F}^C$ in (B7) is discretized by the second-order Heun scheme because both particle positions at
 $t^n$ and
 $t^{n+1}$ are already obtained in that stage:
 \begin{equation} \frac{1}{M_i}\int_{t^n}^{t^{n+1}}\boldsymbol{F}_i^C\textrm{d}s =\frac{\Delta t}{2M_i} [\boldsymbol{F}_i^C(\boldsymbol{R}^{n+1})+\boldsymbol{F}_i^C(\boldsymbol{R}^n) ]. \end{equation}
The time increment is determined based on the stability given by the fluid momentum diffusion:  $\Delta t=\rho /\eta _0K_{max}^2$ (
 $K_{max}$ is the largest wavenumber in the spectral scheme). As proven in the code validations in § 3.1 and appendix C, this choice is reasonable considering the conditions in this study.
B.3. Log-conformation-based constitutive equation for Oldroyd-B model
Because the conformation tensor  $\boldsymbol{\mathsf{C}}$ is real-symmetric and positive-definite,
 $\boldsymbol{\mathsf{C}}$ can be diagonalized as
 \begin{equation} \boldsymbol{\mathsf{C}}= \boldsymbol{\mathsf{R}}\boldsymbol{\cdot}\boldsymbol{\varLambda} \boldsymbol{\cdot} \boldsymbol{\mathsf{R}}^\textrm{T}, \end{equation}
where  $\boldsymbol {\varLambda }=\textrm {{diag}}(\lambda _1,\lambda _2,\lambda _3)$ and
 $\lambda _i>0\ (i=1,2,3)$ are the eigenvalues of
 $\boldsymbol{\mathsf{C}}$, and
 $\boldsymbol{\mathsf{R}}$ is the rotation matrix composed of the eigenvectors of
 $\boldsymbol{\mathsf{C}}$. Here, the new tensor variable
 $\boldsymbol {\varPsi }$ is introduced (Fattal & Kupferman Reference Fattal and Kupferman2004) as
 \begin{equation} \boldsymbol{\varPsi}= \boldsymbol{\mathsf{R}}\boldsymbol{\cdot} \boldsymbol{\varLambda}_{\varPsi}\boldsymbol{\cdot} \boldsymbol{\mathsf{R}}^{\rm T}, \end{equation}
where  $\boldsymbol {\varLambda }_{\varPsi }=\textrm {{diag}}(\ln \lambda _1,\ln \lambda _2,\ln \lambda _3) =\ln \boldsymbol {\varLambda }$. From (B22) and (B23),
 \begin{equation} \boldsymbol{\mathsf{C}}= \boldsymbol{\mathsf{R}}\boldsymbol{\cdot}\exp (\boldsymbol{\varLambda}_{\varPsi})\boldsymbol{\cdot} \boldsymbol{\mathsf{R}}^\textrm{T}. \end{equation}
Note that, when  $\boldsymbol{\mathsf{C}}$ is obtained through (B24),
 $\boldsymbol{\mathsf{C}}$ is strictly positive-definite by definition. Furthermore, utilizing the time evolution of
 $\boldsymbol {\varPsi }$ instead of (2.4), the exponential growth in
 $\boldsymbol{\mathsf{C}}$ is translated to the linear growth of
 $\boldsymbol {\varPsi }$, which enables numerical stability in the time evolution. Specifically, the stretching in the principal axes of
 $\boldsymbol{\mathsf{C}}$ by the velocity gradient tensor
 $\boldsymbol {\nabla }\boldsymbol {u}$ is extracted as
 \begin{gather} \boldsymbol{\nabla}\boldsymbol{u}= \boldsymbol{\mathsf{R}}\boldsymbol{\cdot} \boldsymbol{\mathsf{M}}\boldsymbol{\cdot} \boldsymbol{\mathsf{R}}^\textrm{T}, \end{gather}
 \begin{gather}\boldsymbol{\mathsf{B}}= \boldsymbol{\mathsf{R}}\boldsymbol{\cdot}\textrm{diag}(M_{11},M_{22},M_{33})\boldsymbol{\cdot} \boldsymbol{\mathsf{R}}^\textrm{T}, \end{gather}
where  $\boldsymbol{\mathsf{B}}$ is symmetric and commutes with
 $\boldsymbol{\mathsf{C}}$ by definition.
The residual component  $\boldsymbol {\nabla }\boldsymbol {u}-\boldsymbol{\mathsf{B}}$ can be decomposed as
 \begin{equation} \boldsymbol{\nabla}\boldsymbol{u}- \boldsymbol{\mathsf{B}} = \boldsymbol{\mathsf{A}}+ \boldsymbol{\mathsf{C}}^{{-}1}\boldsymbol{\cdot} \boldsymbol{\mathsf{N}}, \end{equation}
with antisymmetric tensors  $\boldsymbol{\mathsf{A}}$ and
 $\boldsymbol{\mathsf{N}}$ (Fattal & Kupferman Reference Fattal and Kupferman2004). Tensor
 $\boldsymbol{\mathsf{N}}$ is proven to be irrelevant in the affine deformation of
 $\boldsymbol{\mathsf{C}}$ by inserting (B27) into the upper-convected time derivative of
 $\boldsymbol{\mathsf{C}}$. On the other hand,
 $\boldsymbol{\mathsf{A}}$ represents the rotation of the principal axes of
 $\boldsymbol{\mathsf{C}}$. From the affine deformation of
 $\boldsymbol{\mathsf{C}}$ in (2.4), the explicit expression of
 $\boldsymbol{\mathsf{A}}$ in the frame of the principal axes of
 $\boldsymbol{\mathsf{C}}$ is derived by Hulsen et al. (Reference Hulsen, Fattal and Kupferman2005) as
 \begin{equation} {\mathsf{A}}_{ij}=\frac{\lambda_i{\mathsf{M}}_{ij}+\lambda_j{\mathsf{M}}_{ji}} {\lambda_i-\lambda_j},\quad i\neq j,\quad \lambda_i\neq\lambda_j \end{equation}
(the summation convention is not applied here). When  $\lambda _i=\lambda _j$,
 ${\mathsf{A}}_{ij}$ is not uniquely determined in the decomposition of
 $\boldsymbol {\nabla }\boldsymbol {u}$ in (B27), but the affine deformation of
 $\boldsymbol{\mathsf{C}}$ and
 $\boldsymbol {\varPsi }$ by
 $\boldsymbol {\nabla }\boldsymbol {u}$ is still well defined, which case is explained next.
By using these tensors, the governing equation of  $\boldsymbol {\varPsi }$ for the single-mode Oldroyd-B model is expressed as
 \begin{equation} \frac{\partial \boldsymbol{\varPsi}}{\partial t} +\boldsymbol{u}\boldsymbol{\cdot}\boldsymbol{\nabla}\boldsymbol{\varPsi} ={-} \boldsymbol{\mathsf{A}}\boldsymbol{\cdot}\boldsymbol{\varPsi} +\boldsymbol{\varPsi}\boldsymbol{\cdot} \boldsymbol{\mathsf{A}}+2 \boldsymbol{\mathsf{B}} + \boldsymbol{\mathsf{R}}\boldsymbol{\cdot} \left[\frac{1}{\lambda}(\boldsymbol{\varLambda}^{{-}1}- \boldsymbol{\mathsf{I}})\right] \boldsymbol{\cdot} \boldsymbol{\mathsf{R}}^\textrm{T}. \end{equation}
When  $\lambda _i=\lambda _j$, the corotational terms including
 ${\mathsf{A}}_{ij}$ are reduced as (in the frame of the principal axes of
 $\boldsymbol{\mathsf{C}}$)
 \begin{align} -{\mathsf{A}}_{ij}\varPsi_{jj}+\varPsi_{ii}{\mathsf{A}}_{ij} &= (\ln\lambda_i-\ln\lambda_j ) \frac{\lambda_i{\mathsf{M}}_{ij}+\lambda_j{\mathsf{M}}_{ji}}{\lambda_i-\lambda_j}\nonumber\\ &\to {\mathsf{M}}_{ij}+{\mathsf{M}}_{ji}=2{\mathsf{D}}_{ij} \end{align}
(the summation convention is not applied here). With this treatment, the evolution equation (B29) of  $\boldsymbol {\varPsi }$ works safely even when
 $\lambda _i=\lambda _j$ happens.
In the initial conditions,  $\boldsymbol {u}=\boldsymbol {0}$ over the entire domain leads to
 $\boldsymbol{\mathsf{A}}=\boldsymbol {0}$ and
 $\boldsymbol{\mathsf{B}}=\boldsymbol{\mathsf{D}}$, and
 $\boldsymbol{\mathsf{C}}=\boldsymbol{\mathsf{I}}$ results in
 $\boldsymbol{\mathsf{R}}=\boldsymbol{\mathsf{I}}$,
 $\boldsymbol {\varLambda }=\boldsymbol{\mathsf{I}}$ and
 $\boldsymbol {\varPsi }=\boldsymbol {0}$. The evolution of
 $\boldsymbol {\varPsi }$ according to (B29) is solved by numerical simulation; and
 $\boldsymbol{\mathsf{C}}$ is calculated from
 $\boldsymbol {\varPsi }$ via (B23) and (B24). The contravariant tensor expression corresponding to (B29) in the oblique coordinates is the following:
 \begin{align} \frac{\partial\hat{\varPsi}^{\mu\nu}}{\partial \hat{t}}+\hat{\xi}^{\gamma}\hat{ \boldsymbol{\nabla}}_{\gamma}\hat{\varPsi}^{\mu\nu}&={-}\dot{\gamma} (\hat{\varPsi}^{\mu2}\delta^{1,\nu}+\hat{\varPsi}^{2\nu} \delta^{1,\mu} )-{\mathsf{G}}_{\gamma\zeta}\hat{A}^{\mu\gamma}\hat{\varPsi}^{\zeta\nu}+ {\mathsf{G}}_{\gamma\zeta}\hat{\varPsi}^{\mu\gamma}\hat{A}^{\zeta\nu}\nonumber\\ &\quad +2\hat{B}^{\mu\nu}+\hat{R}^{\mu\gamma}\left[\frac{1}{\lambda}( [\hat{\boldsymbol{\varLambda}}]^{{-}1}_{\gamma\zeta} -{\mathsf{G}}_{\gamma\zeta})\right]\hat{R}^{\nu\zeta}, \end{align}
where  $[\hat {\boldsymbol {\varLambda }}]^{-1}_{\gamma \zeta }$ represents the covariant matrix component of
 $\hat {\boldsymbol {\varLambda }}^{-1}$, which is simply the matrix inverse of the contravariant matrix
 $\hat {\varLambda }^{\gamma \zeta }$; and
 ${\mathsf{G}}_{\gamma \zeta }$ is the covariant metric tensor, which is defined as
 \begin{equation} {\mathsf{G}}_{\gamma\zeta}\equiv\hat{\boldsymbol{E}}_{\gamma} \boldsymbol{\cdot}\hat{\boldsymbol{E}}_{\zeta}=\left( \begin{array}{@{}ccc@{}} 1 & \gamma(t) & 0 \\ \gamma(t) & 1+\gamma^2(t) & 0 \\ 0 & 0 & 1 \end{array} \right). \end{equation}
Note that, in the oblique coordinates, there is an additional term originating from the moving coordinates (the first term on right-hand side of (B31)). Since (B31) does not explicitly depend on the coordinate variables, it can be discretized by a spectral method.
Appendix C. Validations of the developed method
C.1. Polymer stress around a single particle
To test the validity of the developed method, a single-particle system is set up where a neutrally buoyant spherical particle is suspended in a sheared Oldroyd-B fluid (figure 1a). The cubic domain with a box length of  $L$ is sufficiently large compared to the size of the particle used to represent the dilute particle system. Hereafter, for simplicity, the directions of the Cartesian coordinate basis vectors are denoted by
 $x$,
 $y$ and
 $z$ instead of the 1, 2 and
 $3$ notation used in appendices A and B, where
 $x$,
 $y$ and
 $z$ indicate the flow, velocity-gradient and vorticity directions, respectively. As shown in figure 1(a), because the particle is located at the centre of a simple shear flow, the net translational hydrodynamic force acting on the particle
 $\boldsymbol {F}^H$ vanishes, while the hydrodynamic torque
 $\boldsymbol {N}^H$ rotates the particle.
A flow condition is considered in the  $\beta \to 1$, small-
 ${Wi}$ and small-
 ${Re}$ limit where an analytical solution is available. In this limit, the flow pattern is minimally affected by polymer stress, which is expressed analytically (Lin, Peery & Schowalter Reference Lin, Peery and Schowalter1970; Mikulencak & Morris Reference Mikulencak and Morris2004). Furthermore, when
 ${Wi}\ll 1$, the polymer stress distribution is approximated by the second-order fluid (SOF) theory:
 $\boldsymbol {\sigma }_p=2\eta _p\boldsymbol{\mathsf{D}}+4(\varPsi _1+\varPsi _2)\boldsymbol{\mathsf{D}} \boldsymbol {\cdot }\boldsymbol{\mathsf{D}} -\varPsi _1(\boldsymbol{\mathsf{D}}_{(2)}+4\boldsymbol{\mathsf{D}}\boldsymbol {\cdot } \boldsymbol{\mathsf{D}})$, where
 $\boldsymbol{\mathsf{D}}_{(2)}$ is the upper-convected derivative of
 $\boldsymbol{\mathsf{D}}$ (Bird et al. Reference Bird, Curtiss, Armstrong and Hassager1987). Considering an Oldroyd-B fluid (
 $\varPsi _1=2\eta _p\lambda ,\ \varPsi _2=0$), the normalized polymer stress in the SOF limit is expressed as
 $\boldsymbol {\sigma }_p/(\eta _p\dot {\gamma })= 2\tilde {\boldsymbol{\mathsf{D}}}-2{Wi}\tilde {\boldsymbol{\mathsf{D}}}_{(2)}$. Here,
 $\beta =0.99$,
 ${Wi}=0.001$ and
 ${Re}=0.0142$. In this situation, the normalized polymer stress is approximated by
 $\boldsymbol {\sigma }_p/(\eta _p\dot {\gamma })\approx 2\tilde {\boldsymbol{\mathsf{D}}}$.
Different mesh resolutions of the particle interface are examined:  $(a/\varDelta , \xi /\varDelta )= (8, 2)$,
 $(8, 1)$ and
 $(20, 2)$. At first, the overall trend of the polymer shear stress (
 $\sigma _{p,xy}$) distribution is similar for different resolutions (figure 20a–c) and the analytical solution (figure 20d). The only difference is that small
 $\sigma _{p,xy}$ oscillation is observed in the numerical solutions. When comparing the result for
 $a=8\varDelta$ and
 $\xi =2\varDelta$ (figure 20a) with that for
 $a=20\varDelta$ and
 $\xi =2\varDelta$ (figure 20c), it is clear that, as
 $a/\varDelta$ increases, the wavenumber of the small ripple in
 $\sigma _{p,xy}$ increases, but its amplitude decreases. This is due to the slow convergence of the Fourier series caused by the discontinuous change in
 $\sigma _{p,xy}$ at the solid–liquid interface. This artifact is a partly unavoidable intrinsic property of the spectral method. Regarding the interface thickness, when comparing the result for
 $a=8\varDelta$ and
 $\xi =2\varDelta$ (figure 20a) with that for
 $a=8\varDelta$ and
 $\xi =\varDelta$ (figure 20b), no significant difference in the overall trend is observed. However, when
 $\xi =\varDelta$, the distribution of
 ${\sigma }_{p,xy}$ near the interface is somewhat blurred, which is caused by the decrease in the number of mesh points that support the interface region.
Mesh resolution dependence of polymer shear stress distributions near the particle. In panels (a–d) the polymer shear stress normalized by  $\eta _p\dot {\gamma }$ on the shear plane through the centre of the particle is drawn by colour contour for
 $(a/\varDelta ,\xi /\varDelta )=(8,2)$,
 $(8,1)$ and
 $(20,2)$ and for the analytical solution, respectively. The dotted lines around the particles for the DNS results in panels (a–c) denote the radial location of
 $a+\xi /2$.(It may be necessary to zoom-in to see these.) In panel (e), the normalized polymer shear stress along the line from the particle centre to the shear gradient direction
 $y$ is drawn: the exact solution (analytical) of
 $\boldsymbol {\sigma }_p/(\eta _p\dot {\gamma }) \approx 2\tilde {\boldsymbol{\mathsf{D}}}-2{Wi}\tilde {\boldsymbol{\mathsf{D}}}_{(2)}$ at
 ${Wi}\to 0$ (solid line), and the results for
 $(a/\varDelta ,\xi /\varDelta )=(20,2)$ (red),
 $(8,2)$ (green) and
 $(8,1)$ (blue), respectively. In panel (e), the interface region indicated by
 $0<\phi <1$ at around
 $r_y/a=1$ with thickness
 $\xi$ is coloured in the same manner as that for the symbols.

For a detailed evaluation, a one-dimensional profile of the polymer shear stress in the velocity-gradient direction from the particle centre is shown in figure 20(e). The steep increase in  $\sigma _{p,xy}$ near the particle surface is reasonably reproduced as the mesh resolution increases, though the peak in
 $\sigma _{p,xy}$ is somewhat smeared due to the limited mesh points in the interface domain. Hereafter, considering a balance between the accuracy of the numerical solution and the required computational cost, the particle radius is set to
 $a=8\varDelta$ and the interface thickness to
 $\xi =2\varDelta$. As seen in appendix C.2 and § 3, this resolution is sufficiently valid for the problems investigated in this study.
C.2. Rotation of a particle under simple shear flow
Under simple shear in Stokes flow, as is well known, a suspended particle in a Newtonian medium rotates with an angular velocity that is half of the applied shear rate,  $\omega _z/\dot {\gamma }=0.5$, where
 $\omega _z$ is the particle angular velocity in the vorticity direction. However, in viscoelastic fluids, this relative rotational speed decreases with increasing
 ${Wi}$ (Snijkers et al. Reference Snijkers, D'Avino, Maffettone, Greco, Hulsen and Vermant2009, Reference Snijkers, D'Avino, Maffettone, Greco, Hulsen and Vermant2011). D'Avino et al. (Reference D'Avino, Hulsen, Snijkers, Vermant, Greco and Maffettone2008) and Snijkers et al. (Reference Snijkers, D'Avino, Maffettone, Greco, Hulsen and Vermant2009, Reference Snijkers, D'Avino, Maffettone, Greco, Hulsen and Vermant2011) conducted numerical evaluation for this phenomenon using a finite element method (FEM) and surface-conforming mesh, reproducing the experimental rotational slowdown data with DNS. They observed that the distribution of local torque and pressure on the particle surface becomes asymmetrical with
 ${Wi}$. However, the physics of slowdown has not been elucidated. This result is often referred to as the benchmark problem for a newly developed numerical scheme of viscoelastic suspensions (Ji et al. Reference Ji, Jiang, Winkler and Gompper2011; Yang et al. Reference Yang, Krishnan and Shaqfeh2016; Vázquez-Quesada & Ellero Reference Vázquez-Quesada and Ellero2017; Fernandes et al. Reference Fernandes, Faroughi, Carneiro, Nóbrega and McKinley2019). To validate the method developed in this work, the angular velocity of a particle in an Oldroyd-B fluid is evaluated at the same numerical conditions as previously reported (Snijkers et al. Reference Snijkers, D'Avino, Maffettone, Greco, Hulsen and Vermant2009); however, no walls are used in this study. The numerical set-up is the same as that in § 3.1.
Figures 21(a) and 21(b) show the  $\beta$ and
 ${Wi}$ dependence of the normalized particle angular velocity
 $\omega _z/\dot {\gamma }$. To compare with the previous numerical result, figure 21(a) shows the result at
 $\beta =0.615$. As
 ${Wi}$ increases,
 $\omega _z/\dot {\gamma }$ decreases. At
 ${Wi}\lesssim 1$, the result converges with the theoretical prediction up to
 $O(Wi^4)$ made using asymptotic methods (Housiadas & Tanner Reference Housiadas and Tanner2011a,b, Reference Housiadas and TannerReference Housiadas and Tanner2018):
 $\omega _z/\dot {\gamma }=1/2-(1-\beta ){Wi}^2/[4(1-4{Wi}^2\tilde {\varOmega }_4)]$, where
 $\tilde {\varOmega }_4$ is the coefficient of the
 $(1-\beta ){Wi}^4$ term in the series solution. At
 ${Wi}\gtrsim 1$, the asymptotic prediction starts to overestimate
 $\omega _z/\dot {\gamma }$. In this region, the result agrees reasonably well with the previous FEM result (Snijkers et al. Reference Snijkers, D'Avino, Maffettone, Greco, Hulsen and Vermant2009). Figure 21(b) shows the
 $\beta$ dependence of
 $\omega _z/\dot {\gamma }$. As
 $\beta$ decreases, which corresponds to an increase in the polymer stress contribution, the negative slope of
 $\omega _z/\dot {\gamma }$ increases. This trend is consistent with the asymptotic predictions shown in figure 21(b).
The  ${Wi}$ dependence of the normalized particle angular velocity
 $\omega _z/\dot {\gamma }$. (a) The result of this work (red circles) compared with a previous numerical result (solid line; Snijkers et al. Reference Snijkers, D'Avino, Maffettone, Greco, Hulsen and Vermant2009) and the asymptotic solution (dashed line; Housiadas & Tanner Reference Housiadas and Tanner2011a,b, Reference Housiadas and Tanner2018) at
 $\beta =0.615$. (b) The
 $\beta$ dependence of
 $\omega _z/\dot {\gamma }$ for:
 $\beta =0.2$ (red circles),
 $0.5$ (orange squares),
 $0.615$ (green triangles) and
 $0.8$ (blue diamonds). The lines correspond to predictions of the asymptotic solution.

The slowdown of rotation with increasing  ${Wi}$ and/or
 $(1-\beta )$ suggests that the energy partition from external work to elastic energy increases. Figure 22 shows the normalized energy dissipation rate around the particle on the shear plane through the particle centre at
 $\beta =0.5$ and
 ${Wi}=0.1$ and
 $1.0$. The dissipation rate is decomposed into viscous (
 $\varPhi _{s}$) and elastic (
 $\varPhi _{p}$) contributions (Vázquez-Quesada et al. Reference Vázquez-Quesada, Espa nol, Tanner and Ellero2019) as
 $\varPhi _{{t}}=\varPhi _{{s}}+\varPhi _{{p}}$:
 \begin{gather} \varPhi_{s}=2\eta_s \boldsymbol{\mathsf{D}}\boldsymbol{:} \boldsymbol{\mathsf{D}}, \end{gather}
 \begin{gather}\varPhi_{p}=\frac{\eta_p}{2\lambda^2} (\textrm{tr}\, \boldsymbol{\mathsf{C}}+\textrm{tr}\, \boldsymbol{\mathsf{C}}^{{-}1}-6 ). \end{gather}
At  ${Wi}=0.1$,
 $\varPhi _{s}$ (figure 22a) and
 $\varPhi _{p}$ (figure 22b) present similar distributions. Since
 $\boldsymbol {\sigma }_p= (\eta _p/\lambda )(\boldsymbol{\mathsf{C}}-\boldsymbol{\mathsf{I}})\to 2\eta _p\boldsymbol{\mathsf{D}}$ at
 ${Wi}\to 0$,
 $\varPhi _{p}$ is reduced to
 $2\eta _p\boldsymbol{\mathsf{D}}\boldsymbol {:}\boldsymbol{\mathsf{D}}$, which is proportional to
 $\varPhi _{s}$. In contrast, at
 ${Wi}=1.0$,
 $\varPhi _{s}$ and
 $\varPhi _{p}$ develop differently; the high-
 $\varPhi _{p}$ region expands, whereas
 $\varPhi _{s}$ does not change much in comparison to the
 ${Wi}=0.1$ case. The distribution of
 $\varPhi _{p}$ expands towards the shear-flow direction and high-
 $\varPhi _{p}$ grows near the equator of the particle (figure 22d), thus clearly showing an increase in the fraction of elastic energy dissipation at high
 ${Wi}$. Particle rotation is caused by viscous stress. An increase in elastic energy leads to a decrease in the relative fraction of viscous dissipation. As a result, the angular velocity of the particle in the viscoelastic medium decreases in comparison with that in viscous media. This slowdown of the particle rotation is enhanced with
 ${Wi}$ and
 $(1-\beta )$.
The  ${Wi}$ dependence of the normalized energy dissipation around a particle at
 $\beta =0.5$: (a,b)
 ${Wi}=0.1$ and (c,d)
 ${Wi}=1.0$. Panels (a,c) and (b,d) show the distributions of viscous dissipation
 $\varPhi _{s}/(\eta _0\dot {\gamma }^2)$ and polymer dissipation
 $\varPhi _{p}/(\eta _0\dot {\gamma }^2)$, respectively. The dotted lines around particles show the radial location of
 $a+\xi /2$. (Again, it may be necessary to zoom-in to see these.)

In this section, the agreement between the numerical results of this work and the previously reported numerical and theoretical results verifies that the presented numerical scheme can successfully capture the dynamic coupling between particles and a viscoelastic fluid.



