1. Introduction
In the bank regulatory frameworks of Basel II and Basel III, as well as in the insurance regulatory regimes such as Solvency II and Swiss Solvency Test, capital requirements for all financial institutions and (re)insurance companies operating within the European Union and Switzerland are solely based on the Value at Risk (VaR) and the Expected Shortfall (ES). For these reasons and not only, risk measures are widely applied by financial and insurance institutions for pricing and decision-making. Generally, a risk measure is a mapping from some space of random risks to a set of real numbers, which quantifies risk exposure. However, in the broader literature of risk management, there is no answer to the question of which risk measure is the best. An axiomatic definition of coherent risk measures is introduced by Artzner (Reference Artzner1999) to prescribe a set of reasonable risk measures, satisfying the properties of monotonicity, positive homogeneity, sub-additivity, and translation invariance.
The most popular coherent risk measure is the Tail Value at Risk introduced by Rockafellar and Uryasev (Reference Rockafellar and Uryasev2002), which is similar to the ES in Acerbi and Tasche (Reference Acerbi and Tasche2002). Many other typical coherent risk measures have been proposed from different perspectives, such as the worst conditional expectation of Artzner (Reference Artzner1999), the distortion risk measure of Wang et al. (Reference Wang, Young and Panjer1997), the spectral risk measure of Acerbi (Reference Acerbi2002), and the entropic risk measure of Föllmer and Knispel (Reference Föllmer and Knispel2011), Gini-type risk measures of Furman et al. (Reference Furman, Wang and Zitikis2017), among many others. These risk measures are usually categorized as loss risk measures and variability risk measures, which reflect a first-order quantification of risk but may overlook higher-order risk aversion properties of investors, as pointed out by Chen et al. (Reference Chen, Hu and Lin2016). Bauer and Zanjani (Reference Bauer and Zanjani2016) argue that the crucial issue of constructing a suitable measure needs to be considered on institutional specifications and the economic environment.
Krokhmal (Reference Krokhmal2007) constructs a new family of the higher-moment (HM) coherent risk measures in the context of stochastic optimization, which generalizes the ES. Similar constructs are studied by Ben-Tal and Teboulle (Reference Ben-Tal and Teboulle2007). Due to its nice properties, the HM risk measure is further investigated by Krokhmal and Soberanis (Reference Krokhmal and Soberanis2010), Dentcheva et al. (Reference Dentcheva, Penev and Ruszczyński2010), Krokhmal et al. (Reference Krokhmal, Zabarankin and Uryasev2011), Chen et al. (Reference Chen, Zhang and Yang2011), Matmoura and Penev (Reference Matmoura and Penev2013), Vinel and Krokhmal (Reference Vinel and Krokhmal2017), Dentcheva et al. (Reference Dentcheva, Penev and Ruszczyński2017), Kouri (Reference Kouri2019), and Gómez et al. (Reference Gómez, Tang and Tong2022) among many others, in portfolio optimization and risk management. The HM risk measure shares the features of both loss risk measures and variability risk measures, as noted by Gómez et al. (Reference Gómez, Tang and Tong2022). Parallel to the HM risk measure, on Orlicz spaces, the Haezendonck–Goovaerts (HG) risk measure (Haezendonck and Goovaerts Reference Haezendonck and Goovaerts1982; Goovaerts et al. Reference Goovaerts, Kaas, Dhaene and Tang2004) is defined as the optimal value in a problem of minimization based on Orlicz norms. The HG risk measure has originated an active research trend in actuarial science, see Bellini and Rosazza Gianin (Reference Bellini and Rosazza Gianin2008, Reference Bellini and Rosazza Gianin2012), Tang and Yang (Reference Tang and Yang2012, Reference Tang and Yang2014), Ahn and Shyamalkumar (Reference Ahn and Shyamalkumar2014), Gao et al. (Reference Gao, Munari and Xanthos2020), Bellini et al. (Reference Bellini, Laeven and Rosazza Gianin2021), and Xun et al. (Reference Xun, Jiang and Guo2021).
Assessing extreme risk exposure under a certain risk measure, especially in the most adverse scenario, is a common practice in the modern risk management framework. For example, academics, practitioners, and regulators have considered multiple approaches to measuring the sensitivity of a legal entity’s financial performance when an observable factor is located in an extreme region. The Marginal Expected Shortfall (MES) is a popular indicator of systemic risk in the financial and actuarial literature. Comprehensive discussions can be found in Idier et al. (Reference Idier, Lamé and Mésonnier2014). Specifically, the MES is a conditional expectation,
 $E(X\big|Y \gt t)$
for large values of t, where X is a risk from the insurer/investor portfolio of risks and Y is the common risk or reference risk of the portfolio specifying the adverse scenario. Various measures of systemic risk are proposed in the literature, such as the Conditional Value at Risk (CoVaR) and the
 $\Delta\mathrm{CoVaR}$
by Adrian and Brunnermeier (Reference Adrian and Brunnermeier2016) and the Conditional Expected Shortfall (CoES) by Mainik and Schaanning (Reference Mainik and Schaanning2014). To further generalize the CoES in the study of systemic risk, Xun et al. (Reference Xun, Jiang and Guo2021) propose a conditional version of the HG (CoHG) risk measure of X given a catastrophic scenario that Y exceeds a high threshold. It is often hard to calculate these conditional risk measures analytically as it requires understanding how the risks are interplayed, which makes it meaningful and valuable to seek asymptotic estimates. Various asymptotic studies of the aforementioned conditional risk measures are conducted in the literature, including the MES and its variations by Li (Reference Li2022) and Chen and Liu (Reference Chen and Liu2022), and the CoVaR by Nolde et al. (Reference Nolde, Zhou and Zhou2022). Our main results provide asymptotic results for a conditional version of the HM (CoHM) risk measure, which generalizes the CoES.
Motivated by these, in this paper, to retrieve the nice properties of the HM risk measure, we propose the CoHM risk measure by incorporating the information of an observable factor. Specifically, we consider the CoHM risk measure of
 $\left(X\big|Y \gt t\right)$
, where t serves as a threshold. A common choice of t is the VaR of Y at level
 $p\in(0,1).$
Clearly, the CoHM shares many similarities with the CoHG. The purpose of this paper is to evaluate asymptotic approximations of the CoHM for the confidence level
 $q\in(0,1)$
in a reasonable range under a weak contagion over risk variables X and Y. We carry out intensive numerical studies to apply this research in approximating the CoHG and to examine the performance of these asymptotic formulas. An immediate application of parameter sensitivity analysis on the
 $\Delta \mathrm{CoHG}$
is provided to further illustrate the risk contribution of the CoHG in the study of systemic risk. As a further extension, we propose an extrapolated estimator for the CoHM with the Fréchet tail and perform simulations to show its good performance. It is apparent that our results may help regulators and decision-makers understand the downside risk better.
The rest of this paper is organized as follows: Section 2 introduces the CoHM risk measure and sets up the framework for our asymptotic study of the CoHM risk measure; Section 3 presents our main results; Section 4 gives numerical studies; Section 5 compares the performance of estimators with a simulation study; Section 6 makes some concluding remarks. Finally, the Appendix prepares several lemmas and collects all proofs.
2. Preliminaries
2.1. Notation conventions
Throughout the paper, we will derive various types of limit relations for which the limit procedure is either
 $q\uparrow1$
or
 $x \uparrow \infty$
unless otherwise stated. For two positive functions
 $f({\cdot})$
and
 $g({\cdot})$
, we write
 $f({\cdot}) \sim g({\cdot})$
if the ratio of the left-hand side and right-hand side converges to 1; that is,
 $\lim f/g = 1$
. We also write
 $f=o(g)$
if
 $\lim f/g = 0$
.
For
 $x, y \in \mathbb{R} = ({-}\infty, \infty)$
, we write
 $x\wedge y = \min\{x,y\}$
and
 $x \vee y = \max\{x,y\}$
. Moreover, we use
 $x_{+}=x\vee 0=x1_{(x\geq 0)}$
to denote the positive part of x, where
 $1_{D}$
is the indicator of an event D, which equals 1 if D occurs and 0 otherwise.
For a distribution function F of X, denote by
 $F^{\leftarrow}$
and
 $F^{\rightarrow}$
its left and right generalized inverses, respectively:
 \begin{align*}F^{\leftarrow}(q)=\inf\left\{x\in\mathbb{R}\,:\,F(x)\geq q\right\},\quad F^{\rightarrow}(q)=\sup\left\{x\in\mathbb{R}\,:\,F(x)\leq q \right\},\quad q\in\left[0,1\right], \end{align*}
where, by convention,
 $\inf\emptyset$
is the right endpoint of its support set and
 $\sup\emptyset$
is the left endpoint of it. Also,
 $F^{\leftarrow}(q)$
is the VaR of X at level q.
2.2. The CoHM risk measure
Let X be a real-valued random variable, representing a risk variable in loss–profit style, with a distribution function
 $F=1-\overline{F}$
on
 $\mathbb{R}$
and the essential supremum
 $\hat{x}=F^{\leftarrow}(1)$
. Following Krokhmal (Reference Krokhmal2007), for
 $X\in L^{k}$
for some
 $k\geq1,$
that is,
 $ \left\lVert X\right\rVert _{k}=\left(E\big|X\big|^k\right)^{\frac{1}{k}} \lt \infty,$
the HM risk measure of X for
 $q\in(0,1)$
is defined to be
 \begin{eqnarray*}\mathrm{HM}_q(X)=\inf_{0 \lt x \lt \hat{x}}\left\{x+\frac{1}{1-q}\left\lVert(X-x)_{+}\right\rVert _{k}\right\}. \end{eqnarray*}
Now, we introduce a CoHM risk measure as a natural extension by incorporating the information from Y so that the dependence between
 $X \in L^{k}$
and Y is taken into account explicitly. The CoHM risk measure of X given
 $(Y \gt y_p)$
and for two confidence levels
 $p,q\in(0,1)$
is defined as:
 \begin{eqnarray}\mathrm{CoHM}_{p,q}\left(X\big|Y\right)=\inf_{0 \lt x \lt \hat{x}}\left\{x+\frac{1}{1-q}\left\lVert(X-x)_{+}\big|Y \gt y_p\right\rVert_{k}\right\},\end{eqnarray}
where
 $y_p=G^{\leftarrow}(p)$
is the VaR of the risk variable Y distributed by G at level p.
When
 $k=1$
, the infimum in (2.1) is attained at any point in a closed set
 $\left[F^{\leftarrow}_{X |Y \gt y_p}(q),F^{\rightarrow}_{X |Y \gt y_p}(q)\right]$
, which is a proper interval when q corresponds to the level of a flat piece of the conditional distribution
 $F_{X |Y \gt y_p}$
and is a single point otherwise. Thus,
 \begin{eqnarray}\mathrm{CoHM}_{p,q}\left(X\big|Y\right)=x^{\ast}+\frac{1}{1-q}E\left[(X-x^{\ast})_{+}\big|Y \gt y_p\right],\end{eqnarray}
where the minimizer is
 \begin{align*}x^{\ast}=\mathrm{CoVaR}_{p,q}\left(X\big|Y\right)=F^{\leftarrow}_{X |Y \gt y_p}(q). \end{align*}
Following the discussions of the CoVaR and the CoES in Fang and Li (Reference Fang and Li2018), we realize that (2.2) is an alternative expression for the CoES with confidence levels
 $p,q\in(0,1)$
:
 \begin{eqnarray*}\mathrm{CoES}_{p,q}\left(X\big|Y\right)=\frac{1}{1-q}\int_{q}^{1}\mathrm{CoVaR}_{p,r}\left(X\big|Y\right)\mathrm{d}r.\end{eqnarray*}
For a risk variable X, denote by
 $\hat{p}=P(X=\hat{x})$
the probability assigned to the upper endpoint. Obviously,
 $\hat{p}=0$
holds automatically if X is unbounded from above or if F is continuous at
 $\hat{x}.$
For simplicity, we only consider the case with
 $\hat{p}=0.$
By transplanting Theorem 2.1 of Tang and Yang (Reference Tang and Yang2012) to the current context, when
 $k \gt 1,$
the CoHM risk measure is given by:
 \begin{eqnarray}\mathrm{CoHM}_{p,q}\left(X\big|Y\right)=x^{\ast}+\frac{1}{1-q}\left\lVert(X-x^{\ast})_{+}\big|Y \gt y_p\right\rVert_k,\end{eqnarray}
where the minimizer
 $x=x^{\ast} \lt \hat{x}$
is the unique solution to the equation:
 \begin{eqnarray}\frac{\left\lVert(X-x)_{+}\big|Y \gt y_p\right\rVert_{k-1}}{\left\lVert(X-x)_{+}\big|Y \gt y_p\right\rVert_{k}}=(1-q)^{\frac{1}{k-1}}.\end{eqnarray}
We further point out that the CoHG risk measure proposed in Xun et al. (Reference Xun, Jiang and Guo2021) reduces to the CoHM risk measure (2.1) when taking a power Young function, that is,
 $\varphi(t)=t^k$
for
 $k\geq 1$
and the confidence level
 $\tilde{q}=1-(1-q)^{k}$
. See also Section 4.1. Hence, similar to Property 2.1 of Xun et al. (Reference Xun, Jiang and Guo2021), we conclude the following lemma.
Lemma 2.1.
Considering the
 $\mathrm{CoHM}_{p, q}\left(X\big|Y\right)$
risk measure above, we have
-
(i)
 $\mathrm{CoHM}_{p, q}\left(X\big|Y\right)$
increases in
$q \in(0,1)$
;
-
(ii)
$\mathrm{CoVaR}_{p, q}\left(X\big|Y\right) \leq \mathrm{CoHM}_{p, q}\left(X\big|Y\right) \leq \hat{x}$
; -
(iii) The CoHM risk measure is coherent.


2.3. Regular variation
A positively measurable function
 $f({\cdot})$
:
 $\mathbb{R}^{+} \rightarrow \mathbb{R}$
is said to be regularly varying at
 $x_0=0+$
or
 $\infty$
with a index
 $\alpha\in\mathbb{R}$
, denoted by
 $f({\cdot})\in\mathcal{R}_{\alpha}(x_{0})$
, if
 \begin{equation*}\lim _{x \rightarrow x_{0}} \frac{f(x y)}{f(x)}=y^{\alpha},\quad y \gt 0.\end{equation*}
The class
 $\mathcal{R}_{0}(x_{0})$
consists of functions slowly varying at
 $x_0$
. Moreover, a positively measurable function
 $f({\cdot})$
:
 $\mathbb{R}^{+} \rightarrow \mathbb{R}$
is said to be rapidly varying at
 $x_0=0+$
or
 $\infty$
, denoted by
 $f({\cdot})\in\mathcal{R}_{\infty}(x_{0})$
, if
 \begin{equation*}\lim _{x \rightarrow x_{0}} \frac{f(x y)}{f(x)}= \infty, \quad y \gt 1.\end{equation*}
2.4. Extreme value theory and maximum domain of attraction
To develop the main results of this paper, we extensively employ the Extreme Value Theory. A distribution function F is said to belong to the Maximum Domain of Attraction (MDA) of a non-degenerate distribution function H, written as
 $F\in \mathrm{MDA}(H)$
, if there are some
 $c_{n} \gt 0$
and
 $d_{n} \in \mathbb{R}$
for
 $n \in \mathbb{N}$
such that
 \begin{equation*}\lim _{n \rightarrow \infty} F^{n}\left(c_{n} x+d_{n}\right)=H(x).\end{equation*}
Due to the classical Fisher–Tippett theorem (see Fisher and Tippett, Reference Fisher and Tippett1928 and Gnedenko, Reference Gnedenko1943), H has to be the generalized extreme value distribution whose standard version is given by:

A distribution function F belongs to
 $\mathrm{MDA}(\Phi_{\gamma})$
if and only if
 $\hat{x}$
is infinite and the relation
 \begin{equation*}\lim _{x \uparrow \infty} \frac{\overline{F}(xy)}{\overline{F}(x)}=y^{-\gamma}, \qquad y \gt 0,\end{equation*}
holds; see Theorem 3.3.7 of Embrechts et al. (Reference Embrechts, Mikosch and Klüppelberg1997). Alternatively, the condition can be restated as
 $F\in \mathrm{MDA}(\Phi_{\gamma})$
if and only if
 $\overline{F}({\cdot})\in \mathcal{R}_{-\gamma}(\infty)$
.
A distribution function F belongs to
 $\mathrm{MDA}(\Lambda)$
with
 $\hat{x} \leq \infty$
if and only if the relation
 \begin{equation*}\lim _{x \uparrow \hat{x}} \frac{\overline{F}(x+y a(x))}{\overline{F}(x)}=\mathrm{e}^{-y}, \qquad y \in \mathbb{R},\end{equation*}
holds for some positive auxiliary function
 $a({\cdot})$
on (
 $-\infty$
,
 $\hat{x}$
). For
 $F \in \mathrm{MDA}(\Lambda)$
,
 $\overline{F}({\cdot})\in \mathcal{R}_{-\infty}(\infty)$
provided
 $\hat{x}=\infty$
or
 $\overline{F}(\hat{x}-\cdot)\in \mathcal{R}_{\infty}(0{+})$
provided
 $\hat{x} \lt \infty$
. The mean excess loss function is one of the commonly used choices for the auxiliary function
 $a({\cdot})$
, that is,
 $a(x)=E(X-x\big|X \gt x)$
, for
 $x \lt \hat{x}$
. Moreover, as
 $x \rightarrow \hat{x}$
,
 \begin{align} \begin{cases}a(x)=o(x), & \text { if } \hat{x}=\infty \\[3pt] a(x)=o(\hat{x}-x), & \text { if } \hat{x} \lt \infty\end{cases}\end{align}
see details in Resnick (Reference Resnick1987) and Embrechts et al. (Reference Embrechts, Mikosch and Klüppelberg1997). The following gives a nice representation of
 $F \in \mathrm{MDA}(\Lambda)$
due to Balkema and de Haan (Reference Balkema and de Haan1972), Proposition 1.4 of Resnick (Reference Resnick1987), or relation (3.35) Embrechts et al. (Reference Embrechts, Mikosch and Klüppelberg1997). For
 $F \in \mathrm{MDA}(\Lambda)$
with
 $\hat{x} \leq \infty$
, there is some
 $x_{0} \lt \hat{x}$
such that
 \begin{align}\overline{F}(x)=b(x) \exp \left\{-\int_{x_{0}}^{x} \frac{1}{a(y)} \mathrm{d}y \right\}, \qquad x_{0} \lt x \lt \hat{x},\end{align}
where
 $a({\cdot})$
denotes an auxiliary function, which is positive and absolutely continuous with
 $\lim _{x \uparrow \hat{x}} a^{\prime}(x)=0$
, and
 $b({\cdot})$
denotes a positive function with
 $\lim _{x \uparrow \hat{x}} b(x)= b \gt 0$
.
A distribution function F belongs to
 $\mathrm{MDA}(\Psi_{\gamma})$
if and only if
 $\hat{x}$
is finite and the relation
 \begin{equation*}\lim _{x \downarrow 0} \frac{\overline{F}(\hat{x}-x y)}{\overline{F}(\hat{x}-x)}=y^{\gamma}, \qquad y \gt 0,\end{equation*}
holds; see Theorem 3.3.12 of Embrechts et al. (Reference Embrechts, Mikosch and Klüppelberg1997). The equivalent condition in terms of regular variation is that
 $F\in \mathrm{MDA}(\Psi_{\gamma})$
if and only if
 $\overline{F}(\hat{x}-\cdot)\in \mathcal{R}_{\gamma}(0{+})$
.
2.5. Copula and dependence
Now, we turn to the dependence structure between the primary risk X and the reference risk Y by a comprehensive treatment of copulas. Let (X, Y) be a random vector with continuous marginal distributions F(x) and G(y). Then the dependence structure between X and Y is characterized in terms of a unique bivariate copula by Sklar’s theorem, with its joint distribution
 $P(X \leq x, Y\leq y)=C\left(F(x), G(y)\right)$
. The reader is referred to Nelsen (Reference Nelsen2007).
Definition 2.1. The corresponding survival copula is defined as:
 \begin{eqnarray*}\widehat{C}(u,v)=u+v-1+C(1-u,1-v), \qquad (u,v) \in [0,1]^{2}.\end{eqnarray*}
Clearly, such a bivariate function with respect to C(u, v) can also be described as:
 \begin{eqnarray*}\widehat{C}\left(\overline{F}(x),\overline{G}(y)\right)=P(X \gt x,Y \gt y).\end{eqnarray*}
Assume that C(u, v) is absolutely continuous, denote by
 $C_{1}(u,v) \,:\!=\, \frac{\partial}{\partial u}C(u,v)$
,
 $C_{2}(u,v)\,:\!=\,\frac{\partial}{\partial v}C(u,v)$
, and
 $C_{12}(u,v)\,:\!=\,\frac{\partial ^{2}}{\partial u \partial v}C(u,v)$
, then
 \begin{eqnarray*}\widehat{C}_{2}(u,v)\,:\!=\,\frac{\partial}{\partial v}\widehat{C}(u,v)=1-C_{2}(1-u,1-v), \\[-25pt]\end{eqnarray*}
 \begin{eqnarray*}\widehat{C}_{12}(u,v)\,:\!=\,\frac{\partial ^{2}}{\partial u \partial v}\widehat{C}(u,v)=C_{12}(1-u,1-v).\end{eqnarray*}
Given the properties of copula that enable the separation of dependence from marginal distributions, we assume X and Y are mutually affected via a general dependence structure defined in terms of copula. This assumption, attributed to Asimit and Badescu (Reference Asimit and Badescu2010), has been widely studied in financial and insurance literature as it allows both positive and negative dependences and is satisfied by many commonly used bivariate copulas. For detailed discussions, we refer the reader to Yang and Konstantinides (Reference Yang and Konstantinides2015) and Yang et al. (Reference Yang, Gao and Li2016) in modeling dependent financial and insurance risks and to Asimit and Li (Reference Asimit and Li2018a, b), Li (Reference Li2022), and Ling and Liu (Reference Ling and Liu2022) in dealing with conditional risk measures.
Assumption 2.1.
Let (X,Y) be a bivariate risk with a survival copula
 $\widehat{C}$
. Assume that the relation
 \begin{eqnarray}\widehat{C}_{2}(u,v) \sim u\widehat{C}_{12}(0+,v),\qquad u \downarrow 0,\end{eqnarray}
holds uniformly for
 $v\in [0,1]$
.
Remark 2.1.
-
(i) We remark that the uniformity is understood as:
\begin{align*}\lim_{u\downarrow 0}\sup_{v\in[0,1]}\left|\frac{\widehat{C}_2(u,v)}{u\widehat{C}_{12}(0+,v)}-1\right|=0. \end{align*}
-
(ii) Clearly, the asymptotic property is equivalent to
hold uniformly for
\begin{eqnarray*}1-C_{2}(u,v) \sim (1-u)C_{12}(1-,v),\qquad u \uparrow 1,\end{eqnarray*}
$v\in [0,1]$
.
-
(iii) By the uniformity, integrating both sides of (2.7) with respect to
$G(\mathrm{d}y)$
over the range
$[0,\infty)$
with
$v=\overline{G}(y)$
leads to
$\int_{0}^{\infty} \widehat{C}_{12}\left(0+,\overline{G}(y)\right) G(\mathrm{d}y) =1.$
Thus,
$G_h$
defined by
forms a proper distribution function of
\begin{align*}G_{h}(\mathrm{d}y) = C_{1}\left(1-,G(\mathrm{d}y)\right) = C_{12}\left(1-,G(y)\right)G(\mathrm{d}y) \end{align*}
$Y_h$
. As
$x \uparrow \hat{x}$
, by the uniformity we also have (2.8)where
\begin{eqnarray}\overline{F}_{X|Y \gt y_p}(x) &=& \frac{1}{\overline{G}(y_p)} \widehat{C}\left(\overline{F}(x),\overline{G}(y_p)\right) = \frac{1}{\overline{G}(y_p)} \left[ \int_{0}^{1-p} \widehat{C}_2\left(\overline{F}(x),v\right) \mathrm{d}v \right]_{v=\overline{G}(y)} \notag\\&\sim & \frac{\overline{F}(x)}{\overline{G}(y_p)} \left[\int_{0}^{1-p} \widehat{C}_{12}\left(0+,v\right) \mathrm{d}v \right]_{v=\overline{G}(y)} = C_p \overline{F}(x),\end{eqnarray}
$C_p=\overline{G}_h(y_p)/\overline{G}(y_p)$
.
-
(iv) Some examples of copulas satisfying Assumption 2.1 are listed here for reference.
-
(a) The Ali–Mikhail–Haq copula is of the form:
with
\begin{equation*}C(u, v)=\frac{u v}{1-r(1-u)(1-v)}, \qquad r \in({-}1,1),\end{equation*}
$\widehat{C}_{12}(0+,v)=1+r-2rv$
.
-
(b) The Farlie–Gumbel–Morgenstern (FGM) copula is of the form:
(2.9)with
\begin{align}C(u, v)=u v+ruv(1-u)(1-v), \qquad r\in({-}1,1),\end{align}
$\widehat{C}_{12}(0+,v)=1+r-2rv$
.
-
(c) The Clayton copula is of the form:
(2.10)with
\begin{align}C(u, v)=(u^{-r}+v^{-r}-1)^{-1/r}, \qquad r\in(0,\infty),\end{align}
$\widehat{C}_{12}(0+,v)=(1+r)(1-v)^r$
.
-
(d) The independent copula is of the form:
(2.11)with
\begin{align}C(u, v)=uv,\end{align}
$\widehat{C}_{12}(0+,v)=1$
.
-


2.6. On the weak contagion
The aforementioned dependence structure (2.7) is employed to model the weak contagion between risks. Bandt et al. (Reference Bandt, Hartmann and Peydró2012) define contagion risk as the component of systemic risk stemming from idiosyncratic shocks. It is also widely recognized that the interdependence between risk factors can facilitate the propagation of risk contagion. The magnitude of this interdependence under extreme adverse scenarios, also known as tail dependence, significantly impacts the degree of contagion. A common measure of tail dependence is the coefficient of upper tail dependence, which is defined to assess the probability of extreme co-movements. According to McNeil et al. (Reference McNeil, Frey and Embrechts2015), two random variables X and Y, distributed by F and G, respectively, are said to be asymptotically independent if they have a zero coefficient of (upper) tail dependence:
 \begin{align*}\lambda=\lim _{q \uparrow 1} P\left(X \gt F^{\leftarrow}(q) \mid Y \gt G^{\leftarrow}(q)\right)=0. \end{align*}
It can be verified that X and Y are asymptotically independent when following (2.7), see, for example, Lemma 3.1 of Asimit and Badescu (Reference Asimit and Badescu2010) or Section 1 of Chen and Yuen (Reference Chen and Yuen2012). Liu and Yang (Reference Liu and Yang2021) observe that even the degree of contagion arising from certain asymptotically independent risks, that is, bivariate risks following a Gaussian copula, could be relatively strong. However, in this paper, we focus on the weak contagion driven by the dependence structure (2.7).
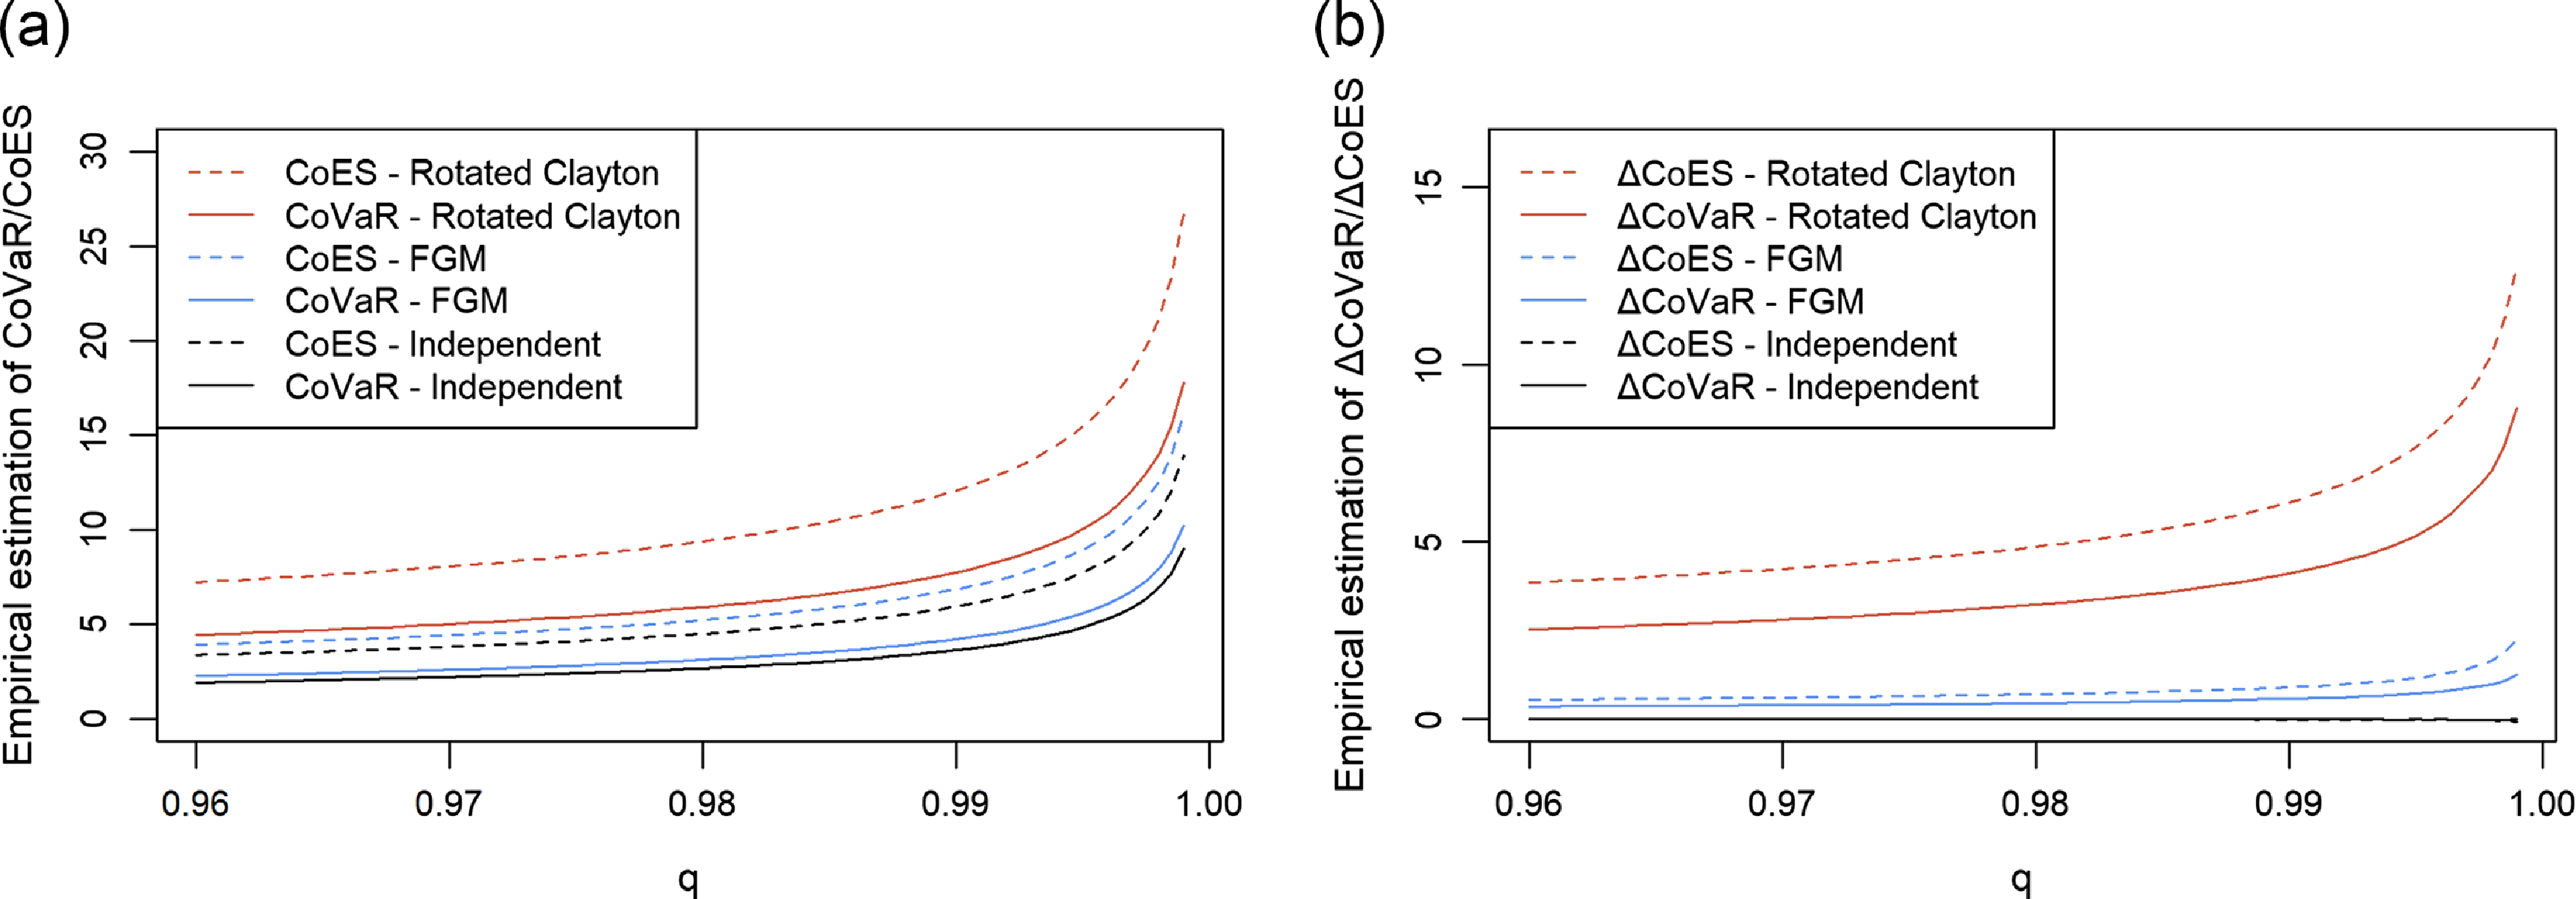
Our motivation for considering a weak contagion is several-fold. First, in good times or under normal market conditions, the contagion between risks may be a weak one; see, for example, Balla et al. (Reference Balla, Ergen and Migueis2014), Kiriliouk et al. (Reference Kiriliouk, Segers and Warchoł2016), and Abduraimova (Reference Abduraimova2022) for the empirical evidence. Second, the contagion risk usually can be mitigated by proper diversification. Moreover, the contagion between risks, albeit weak, should not be overlooked, as shown in Figure 1, where we visualize the empirical estimation for systemic risk measures,
 $\mathrm{CoVaR}_{p,q}\left(X\big|Y\right)$
,
 $\mathrm{CoES}_{p,q}\left(X\big|Y\right)$
,
 $\Delta\mathrm{CoVaR}_{p,q}\left(X\big|Y\right)$
, and
 $\Delta\mathrm{CoES}_{p,q}\left(X\big|Y\right)$
under strong and weak contagion scenarios. Choose
 $10^7$
samples of X and Y both following the Pareto distribution (4.10) with
 $\alpha=3$
and
 $\kappa=1$
. A rotated Clayton copula defined as
 $\widehat{C}(u,v)=\left(u^{-r_1}+v^{-r_1}-1 \right)^{-1/r_1}$
is assumed to represent the strong contagion, while an FGM copula (2.9) and an independent copula (2.11) are assumed to represent the weak contagion caused by the dependence structure (2.7). Although there is a gap between strong and weak contagion cases, the weak contagion arising from the dependence structure (2.7) still exists, which motivates us to quantitatively capture their tail behaviors based on the following asymptotic study.
Empirical estimation for
 $\mathrm{CoVaR}_{p,q}\left(X\big|Y\right)$
,
 $\mathrm{CoES}_{p,q}\left(X\big|Y\right)$
,
 $\Delta\mathrm{CoVaR}_{p,q}\left(X\big|Y\right)$
, and
 $\Delta\mathrm{CoES}_{p,q}\left(X\big|Y\right)$
with
 $p=0.85$
based on
 $10^7$
samples of
 $\left(X, Y \right)$
, where X and Y both follow Pareto (3,1) and are dependent via a rotated Clayton copula with parameter
 $r_1=1$
, an FGM copula with parameter
 $r_2=0.5$
, or an independent copula.

3. Main results
This section establishes asymptotics for the CoHM defined in (2.1) by considering the aforementioned assumptions, where the primary risk X belongs to the Fréchet, Gumbel, or Weibull MDA.
We first focus on the Fréchet case. Denote by
 $\mathrm{B}(\cdot,\cdot)$
the beta function, namely,
 $\mathrm{B}(a,b)=\int_0^1x^{a-1}{}(1-x)^{b-1}\,\mathrm{d}x$
with
 $a,b \gt 0$
.
Theorem 3.1.
Consider the risk measure CoHM defined in (2.1) for some
 $k\geq1$
with a bivariate risk vector
 $(X,Y).$
If Assumption 2.1 holds and
 $F \in \mathrm{MDA}\left(\Phi_{\gamma}\right)$
for some
 $\gamma \gt k$
, then as
 $q \uparrow 1,$
we have
 \begin{align}\mathrm{CoHM}_{p, q}\left(X\big|Y\right) \sim C_p^{1 / \gamma} \frac{\gamma(\gamma-k)^{(k / \gamma)-1}}{k^{(k-1) / \gamma}} \,\mathrm{B}(\gamma-k, k)^{1 / \gamma} F^{\leftarrow}(1-(1-q)^k).\end{align}
Next, we turn to the Gumbel case, in which
 $E\left[X_{+}^{k}\right] \lt \infty$
for
 $k \geq 1$
holds automatically because either
 $\hat{x} \lt \infty$
or
 $\overline{F} \in \mathcal{R}_{-\infty}(\infty)$
. Denote by
 $\Gamma({\cdot})$
the gamma function, namely,
 $\Gamma(a)=\int_0^{\infty} x^{a-1}\mathrm{e}^{-x}\,\mathrm{d}x$
with
 $a \gt 0$
.
Theorem 3.2.
Consider the risk measure CoHM defined in (2.1) for some
 $k\geq1$
with a bivariate risk vector
 $(X,Y).$
If Assumption 2.1 holds and
 $F \in \mathrm{MDA}(\Lambda)$
with
 $0 \lt \hat{x}\leq \infty$
, then as
 $q \uparrow 1,$
we have
-
(i) for
$\hat{x}=\infty$
we have (3.2)
\begin{align}\mathrm{CoHM}_{p, q}\left(X\big|Y\right) \sim F^{\leftarrow}\left(1- C_p^{-1} \frac{k^k}{\Gamma(k+1)}(1-q)^{k}\right);\end{align}
-
(ii) for
$\hat{x} \lt \infty$
we have (3.3)
\begin{align}\hat{x}-\mathrm{CoHM}_{p, q}\left(X\big|Y\right) \sim \hat{x}-F^{\leftarrow}\left(1- C_p^{-1} \frac{k^k}{\Gamma(k+1)}(1-q)^{k}\right).\end{align}


We point out that the asymptotic formula in (3.2) can be replaced by
 $F^{\leftarrow}\left(1-w_2(1-q)^k\right)$
for any
 $w_2 \gt 0$
due to
 $F^{\leftarrow}\left(1-\cdot\right) \in \mathcal{R}_{0}(0{+})$
and the asymptotic formula in (3.3) can be replaced by
 $\hat{x}-F^{\leftarrow}\left(1-w_2(1-q)^k\right)$
for any
 $w_2 \gt 0$
due to
 $\hat{x}-F^{\leftarrow}\left(1-\cdot\right) \in \mathcal{R}_{0}(0{+})$
.
Finally, we consider the Weibull case. Notice that
 $E\left[X_{+}^{k}\right] \lt \infty$
for
 $k \geq 1$
holds automatically due to
 $\hat{x} \lt \infty$
.
Theorem 3.3.
Consider the risk measure CoHM defined in (2.1) for some
 $k\geq1$
with a bivariate risk vector
 $(X,Y).$
If Assumption 2.1 holds and
 $F \in \mathrm{MDA}\left(\Psi_{\gamma}\right)$
for
 $\gamma \gt 0$
and
 $0 \lt \hat{x} \lt \infty$
, then as
 $q \uparrow 1,$
we have
 \begin{align}\hat{x}-\mathrm{CoHM}_{p, q}\left(X\big|Y\right) \sim C_p^{-1/ \gamma}\frac{\gamma k^{(k-1)/\gamma}}{(\gamma+k)^{(k/\gamma)+1}}\mathrm{B}(\gamma+1, k)^{-1/ \gamma} (\hat{x}-F^{\leftarrow}(1-(1-q)^k).\end{align}
4. Numerical illustrations
In this section, we extend our main results of the CoHM risk measure to a special case of the CoHG risk measure proposed by Xun et al. (Reference Xun, Jiang and Guo2021), which generalizes the CoES. Following the proofs of our main results, asymptotic results for the CoHG are easily derived when the primary risk X belongs to the Fréchet, Gumbel, or Weibull MDA. We then examine the accuracy of the asymptotic estimates and conduct various sensitivity tests against a certain risk parameter.
4.1. The CoHG risk measure
Recall that a normalized Young function
 $\varphi({\cdot})$
is nonnegative and convex on
 $[0,\infty)$
and satisfies
 $\varphi(0)=0$
,
 $\varphi(1)=1$
,
 $\varphi(\infty)=\infty$
.
 $L_{0}^{\varphi}$
denotes the Orlicz heart associated with the Young function
 $\varphi({\cdot})$
, defined to be
 $\{X\,:\, E\left[\varphi(c X_+)\right] \lt \infty \text { for any } c \gt 0\}$
. For a real-valued random variable
 $X \in L_{0}^{\varphi}$
, distributed by
 $F=1-\overline{F}$
on
 $\mathbb{R}$
and a parameter
 $q\in(0,1)$
, its HG risk measure is defined as:
 \begin{equation*}\mathrm{HG}_{q}(X)=\inf _{-\infty \lt x \lt \hat{x}} \left\{x+\mathrm{HG}_{q}\left((X-x)_{+}\right)\right\},\end{equation*}
where
 $\mathrm{HG}_{q}\left((X-x)_{+}\right)$
is the unique solution h to the equation:
 \begin{equation*}E\left[\varphi\left(\frac{(X-x)_{+}}{h}\right)\right]=1-q,\end{equation*}
in case
 $\overline{F}(x) \gt 0$
and
 $\mathrm{HG}_{q}\left((X-x)_{+}\right)=0$
otherwise. In this risk measure, the convexity of the Young function
 $\varphi({\cdot})$
represents the degree of risk aversion and the parameter q represents the confidence level. A straightforward extension from the HG to the CoHG is proposed by Xun et al. (Reference Xun, Jiang and Guo2021) as follows:
Definition 4.1
Given
 $X\in L_{0}^{\varphi}$
and Y, two parameters p,
 $q \in(0,1)$
, and a Young function
 $\varphi({\cdot})$
, the CoHG risk measure of X given
 $Y \gt \mathrm{VaR}_p(Y)$
is defined as:
 \begin{equation*}\mathrm{CoHG}_{p, q}\left(X\big|Y\right)=\inf _{-\infty \lt x \lt \hat{x}} \left\{x+\mathrm{HG}_{p, q}\left((X-x)_{+}\big| Y\right)\right\},\end{equation*}
where
 $\mathrm{HG}_{p, q}\left((X-x)_{+}\big| Y\right)$
is the unique solution h to the equation:
 \begin{equation*}E\left[\left. \varphi\left(\frac{(X-x)_{+}}{h}\right) \right|Y \gt y_p\right]=1-q,\end{equation*}
in case
 $P(X \gt x\big|Y \gt y_p) \gt 0$
and
 $\mathrm{HG}_{p, q}\left((X-x)_{+}\big| Y\right)=0$
otherwise, with
 $y_p=G^{\leftarrow}(p)$
.
We consider a special case that a Young function
 $\varphi(t)$
is restricted to
 $t^{k}$
for
 $k \geq 1$
. Note that, under this assumption,
 $L_{0}^{\varphi}$
and
 $L^{\varphi}$
coincide, given by
 $\{X\,:\, E[X_+^{k}] \lt \infty\}$
. Similar to the CoHM risk measure, for
 $k=1$
, the CoHG reduces to the CoES. For
 $k \gt 1$
, the CoHG risk measure is given by:
 \begin{align}\mathrm{CoHG}_{p, q}\left(X\big|Y\right)=x+\left(\frac{E\left[\left(X-x\right)_{+}^{k} \big| Y \gt y_p\right]}{1-q}\right)^{\frac{1}{k}},\end{align}
where
 $x \in\left({-}\infty, \hat{x}\right)$
is the unique solution of the equation:
 \begin{align}\frac{\left(E\left[(X-x)_{+}^{k-1}\big|Y \gt y_p\right]\right)^{k}}{\left(E\left[(X-x)_{+}^{k}\big|Y \gt y_p\right]\right)^{k-1}}=1-q.\end{align}
A numerical method has to be involved since solving Equation (4.2) for (4.1) analytically might be impossible. In that case, asymptotics for the CoHG risk measure can reduce computational complexity while ensuring accuracy. Following similar arguments from Theorems 3.1–3.3 with corresponding modifications mentioned in Section 2.2, we derive the following:
Corollary 4.1.
Consider the risk measure CoHG in Definition 4.1 with a power young function
 $\varphi(t)=t^{k}$
for
 $k \geq 1$
with a bivariate risk vector (X, Y) satisfying Assumption 2.1.
-
(a) If
$F \in \mathrm{MDA}\left(\Phi_{\gamma}\right)$
for some
$\gamma \gt k$
, then as
$q \uparrow 1$
(4.3)
\begin{align}\mathrm{CoHG}_{p, q}\left(X\big|Y\right)\sim C_p^{1 / \gamma} \frac{\gamma(\gamma-k)^{(k / \gamma)-1}}{k^{(k-1) / \gamma}} \,\mathrm{B}(\gamma-k, k)^{1 / \gamma} F^{\leftarrow}(q),\end{align}
-
(b) If
$F \in \mathrm{MDA}(\Lambda)$
with
$0 \lt \hat{x}\leq \infty$
, then as
$q \uparrow 1$
-
(i) for
$\hat{x}=\infty$
we have (4.4)
\begin{align}\mathrm{CoHG}_{p, q}\left(X\big|Y\right)\sim F^{\leftarrow}\left(1-C_p^{-1}\frac{k^{k}}{\Gamma(k+1)}(1-q)\right);\end{align}
-
(ii) for
$\hat{x} \lt \infty$
we have (4.5)
\begin{align}\hat{x}-\mathrm{CoHG}_{p, q}\left(X\big|Y\right)\sim \hat{x}-F^{\leftarrow}\left(1-C_p^{-1} \frac{k^{k}}{\Gamma(k+1)}(1-q)\right).\end{align}
-
-
(c) If
$F \in \mathrm{MDA}\left(\Psi_{\gamma}\right)$
for
$\gamma \gt 0$
and
$0 \lt \hat{x} \lt \infty$
, then as
$q \uparrow 1$
(4.6)
\begin{align}\hat{x}-\mathrm{CoHG}_{p, q}\left(X\big|Y\right) \sim C_p^{-1/ \gamma}\frac{\gamma k^{(k-1)/\gamma}}{(\gamma+k)^{(k/\gamma)+1}\mathrm{B}(\gamma+1, k)^{-1/ \gamma} } (\hat{x}-F^{\leftarrow}(q)).\end{align}


In the remaining parts of this section, we first examine the accuracy of the asymptotic estimates obtained from (4.3)–(4.6) and then conduct sensitivity tests. Under the specification of bivariate risks (X, Y) satisfying Assumption 2.1 via an FGM copula in (2.9) with
 $r\in ({-}1,1)$
, the following relations are useful for calculating exact and asymptotic values:
 \begin{align}&\!\!\!\!\!\!\!\!\!\!\!\!\!\!\!\!\!\!\!\!\! P(X \gt x\big|Y \gt y_p)=\overline{F}(x)\cdot (1+rpF(x)), \\[-25pt] \nonumber \end{align}
 \begin{align}&\!\!\!P(X=x\big|Y \gt y_p)= f(x)\cdot (rp-1-2rpF(x)),\\[-25pt]\nonumber\end{align}
 \begin{align}&P(Y_h \gt y_p) = 1-p+rp-rp^{2} =(1-p)(rp+1).\end{align}
4.2. Examination of accuracy
For the first task, we compare the asymptotic estimates with their corresponding exact values. For this purpose, denote by
 $\mathrm{\widetilde{CoHG}}_{p,q}\left(X\big|Y\right)$
the asymptotic results for
 $\mathrm{CoHG}_{p,q}\left(X\big|Y\right)$
obtained in Corollary 4.1. The relative error between
 $\mathrm{\widetilde{CoHG}}_{p,q}\left(X\big|Y\right)$
and
 $\mathrm{CoHG}_{p,q}\left(X\big|Y\right)$
can be expressed by:
 \begin{align*}\frac{\left| \mathrm{CoHG}_{p,q}\left(X\big|Y\right)-\mathrm{\widetilde{CoHG}}_{p,q}\left(X\big|Y\right) \right|}{\mathrm{CoHG}_{p,q}\left(X\big|Y\right)}\,=\!:\,r(q). \end{align*}
Example 4.1. (The Fréchet case) Assume X follows a Pareto distribution:
 \begin{align}F(x) = 1-\left(\frac{\kappa}{\kappa+x}\right)^{\alpha}, \quad x, \alpha,\kappa \gt 0,\end{align}
indicating that
 $F \in \mathrm{MDA}\left(\Phi_{\gamma}\right)$
with
 $\gamma = \alpha$
. On the one hand, we start the computation of the exact value from the left-hand side of Equation (4.2). By applying (4.7), we see that
 \begin{align*}\begin{aligned}\frac{\left(E\left[(X-x)_{+}^{k-1}\big|Y \gt y_p\right]\right)^{k}}{\left(E\left[(X-x)_{+}^{k}\big|Y \gt y_p\right]\right)^{k-1}} &= \frac{\left( \int_{x}^{\infty} (k-1)(z-x)^{k-2} \cdot P(X \gt z\big|Y \gt y_p) \,\mathrm{d}z \right)^{k}}{\left(\int_{x}^{\infty} k(z-x)^{k-1} \cdot P(X \gt z\big|Y \gt y_p) \,\mathrm{d}z \right)^{k-1}} \\&= \frac{\left( \int_{x}^{\infty} (k-1)(z-x)^{k-2} \cdot \overline{F}(z)(1+rpF(z)) \,\mathrm{d}z \right)^{k}}{\left(\int_{x}^{\infty} k(z-x)^{k-1} \cdot \overline{F}(z)(1+rpF(z)) \,\mathrm{d}z \right)^{k-1}}.\end{aligned} \end{align*}
We then solve (4.2) by vpasolve and plug the solution into (4.1) to have the exact value of
 $\mathrm{CoHG}_{p,q}\left(X\big|Y\right)$
. On the other hand, we use Corollary 4.1 (a) together with (4.9) to approximate it asymptotically.
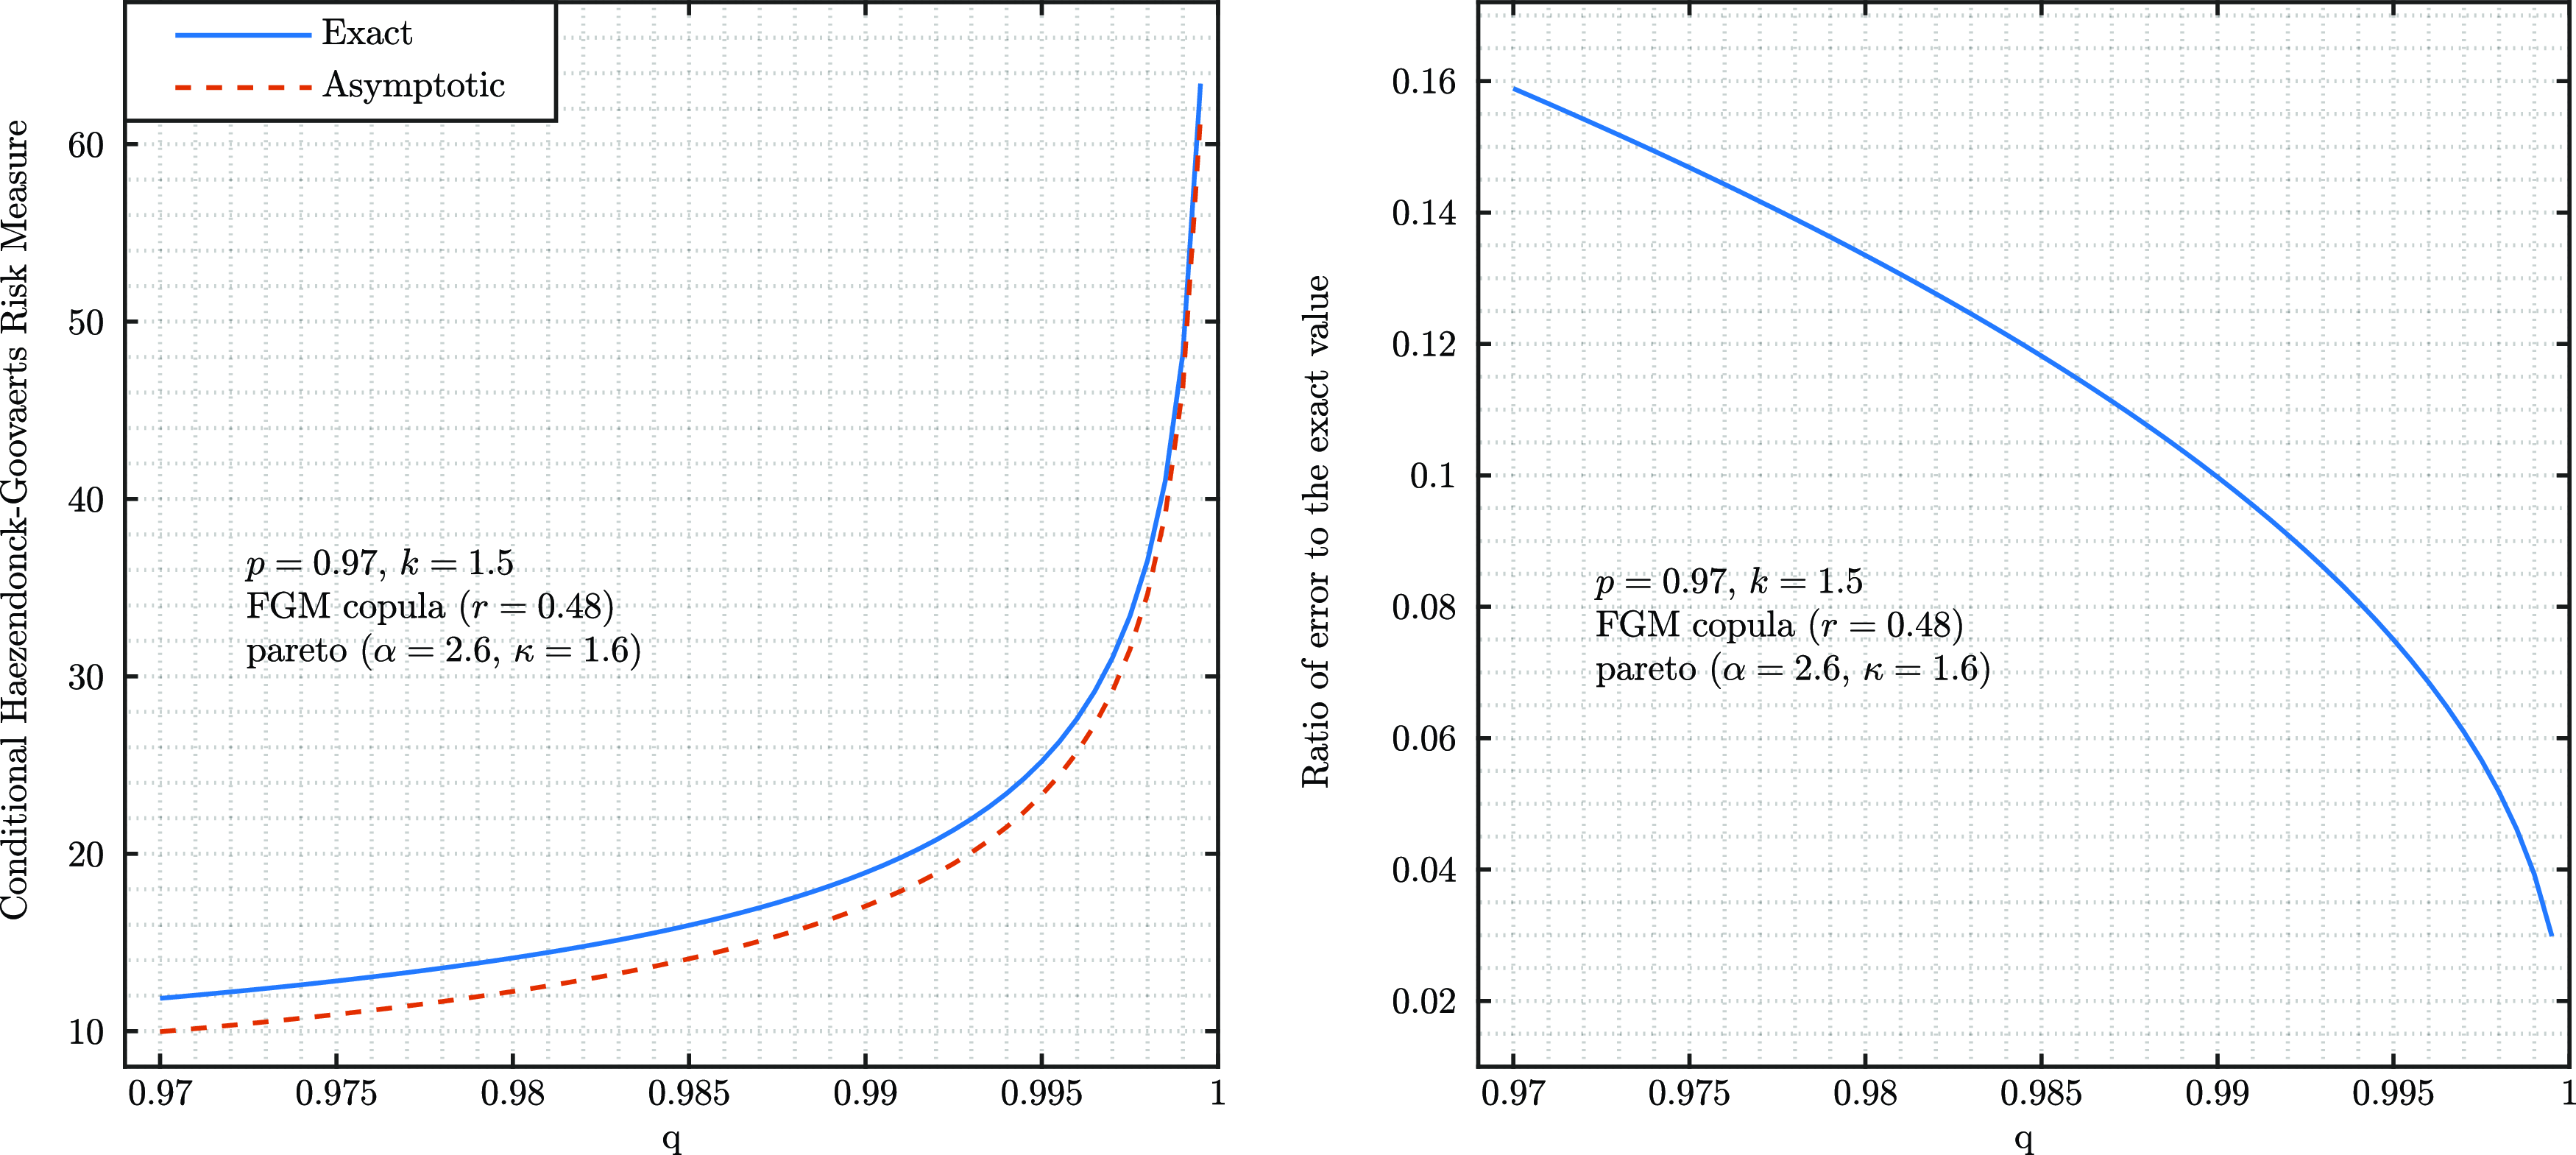
Figure 2 shows that the relative error r(q) converges to 0 as
 $q \uparrow 1$
, indicating the asymptotic results are more accurate at a high confidence level.
Comparison of the asymptotic values with the exact values of
 $\mathrm{CoHG}_{p,q}\left(X\big|Y\right)$
and the relative errors r(q) in Example 4.1.

Example 4.2 (The Gumbel case) Assume X follows a lognormal distribution:
 \begin{align*}f(x)=\frac{1}{\sqrt{2 \pi} \sigma x} \exp \left\{-\frac{(\ln x-\mu)^{2}}{2 \sigma^{2}}\right\},\quad x \gt 0, \mu\in\mathbb{R}, \sigma \gt 0, \end{align*}
or it can be alternatively written as
 $F(x)=N\left((\mathrm{ln}\,x-\mu)/\sigma\right)$
. Notice that the auxiliary function is given by:
 \begin{align*}a(x)=\frac{\overline{N}\left((\mathrm{ln}x-\mu)/\sigma \right)\sigma x}{N^{\prime}\left((\mathrm{ln}x-\mu)/\sigma \right)}. \end{align*}
 $N({\cdot})$
is the standard normal distribution function and
 $N^{\prime}({\cdot})$
is its corresponding density function; see details in Page 150 of Embrechts et al. (Reference Embrechts, Mikosch and Klüppelberg1997). On the one hand, we can compute the solution of (4.2) by vpasolve in the same way as in the Fréchet case and substitute it into (4.1) to get the exact value of
 $ \mathrm{CoHG}_{p,q}\left(X\big|Y\right)$
. On the other hand, similar to (A.9) and (A.10), we obtain
 \begin{align}\mathrm{CoHG}_{p, q}\left(X\big|Y\right)-x =\left(\frac{E\left[\left(X-x\right)_{+}^{k} \big| Y \gt y_p\right]}{1-q}\right)^{1/k} \sim ka(x),\end{align}
and
 \begin{eqnarray}x & \sim & F^{\leftarrow}\left(1-C_p^{-1} \frac{k^{k}}{\Gamma(k+1)}(1-q)\right).\end{eqnarray}
We then use (4.9), (4.11), and (4.12) to asymptotically approximate
 $x+ka(x)$
.
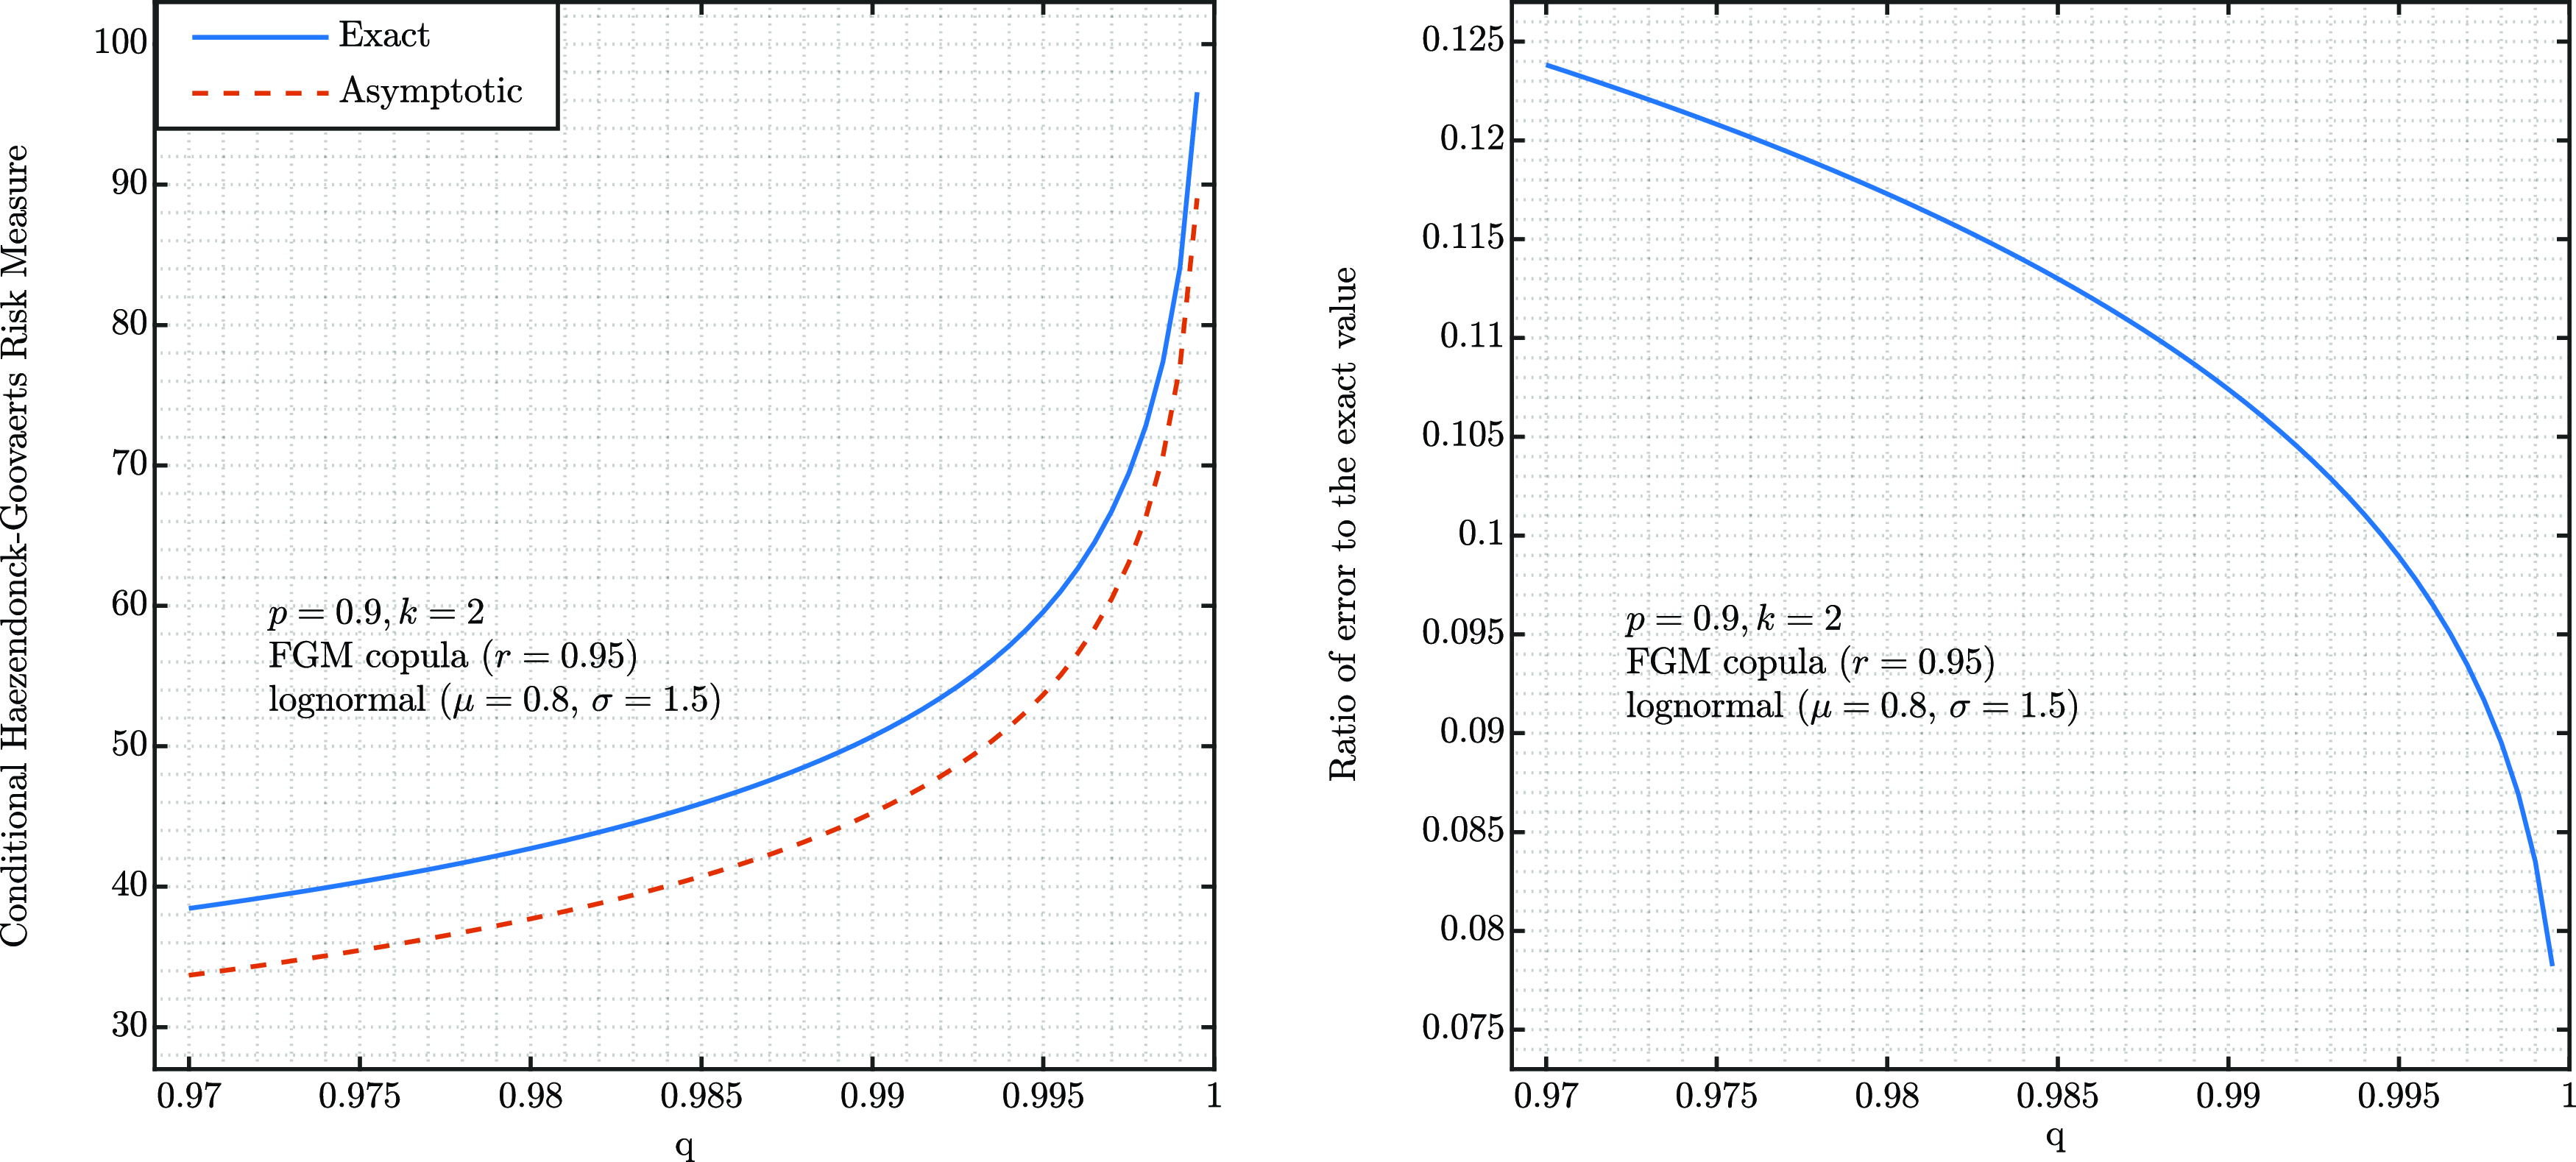
Figure 3 presents that the relative error r(q) also converges to 0 as
 $q \uparrow 1$
, which implies that the asymptotic results are more accurate at a high confidence level.
Comparison of the asymptotic values with the exact values of
 $\mathrm{CoHG}_{p,q}\left(X\big|Y\right)$
and the relative errors r(q) in Example 4.2.

Example 4.3 (The Weibull case) Assume X follows a beta distribution:
 \begin{align*}f(x)=\frac{x^{a-1}(1-x)^{b-1}}{\mathrm{B}(a,b)}, \quad 0 \lt x \lt 1, a,b \gt 0, \end{align*}
indicating that
 $F \in \mathrm{MDA}(\Lambda)$
with
 $\gamma = b$
. On the one hand, we start the computation of the exact value from the left-hand side of (4.2). By applying (4.8), we see that
 \begin{align*}\begin{aligned}\frac{\left(E\left[(X-x)_{+}^{k-1}\big|Y \gt y_p\right]\right)^{k}}{\left(E\left[(X-x)_{+}^{k}\big|Y \gt y_p\right]\right)^{k-1}} &= \frac{\left(\int_{x}^{1} (z-x)^{k-1} \cdot P(X=z\big|Y \gt y_p) \,\mathrm{d}z \right)^{k}}{\left(\int_{x}^{1} (z-x)^{k} \cdot P(X=z\big|Y \gt y_p) \,\mathrm{d}z \right)^{k-1}} \\&= \frac{\left(\int_{x}^{1} (z-x)^{k-1} \cdot f(z)(rp-1-2rpF(z)) \,\mathrm{d}z \right)^{k}}{\left(\int_{x}^{1} (z-x)^{k} \cdot f(z)(rp-1-2rpF(z)) \,\mathrm{d}z \right)^{k-1}}.\end{aligned} \end{align*}
We then solve (4.2) by vpasolve and plug the solution into (4.1) to have the exact value of
 $\hat{x}-\mathrm{CoHG}_{p,q}\left(X\big|Y\right)$
. On the other hand, we use Corollary 4.1 (c) together with (4.9) to approximate it asymptotically.
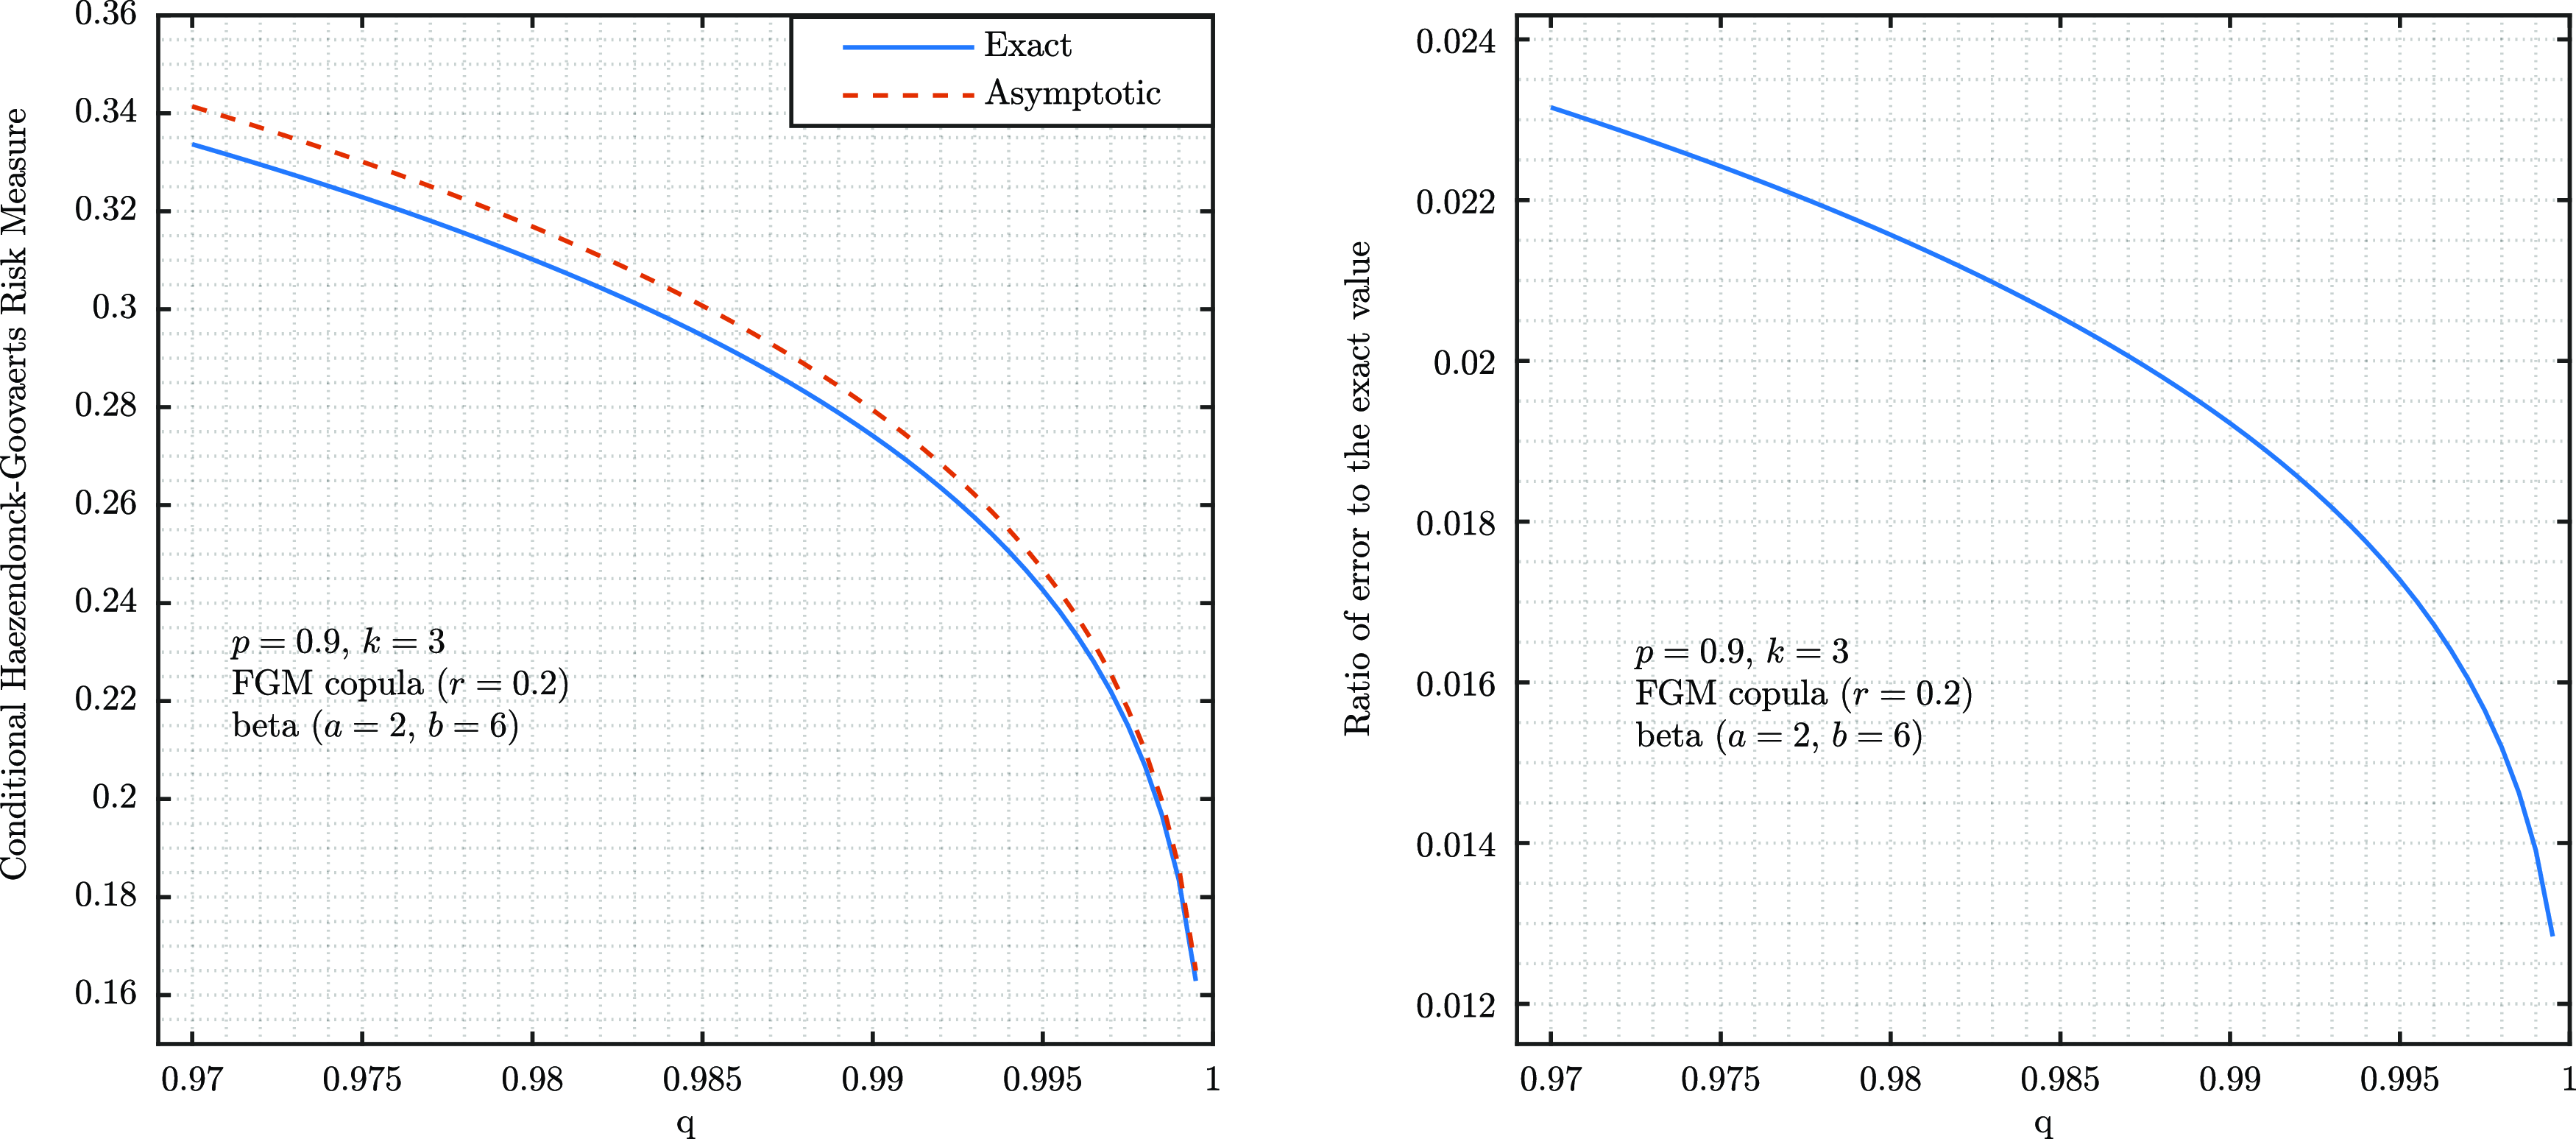
In Figure 4
, the relative error r(q) still converges to 0 as
 $q \uparrow 1$
, which reveals that the asymptotic results are more accurate at a high confidence level.
Comparison of the asymptotic values with the exact values of
 $\mathrm{CoHG}_{p,q}\left(X\big|Y\right)$
and the relative errors r(q) in Example 4.3.

4.3. Sensitivity tests
In the spirit of some risk contribution measures such as the
 $\Delta \mathrm{CoVaR}$
in Adrian and Brunnermeier (Reference Adrian and Brunnermeier2016) and the
 $\Delta \mathrm{CoES}$
in Fang and Li (Reference Fang and Li2018) and Sordo et al. (Reference Sordo, Bello and Suárez-Llorens2018), Xun et al. (Reference Xun, Jiang and Guo2021) define the risk contribution of a given CoHG risk measure as:
 \begin{align*}\Delta \mathrm{CoHG}_{p,q}\left(X\big|Y\right) = \mathrm{CoHG}_{p,q}\left(X\big|Y\right) - \mathrm{HG}_{q}\left(X\right), \qquad p,q \in (0,1). \end{align*}
For the second task, we conduct sensitivity tests of asymptotic estimate for the
 $\Delta \mathrm{CoHG}$
, denoted by
 $\widetilde{\Delta \mathrm{CoHG}}_{p,q}\left(X\big|Y\right)=\mathrm{\widetilde{CoHG}}_{p,q}\left(X\big|Y\right)-\mathrm{\widetilde{HG}}_{q}\left(X\right)$
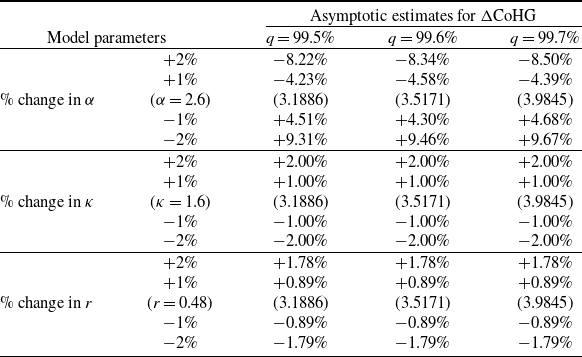
, which is based on the asymptotic estimates for the CoHG in Corollary 4.1 and that of the HG in Theorems 4.1–4.3 of Tang and Yang (Reference Tang and Yang2012). Table 1 summarizes percentage changes in the risk contribution
 $\widetilde{\Delta \mathrm{CoHG}}$
with respect to percentage changes in the parameters
 $\alpha$
,
 $\kappa$
in a Pareto distribution given by (4.10), and r in an FGM copula of form (2.9) for
 $q = 99.5\%, 99.6\%$
and
 $99.7\%$
, respectively. We set
 $\alpha=2.6$
,
 $ \kappa=1.6$
, and
 $r=0.48$
as the benchmark. Other parameters are consistent with Example 4.1. The table shows that the risk contribution
 $\widetilde{\Delta \mathrm{CoHG}}$
increases as
 $\alpha$
decreases or as
 $\kappa$
increases, which is expected due to the heavier tail of the primary risk X. Additionally, it can be seen that the
 $\widetilde{\Delta \mathrm{CoHG}}$
increases as r increases due to a stronger positive dependency between X and Y. On the other hand, it shows that the sensitivity of the
 $\widetilde{\Delta \mathrm{CoHG}}$
to
 $\kappa$
and r remains unchanged for different levels of q, but the
 $\widetilde{\Delta \mathrm{CoHG}}$
is increasingly sensitive to changes in
 $\alpha$
as q increases, since in this example, changes in
 $\alpha$
affect the
 $(1-q)^{-1/\alpha}$
component in the
 $\widetilde{\Delta \mathrm{CoHG}}$
, which is predictable from the asymptotic results.
Sensitivity tests on
 $\widetilde{\Delta \mathrm{CoHG}}_{p,q}\left(X\big|Y\right)$
with
 $k=1.5$
and
 $p=0.97$
against
 $\alpha $
,
 $\kappa$
, and r (with the benchmark
 $\alpha=2.6$
,
 $\kappa=1.6$
, and
 $r=0.48$
), where the asymptotic estimate is based on Corollary 4.1 and Theorems 4.1–4.3 of Tang and Yang (Reference Tang and Yang2012).

5. Refinements and simulation study
In this section, we perform simulation to briefly examine the finite sample performance of two different estimators for the CoHM risk measure when F is in the Fréchet MDA. In doing so, we can calculate the exact value of
 $\mathrm{CoHM}_{p,q}\left(X\big|Y\right)$
similarly in Example 4.1.
Based on a random sample
 $(X_1,Y_1)$
,
 $\ldots$
,
 $(X_n,Y_n)$
, we now construct the estimation of
 $\mathrm{CoHM}_{p,q}\left(X\big|Y\right)$
, where
 $q = q(n) \rightarrow 1$
as
 $n \rightarrow \infty$
in two approaches. A natural nonparametric estimator based on (2.3) and (2.4) is
 \begin{align*}\mathrm{\widehat{CoHM}}^{emp}_{p,q}\left(X\big|Y\right) = \hat{x}^{\ast}+\frac{1}{1-q} \left( \frac{1}{n-\lfloor np \rfloor} \sum_{i=1}^n \left(X_i-\hat{x}^{\ast}\right)_{+}^k 1_{\left(Y_i \gt Y_{\lfloor np \rfloor, n}\right)} \right)^{1/k}, \end{align*}
where
 $\hat{x}^{\ast}$
, the empirical estimator for
 $x^{\ast}$
, is the unique solution to the empirical equation:
 \begin{align*}\frac{\left(\frac{1}{n-\lfloor np \rfloor} \sum_{i=1}^n \left(X_i-\hat{x}^{\ast}\right)_{+}^{k-1} 1_{\left(Y_i \gt Y_{\lfloor np \rfloor, n}\right)}\right)^{\frac{1}{k-1}}}{\left(\frac{1}{n-\lfloor np \rfloor} \sum_{i=1}^n \left(X_i-\hat{x}^{\ast}\right)_{+}^k 1_{\left(Y_i \gt Y_{\lfloor np \rfloor, n}\right)}\right)^{\frac{1}{k}}}=(1-q)^{\frac{1}{k-1}}. \end{align*}
Here,
 $Y_{1, n} \leq Y_{2, n} \leq \cdots \leq Y_{n, n}$
are the order statistics of
 $\left\{Y_1, Y_2, \ldots, Y_n\right\}$
. Alternatively, exploiting the asymptotics in Theorem 3.1, we propose another estimator of
 $\mathrm{CoHM}_{p,q}\left(X\big|Y\right)$
via an extrapolation. This is an analog of the estimation of extreme quantiles in Chapter 4 of de Haan and Ferreira (Reference de Haan and Ferreira2006). More precisely, with
 $m =m(n)$
a sequence such that
 $m \rightarrow \infty$
and
 $\frac{m}{n} \rightarrow 0$
as
 $n \rightarrow \infty$
, by (3.1) we have
 \begin{align*}\mathrm{CoHM}_{p,q}\left(X\big|Y\right) \sim \left( \frac{m}{n(1-q)} \right)^\frac{k}{\gamma} \mathrm{CoHM}_{p,1-\frac{m}{n}}\left(X\big|Y\right). \end{align*}
Thus, we estimate
 $\mathrm{CoHM}_{p,q}\left(X\big|Y\right)$
by extrapolating the nonparametric estimator at level
 $(1-\frac{m}{n})$
to level q as
 $n \rightarrow \infty$
,
 \begin{align*}\mathrm{\widehat{CoHM}}_{p,q}\left(X\big|Y\right) =\left( \frac{m}{n(1-q)} \right)^\frac{k}{\hat{\gamma}} \mathrm{\widehat{CoHM}}^{emp}_{p,1-\frac{m}{n}}\left(X\big|Y\right). \end{align*}
where
 $\hat{\gamma}$
is the Hill estimator for
 $\gamma$
, namely
 \begin{align*}\hat{\gamma}=\frac{1}{m_1} \sum_{i=1}^{m_1} \log X_{n-i+1, n}-\log X_{n-m_1, n} \end{align*}
with an intermediate sequence
 $m_1=m_1(n) \rightarrow \infty$
and
 $\frac{m_1}{n} \rightarrow 0$
as
 $n \rightarrow \infty$
.
Similar to Example 4.1, we assume both X and Y follow the Pareto distribution given by (4.10) and they are dependent via the FGM copula of form (2.9) with parameter
 $r_3$
or the Clayton copula of form (2.10) with parameter
 $r_4$
. We conduct 1000 replications with the sample size
 $n=500,000$
. By adjusting
 $k=1.35$
,
 $1.5$
,
 $1.65$
, and
 $1.8$
in both examples, we compute the estimators
 $\mathrm{\widehat{CoHM}}^{emp}_{p,q}\left(X\big|Y\right)$
for
 $q=99.9\%$
and
 $\mathrm{\widehat{CoHM}}_{p,q}\left(X\big|Y\right)$
for different
 $q=99.9\%$
,
 $99.98\%$
, and
 $99.99\%$
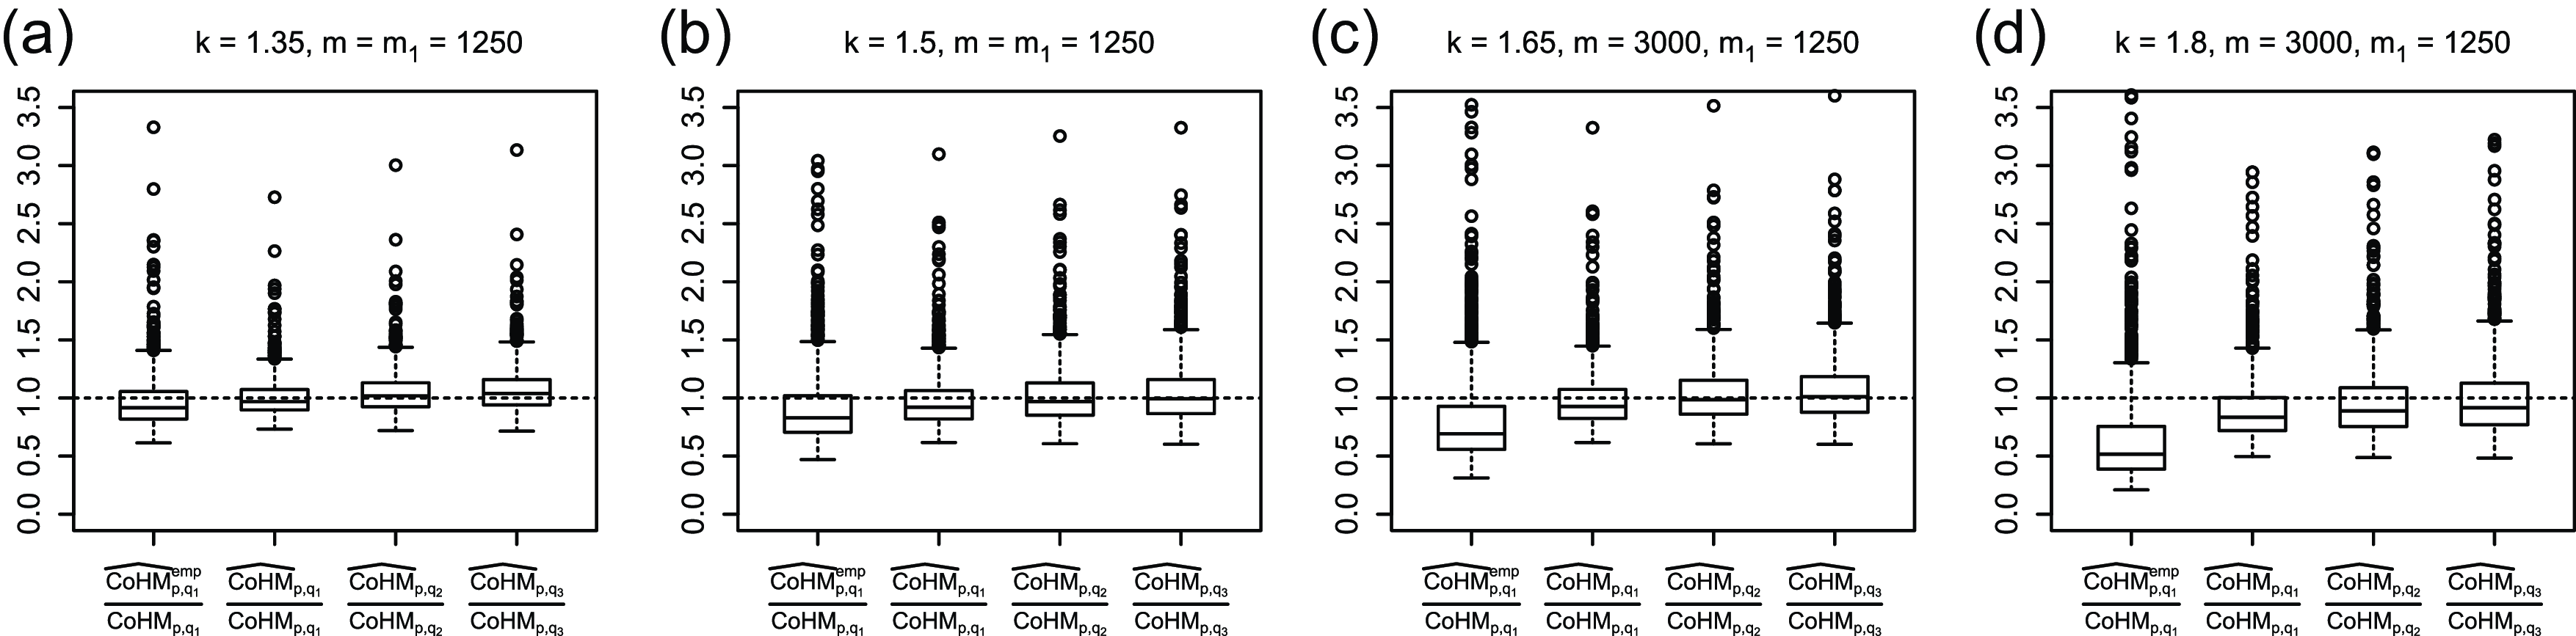
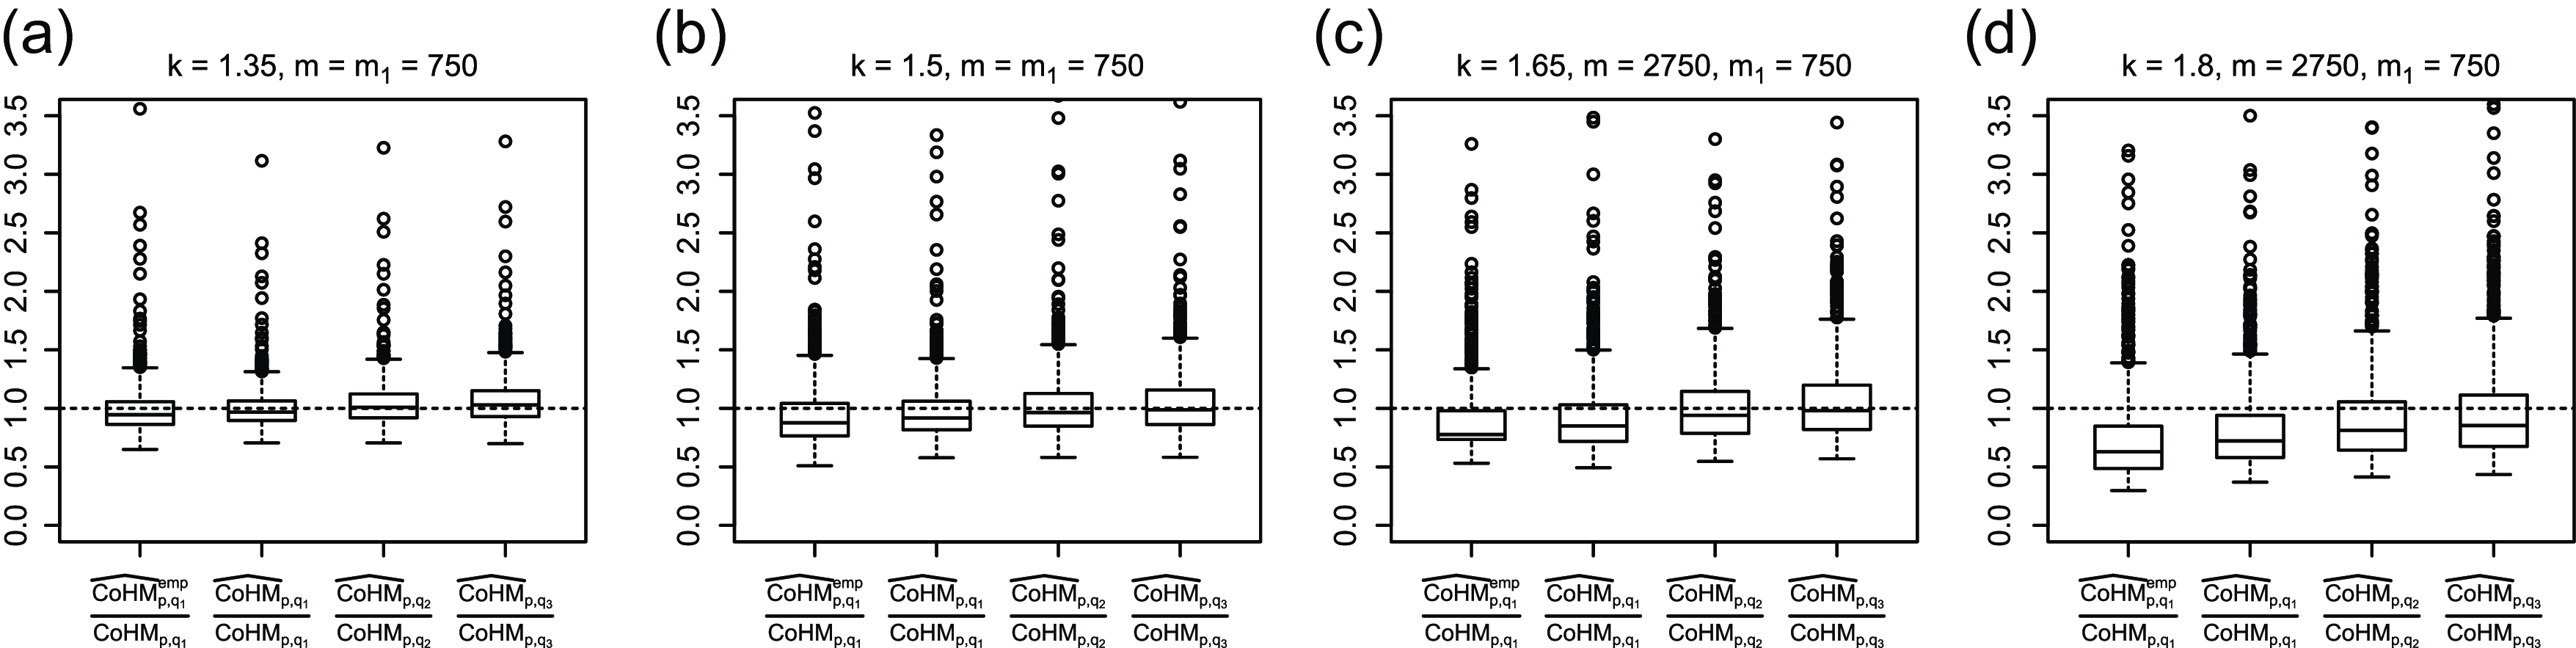
correspondingly. The comparison of the estimators is shown in Figure 5 for the FGM copula and in Figure 6 for the Clayton copula, with boxplots of the ratios of the estimates and the exact values. In all cases of different values of k, our estimator
 $\mathrm{\widehat{CoHM}}_{p,q_1}\left(X\big|Y\right)$
using extrapolation outperforms the empirical estimator
 $\mathrm{\widehat{CoHM}}^{emp}_{p,q_1}\left(X\big|Y\right)$
at level
 $q_1= 99.9\%$
as it has a smaller variance and similar or even smaller bias. When the confidence level q becomes extreme, our estimator
 $\mathrm{\widehat{CoHM}}_{p,q_1}\left(X\big|Y\right)$
still provides good performance with relatively stable behavior.
(X,Y) follows an FGM copula with identical Pareto marginals (
 $r_3=0.48$
,
 $\alpha=2.2$
,
 $\kappa=1.2$
,
 $p=0.01$
). Boxplot of ratios of estimates and exact values with
 $k=1.35$
,
 $1.5$
,
 $1.65$
, and
 $1.8$
at level
 $q_1=99.9\%$
,
 $q_2=99.98\%$
, and
 $q_3=99.99\%$
.

(X,Y) follows a Clayton copula with identical Pareto marginals (
 $r_4=1$
,
 $\alpha=2.5$
,
 $\kappa=1$
,
 $p=0.01$
). Boxplot of ratios of estimates and exact values with
 $k=1.35$
,
 $1.5$
,
 $1.65$
, and
 $1.8$
at level
 $q_1=99.9\%$
,
 $q_2=99.98\%$
, and
 $q_3=99.99\%$
.

6. Concluding remarks
In this paper, we conduct an asymptotic study of the CoHM coherent risk measure in the presence of extreme risks under the weak contagion. As our main results, we derive the following asymptotic relations as the underlying confidence level becomes high:
-
• If F is in the Fréchet MDA,
$\mathrm{CoHM}_{p, q}(X|Y) \sim w_{1} F^{\leftarrow}\left(1- (1-q)^{k}\right)$
; -
• If F is in the Gumbel MDA,
$\mathrm{CoHM}_{p, q}(X|Y)\sim F^{\leftarrow}\left(1- w_{2} (1-q)^{k}\right)$
provided
$\hat{x}=\infty$
or
$\hat{x}-\mathrm{CoHM}_{p, q}(X|Y) \sim \hat{x}-F^{\leftarrow}\left(1- w_{2}(1-q)^{k}\right)$
provided
$\hat{x} \lt \infty$
; -
• If F is in the Weibull MDA,
$\hat{x}-\mathrm{CoHM}_{p, q}(X|Y) \sim w_{3}\left(\hat{x}-F^{\leftarrow}\left(1-(1-q)^{k}\right)\right).$


The coefficients
 $w_{1}, w_{2}$
, and
 $w_{3}$
are explicitly given in Theorems 3.1–3.3. We conclude from above that the heavier the tail of the primary risk X, the faster
 $\mathrm{CoHM}_{p, q}(X|Y)$
will approach
 $\infty$
(for unbounded risk) or
 $\widehat{x}$
(for bounded risk): When F is unbounded,
 $\mathrm{CoHM}_{p, q}(X|Y)$
goes to
 $\infty$
as
 $q \uparrow 1$
and is asymptotically proportional to
 $F^{\leftarrow}\left(1-(1-q)^{k}\right)$
, which is regularly varying with index
 $-1/\gamma$
in the Fréchet case and is slowly varying in the Gumbel case. When F is bounded,
 $\hat{x}-\mathrm{CoHM}_{p, q}(X|Y)$
decays to 0 as
 $q \uparrow 1$
and is asymptotically proportional to
 $\hat{x}-F^{\leftarrow}\left(1- (1-q)^{k}\right)$
, which is slowly varying in the Gumbel case and is regularly varying with index
 $1/\gamma$
in the Weibull case. Moreover, the asymptotic proportionality constants
 $w_1$
and
 $w_3$
depend not only on the marginal distribution of X but also on the dependence structure of two risks. The above results can be further extended to the approximation of the CoHG risk measure under the high confidence level, with accuracy examined by numerical examples. As an application, we also demonstrate through the numerical examples that the asymptotic approximation can be easily applied to the sensitivity test of the risk contribution based on the HG risk measure. A simulation and comparison study is implemented to investigate the finite sample performance of our estimator using an extrapolation based on the asymptotic relation when the primary risk X belongs to the Fréchet MDA.
The following three extensions of our work are desired. The first is the case of the strong contagion, where an ideal modeling framework would be the multivariate regular variation that integrates heavy-tailedness and tail dependence. The second extension is to study the convolution-based risk measure, for example, see, Theorem 1 of Krokhmal (Reference Krokhmal2007), which is a general case of the CoHM risk measure. The convolution-based risk measure promises an important role in both stochastic optimization and risk management. An asymptotic study of such convolution-based risk measures would be very interesting by applying a unified approach covering the Fréchet, Gumbel, and Weibull MDA. The work of Tang and Yang (Reference Tang and Yang2014) sheds some light on research in this direction. In addition, for the estimator of the CoHM risk measure via an extrapolation we proposed in Section 5, we remark that its statistical properties including consistency and asymptotic normality could be further studied in a future project.
Acknowledgments
The authors would like to sincerely thank the editor and two anonymous referees for their careful reading and valuable comments, which have helped significantly improve the quality of the manuscript. The research of Jiajun Liu was supported by the National Natural Science Foundation of China (NSFC: 12201507; 72171055) and the XJTLU Research Enhancement Fund (REF-22-02-003). The research of Qingxin Yi was supported by the XJTLU Postgraduate Research Scholarship (PGRS2012012).
A. Appendix
A.1 Lemmas
The elementary result below stems from Lemma 3.1 (b) of Tang and Yang (Reference Tang and Yang2012).
Lemma A.1 Let F on
 $\mathbb{R}$
belong to the max-domain of attraction of a non-degenerate distribution function. Then
 $\overline{F}\left(F^{\leftarrow}(q)\right) \sim 1-q$
as
 $q \uparrow 1$
.
The following Potter’s bounds are restated from Theorem 1.5.6 of Bingham et al. (Reference Bingham, Goldie, Teugels and Teugels1989).
Lemma A.2 Let
 $f({\cdot}) \in \mathcal{R}_{\alpha}\left(x_{0}\right)$
with
 $x_{0}=0+$
or
 $\infty$
and
 $\alpha \in \mathbb{R}$
. For all x, y sufficiently close to
 $x_{0}$
, it holds for arbitrary
 $0 \lt \varepsilon \lt 1$
that
 \begin{equation*}(1-\varepsilon)\left(\left(\frac{y}{x}\right)^{\alpha+\varepsilon} \wedge\left(\frac{y}{x}\right)^{\alpha-\varepsilon}\right) \leq\, \frac{f(y)}{f(x)} \leq(1+\varepsilon)\left(\left(\frac{y}{x}\right)^{\alpha+\varepsilon} \vee \left(\frac{y}{x}\right)^{\alpha-\varepsilon}\right).\end{equation*}
The following lemma is a useful inequality in the Gumbel case; see Proposition 1.1 of Davis and Resnick (Reference Davis and Resnick1988) and Lemma 3.4 in Tang and Yang (Reference Tang and Yang2012).
Lemma A.3 Let
 $F \in \mathrm{MDA}(\Lambda)$
with the representation (2.6). Then, for arbitrary
 $0 \lt \varepsilon \lt 1$
, there is some
 $x_0 \lt \hat{x}$
such that, for all
 $x_0 \lt x \lt \hat{x}$
and all
 $z\geq0$
,
 \begin{equation*}\frac{\overline{F}(x+za(x))}{\overline{F}(x)} \leq (1+\varepsilon)\left(1+\varepsilon z\right)^{-1/\varepsilon}.\end{equation*}
The following lemma is copied from Proposition 0.8(V) of Resnick (Reference Resnick1987).
Lemma A.4 Let
 $f({\cdot})$
be a non-decreasing function on
 $\mathbb{R}_{+}$
with
 $f(\infty)=\infty$
. Then
 $f({\cdot})\in \mathcal{R}_{\alpha}(\infty)$
with
 $0\leq\alpha\leq\infty$
if and only if
 $f^{\leftarrow}({\cdot})\in \mathcal{R}_{1/\alpha}(\infty)$
, where we follow the conventions
 $1/0=\infty$
and
 $1/\infty=0$
.
The next lemma is proved by applying the above lemma to the distribution function F.
Lemma A.5 Let F be a distribution function on
 $\mathbb{R}$
with
 $0\leq\gamma\leq\infty$
. Then
-
(i)
$\overline{F}({\cdot}) \in \mathcal{R}_{-\gamma}(\infty)$
if and only if
$F^{\leftarrow}(1-\cdot) \in \mathcal{R}_{-1/\gamma}(0{+})$
; -
(ii)
$\overline{F}(\hat{x}-\cdot) \in \mathcal{R}_{\gamma}(0{+})$
if and only if
$\hat{x}-F^{\leftarrow}(1-\cdot) \in \mathcal{R}_{1/\gamma}(0{+})$
.


Proof. (i) With
 $U({\cdot})=1/\overline{F}({\cdot})$
, we apply Lemma A.4 and get
 \begin{eqnarray*}\overline{F}({\cdot}) \in \mathcal{R}_{-\gamma}(\infty) & \Longleftrightarrow & U({\cdot}) \in \mathcal{R}_{\gamma}(\infty) \\&\Longleftrightarrow& U^{\leftarrow}({\cdot})=F^{\leftarrow}\left(1-({\cdot})^{-1}\right) \in \mathcal{R}_{1 / \gamma}(\infty) \\&\Longleftrightarrow& F^{\leftarrow}(1-\cdot) \in \mathcal{R}_{-1 / \gamma}(0{+}).\end{eqnarray*}
(ii) can be proved similarly with
 $U({\cdot})=1/\overline{F}(\hat{x}-({\cdot})^{-1})$
.
Lemma A.6 Consider the risk measure defined in (2.1) for some
 $k \geq 1$
with a bivariate risk vector (X,Y) satisfying Assumption 2.1 with
 $X\in L^{k},$
 $p,q \in (0,1),$
and
 $x \lt \hat{x}\leq\infty.$
Then
 $q \uparrow 1$
if and only if
 $x \uparrow \hat{x}$
.
Proof. (i) For the case
 $k=1$
, we start from (2.2) with
 $x=F^{\leftarrow}_{X|Y \gt y_p}(q)$
. For tail-equivalent F and
 $F_{X |Y \gt y_p}$
, as stated in Page 129 of Embrechts et al. (Reference Embrechts, Mikosch and Klüppelberg1997),
 $F_{X |Y \gt y_p} \in \mathrm{MDA}(H)$
if and only if
 $F \in \mathrm{MDA}(H)$
. Thus, by Lemma A.1 first, and then by (2.8), we have
 \begin{align} 1-q \sim \overline{F}_{X |Y \gt y_p}(x) \sim C_p\overline{F}(x),\end{align}
from which the equivalence of
 $q \uparrow 1$
and
 $x \uparrow \hat{x}$
is verified.
(ii) Now, consider the case that
 $k \gt 1$
. By the left-hand side of (2.4),
 \begin{eqnarray*}\frac{\left(E\left[(X-x)_{+}^{k-1}\big|Y \gt y_p\right]\right)^{k}}{\left(E\left[(X-x)_{+}^{k}\big|Y \gt y_p\right]\right)^{k-1}} &=& \frac{\left(E\left[(X-x)_{+}^{k-1}1_{(X \gt x)}\big|Y \gt y_p\right]\right)^{k}}{\left(E\left[(X-x)_{+}^{k}\big|Y \gt y_p\right]\right)^{k-1}} \\& \leq & \frac{\left(E\left[(X-x)_{+}^{k}\big|Y \gt y_p\right]\right)^{k-1} E\left[1_{(X \gt x)}\big|Y \gt y_p\right]}{\left(E\left[(X-x)_{+}^{k}\big|Y \gt y_p\right]\right)^{k-1}} \\&=& \overline{F}_{X |Y \gt y_p}(x),\end{eqnarray*}
where the conditional version of Hölder’s inequality is applied to the numerator in the second step. As
 $x \uparrow \hat{x}$
, we have
 \begin{equation*}(1-q)^k \leq \overline{F}_{X |Y \gt y_p}(x) \sim C_p\overline{F}(x).\end{equation*}
Thus,
 $x \uparrow \hat{x}$
implies
 $q \uparrow 1$
. Conversely, we write
 \begin{align*}m_*(x)= x+\frac{1}{1-q}\left\lVert(X-x)_{+}\big|Y \gt y_p\right\rVert_{k}, \quad x\in \mathbb{R}, \end{align*}
so that
 $\mathrm{CoHM}_{p,q}\left(X\big|Y\right)= \inf_{0 \lt x \lt \hat{x}} m_*(x)$
. Similar to Proposition 3 of Bellini and Rosazza Gianin (Reference Bellini and Rosazza Gianin2012), it can be verify that
 $m_*(x)$
is convex over
 $\mathbb{R}$
and is strictly convex over
 $({-}\infty,\hat{x})$
. Thus,
 $m^{\prime}_*(x)$
is strictly increasing in
 $x \in ({-}\infty,\hat{x})$
, or equivalently, the left-hand side of (2.4) is strictly decreasing in
 $x\in({-}\infty,\hat{x})$
, from which we easily infer that
 $q \uparrow 1$
leads to
 $x \uparrow \hat{x}$
.
Next, we prepare the following lemma, which will play an important role in the proofs of Theorems 3.1, 3.2, and 3.3.
Lemma A.7 Let (X,Y) be a bivariate random vector satisfying Assumption 2.1 and let
 $F \in \mathrm{MDA}\left(H\right)$
, then it holds
 \begin{align}\lim_{x \uparrow \hat{x}} \frac{E\left[(X-x)_{+}^{k}\big|Y \gt y_p\right]}{r(x) \overline{F}(x)} = \left\{\begin{array}{l@{\quad}l@{\quad}l}C_p k\mathrm{B}(\gamma-k, k), & \text{ for all } 0 \lt k \lt \gamma & \text{ if } H=\Phi_\gamma \text{ with some } \gamma \gt 0 \\[3pt] C_p \Gamma(k+1), & \text{ for all } k \gt 0 & \text{ if } H=\Lambda \\[3pt] C_p k\mathrm{B}(\gamma+1, k), & \text{ for all } k \gt 0 & \text{ if } H=\Psi_\gamma \text{ with some } \gamma \gt 0\end{array}\right.\end{align}
where
 \begin{equation*}r(x) = \left\{\begin{array}{l@{\quad}l}x^k, & \text{ if } H=\Phi_\gamma \\[3pt] a^k(x), & \text{ if } H=\Lambda \\[3pt] (\hat{x}-x)^k, & \text{ if } H=\Psi_\gamma.\end{array}\right.\end{equation*}
Proof. (i) When
 $\hat{x}=\infty$
,
 $H=\Phi_\gamma$
or
 $\Lambda$
. For the Fréchet case, since
 $\overline{F}({\cdot})\in \mathcal{R}_{-\gamma}(\infty)$
, by Lemma A.2, for arbitrary
 $0 \lt \varepsilon \lt 1$
, there is some
 $x_{0}$
such that for all
 $x \gt x_{0}$
and all
 $z\geq0$
,
 \begin{equation*}\frac{P\left(X \gt x(z+1), Y \gt y_p\right)}{\overline{F}(x)} \leq \frac{\overline{F}(x(1+z))}{\overline{F}(x)} \leq (1+\varepsilon)\left(1+z\right)^{-\gamma+\varepsilon}.\end{equation*}
By the dominated convergence theorem and (2.8), we have
 \begin{eqnarray*}\lim_{x \uparrow \infty} \frac{E\left[(X-x)_{+}^{k}\big|Y \gt y_p\right]}{x^{k} \overline{F}(x)}&=& \lim_{x \uparrow \infty} \frac{1}{\overline{G}(y_p)} \int_0^{\infty} \frac{P\left(X \gt x(1+z), Y \gt y_p\right)}{\overline{F}(x)} \,\mathrm{d}z^{k}\\&=& C_p \int_0^{\infty} \lim_{x \uparrow \infty} \frac{\overline{F}\left(x(1+z)\right)}{\overline{F}(x)} \,\mathrm{d}z^{k}\\&=& C_p \int_0^{\infty} (1+z)^{-\gamma} \,\mathrm{d}z^{k}\\&=& C_p k\mathrm{B}(\gamma-k, k).\end{eqnarray*}
Thus, the Fréchet case holds.
Next, we turn to the Gumbel case with
 $\hat{x}=\infty$
. By Lemma A.3, for arbitrary
 $0 \lt \varepsilon \lt 1$
, there is some
 $x_{0}$
such that for all
 $x \gt x_{0}$
and all
 $z\geq0$
,
 \begin{align}\frac{P\left(X \gt x+za(x), Y \gt y_p\right)}{\overline{F}(x)} \leq \frac{\overline{F}(x+za(x))}{\overline{F}(x)} \leq (1+\varepsilon)\left(1+\varepsilon z\right)^{-1/\varepsilon}.\end{align}
By the dominated convergence theorem and (2.8), we have
 \begin{eqnarray*}\lim_{x \uparrow \infty} \frac{E\left[(X-x)_{+}^{k}\big|Y \gt y_p\right]}{a^{k}(x) \overline{F}(x)}&=& \lim_{x \uparrow \infty} \frac{1}{\overline{G}(y_p)} \int_0^{\infty} \frac{P\left(X \gt x+za(x), Y \gt y_p\right)}{\overline{F}(x)} \,\mathrm{d}z^{k} \\&=& C_p \int_0^{\infty} \lim_{x \uparrow \infty} \frac{\overline{F}\left(x+za(x)\right)}{\overline{F}(x)} \,\mathrm{d}z^{k}\\&=& C_p \int_0^{\infty} \mathrm{e}^{-z} \,\mathrm{d}z^{k}\\&=& C_p \Gamma(k+1).\end{eqnarray*}
Thus, the Gumbel case holds for
 $\hat{x}=\infty$
.
(ii) When
 $\hat{x} \lt \infty$
,
 $H=\Lambda$
or
 $\Psi_\gamma$
. If
 $F$
is in the Gumbel MDA with
 $\hat{x} \lt \infty$
, by Lemma A.3, for arbitrary
 $0 \lt \varepsilon \lt 1$
, there is some
 $x_{0} \lt \hat{x}$
such that for all
 $x_{0} \lt x \lt \hat{x}$
and all
 $z\geq0$
, (A.3) still holds. By the dominated convergence theorem and (2.8), we have
 \begin{eqnarray*}\lim_{x \uparrow \hat{x}} \frac{E\left[(X-x)_{+}^{k}\big|Y \gt y_p\right]}{a^{k}(x) \overline{F}(x)}&=& \lim_{x \uparrow \hat{x}} \frac{1}{\overline{G}(y_p)} \int_0^{(\hat{x}-x)/a(x)} \frac{P\left(X \gt x+za(x), Y \gt y_p\right)}{\overline{F}(x)} \,\mathrm{d}z^{k} \\&=& C_p \int_0^{\infty} \lim_{x \uparrow \hat{x}} \frac{\overline{F}\left(x+za(x)\right)}{\overline{F}(x)} \,\mathrm{d}z^{k}\\&=& C_p \int_0^{\infty} \mathrm{e}^{-z} \,\mathrm{d}z^{k}\\&=& C_p \Gamma(k+1).\end{eqnarray*}
Thus, the Gumbel case also holds for
 $\hat{x} \lt \infty$
.
Now, we consider the Weibull case. Since
 $\overline{F}(\hat{x}-\cdot)\in \mathcal{R}_{\gamma}(0{+})$
, by Lemma A.2, for arbitrary
 $0 \lt \varepsilon \lt 1$
, there is some
 $x_{0} \lt \hat{x}$
such that for all
 $x_{0} \lt x \lt \hat{x}$
and all
 $0\leq z \leq 1$
,
 \begin{equation*}\frac{P\left(X \gt \hat{x}-(\hat{x}-x)(1-z), Y \gt y_p\right)}{\overline{F}(\hat{x}-(\hat{x}-x))} \leq \frac{\overline{F}(\hat{x}-(\hat{x}-x)(1-z))}{\overline{F}(\hat{x}-(\hat{x}-x))} \leq(1+\varepsilon)(1-z)^{\gamma-\varepsilon}.\end{equation*}
By the dominated convergence theorem and (2.8), we have
 \begin{eqnarray*}\lim_{x \uparrow \infty} \frac{E\left[(X-x)_{+}^{k}\big|Y \gt y_p\right]}{(\hat{x}-x)^{k} \overline{F}(x)}&=& \lim_{x \uparrow \hat{x}} \frac{1}{\overline{G}(y_p)} \int_0^1 \frac{P\left(X \gt \hat{x}-(\hat{x}-x)(1-z), Y \gt y_p\right)}{\overline{F}(\hat{x}-(\hat{x}-x))} \,\mathrm{d}z^{k}\\&=& C_p \int_0^1 \lim_{x \uparrow \hat{x}} \frac{\overline{F}\left(\hat{x}-(\hat{x}-x)(1-z)\right)}{\overline{F}(\hat{x}-(\hat{x}-x))} \,\mathrm{d}z^{k}\\&=& C_p \int_0^1 (1-z)^{\gamma} \,\mathrm{d}z^{k}\\&=& C_p k\mathrm{B}(\gamma+1, k).\end{eqnarray*}
Thus, the Weibull case also holds.
A.2 Proof of Theorem 3.1
Recall Lemma A.6,
 $x \uparrow \hat{x}$
if and only if
 $q \uparrow 1$
. Thus, they can be interchangeably used in the following proof.
We discuss
 $k=1$
and
 $k \gt 1$
separately. When
 $k=1$
, we start from (2.2) with
 $x=F^{\leftarrow}_{X|Y \gt y_p}(q)$
. By Lemma A.5 (i), it follows from (A.1) that
 \begin{align}x &= F^{\leftarrow}\left(1- C_p^{-1} (1+o(1)) (1-q)\right) \\[-25pt] \nonumber \end{align}
 \begin{align}&\!\!\!\!\!\!\!\!\!\!\!\!\!\!\!\!\!\!\!\!\!\!\!\!\!\!\!\sim C_p^{1/\gamma} F^{\leftarrow}(q).\quad\quad\end{align}
By Lemma A.7, (A.1), and (A.5),
 \begin{equation*}\mathrm{CoHM}_{p, q}\left(X\big|Y\right) \sim x+\frac{x}{\gamma-1}\frac{C_p \overline{F}(x)}{1-q}\sim \frac{\gamma}{\gamma-1}x\sim C_p^{1/\gamma} \frac{\gamma}{\gamma-1} F^{\leftarrow}(q).\end{equation*}
This proves relation (3.1) when
 $k = 1$
.
When
 $k \gt 1$
, we derive the approximation of
 $x$
solving Equation (2.4). By Lemma A.7,
 \begin{eqnarray*}(1-q)^{k} & \sim & C_p \frac{((k-1) \mathrm{B}(\gamma-k+1, k-1))^{k}}{(k \mathrm{B}(\gamma-k, k))^{k-1}} \overline{F}(x) \\& = & C_p \frac{(\gamma-k)^{k} \mathrm{B}(\gamma-k, k)}{k^{k-1}} \overline{F}(x),\end{eqnarray*}
or, equivalently,
 \begin{align}\overline{F}(x) \sim C_p^{-1} \frac{k^{k-1}}{(\gamma-k)^k \mathrm{B}(\gamma-k, k)}(1-q)^k.\end{align}
By Lemma A.5 (i) we obtain
 \begin{eqnarray}x & = & F^{\leftarrow}\left(1-C_p^{-1}\frac{(1+o(1))k^{k-1}}{(\gamma-k)^k \,\mathrm{B}(\gamma-k,k)}(1-q)^k\right) \notag \\& \sim & \left(C_p \frac{(\gamma-k)^{k} \mathrm{B}(\gamma-k, k)}{k^{k-1}}\right)^{1 / \gamma} F^{\leftarrow}(1-(1-q)^k).\end{eqnarray}
Now, applying (A.2), (A.6), and (A.7) to (2.3) yields that
 \begin{eqnarray*}\mathrm{CoHM}_{p, q}\left(X\big|Y\right)& = & x+\frac{\left(E\left[\left(X-x\right)_{+}^{k} \big| Y \gt y_p\right]\right)^{1/k}}{1-q} \\& \sim & x+\frac{\left(C_p {k\mathrm{B}(\gamma-k, k)} x^{k}\overline{F}(x)\right)^{1/k}}{1-q} \\& = & \frac{\gamma}{\gamma-k}x \\& \sim & C_p^{1 / \gamma} \frac{\gamma(\gamma-k)^{(k / \gamma)-1}}{k^{(k-1) / \gamma}} \,\mathrm{B}(\gamma-k, k)^{1 / \gamma} F^{\leftarrow}(1-(1-q)^k).\end{eqnarray*}
Thus, relation (3.1) holds when
 $k \gt 1$
.
A.3 Proof of Theorem 3.2
Similarly to before, we use
 $q \uparrow 1$
and
 $x \uparrow \hat{x}$
interchangeably. The auxiliary function
 $a({\cdot})$
below is the one in (2.6). In both cases, we discuss
 $k=1$
and
 $k \gt 1$
separately.
-
(i) When
$\hat{x}=\infty$
and
$k = 1$
, we start from (2.2) with
$x=F^{\leftarrow}_{X|Y \gt y_p}(q)$
. By Lemma A.7 and (A.1),
\begin{eqnarray*}\mathrm{CoHM}_{p,q}\left(X\big|Y\right) -x \sim \frac{C_p \overline{F}(x)}{1-q} a(x) \sim a(x),\end{eqnarray*}


which implies
 $\mathrm{CoHM}_{p,q}\left(X\big|Y\right)\sim x$
due to (2.5). For this case, (A.4) still holds so that we have
 \begin{equation*}\mathrm{CoHM}_{p,q}\left(X\big|Y\right) \sim F^{\leftarrow}\left(1-C_p^{-1} (1-q)\right).\end{equation*}
This proves relation (3.2) when
 $k = 1$
.
Next consider
 $k \gt 1$
, we derive the approximation of x solving Equation (2.4). By Lemma A.7,
 \begin{eqnarray*}(1-q)^k \sim C_p\frac{\left(\Gamma(k) a^{k-1}(x) \overline{F}(x)\right)^{k}}{\left(\Gamma(k+1) a^{k}(x) \overline{F}(x)\right)^{k-1}} = C_p\frac{\Gamma(k+1)}{k^{k}} \overline{F}(x),\end{eqnarray*}
or, equivalently,
 \begin{align}\overline{F}(x) \sim C_p^{-1} \frac{k^k}{\Gamma(k+1)}(1-q)^{k}.\end{align}
Then, applying (A.2) and (A.8) to (2.3) yields that
 \begin{align}\mathrm{CoHM}_{p, q}\left(X\big|Y\right)-x =\frac{\left(E\left[\left(X-x\right)_{+}^{k} \big| Y \gt y_p\right]\right)^{1/k}}{1-q} \sim ka(x),\end{align}
which leads to
 $\mathrm{CoHM}_{p, q}\left(X\big|Y\right)\sim x$
due to (2.5). By Lemma A.5 (i), it follows from (A.8) that
 \begin{eqnarray}x = F^{\leftarrow}\left(1- C_p^{-1} \frac{(1+o(1))k^k}{\Gamma(k+1)}(1-q)^{k} \right) \sim F^{\leftarrow}\left(1-C_p^{-1} \frac{k^k}{\Gamma(k+1)}(1-q)^{k}\right),\end{eqnarray}
which makes relation (3.2) hold when
 $k \gt 1$
.
-
(ii) When
$\hat{x} \lt \infty$
and
$k = 1$
, we start from (2.2) with
$x=F^{\leftarrow}_{X|Y \gt y_p}(q)$
. By Lemma A.7 and (A.1),
\begin{eqnarray*}(\hat{x}-\mathrm{CoHM}_{p,q}\left(X\big|Y\right)) - (\hat{x}-x) \sim -\frac{C_p \overline{F}(x)}{1-q} a(x) \sim -a(x),\end{eqnarray*}


which implies
 $\hat{x}-\mathrm{CoHM}_{p,q} \left(X\big|Y\right) \sim \hat{x}-x$
due to (2.5). For this case, (A.4) still holds so that we have
 \begin{equation*}\hat{x}-\mathrm{CoHM}_{p,q}\left(X\big|Y\right) \sim \hat{x}-F^{\leftarrow}\left(1-C_p^{-1} (1-q)\right).\end{equation*}
This proves relation (3.3) when
 $k = 1$
.
Next, consider
 $k \gt 1$
, (A.8) still holds. Applying (A.2) and (A.8) to (2.3) yields that
 \begin{eqnarray*}\left(\hat{x}-\mathrm{CoHM}_{p, q}\left(X\big|Y\right)\right)-(\hat{x}-x) \sim -\frac{\left(E\left[\left(X-x\right)_{+}^{k} \big| Y \gt y_p\right]\right)^{1/k}}{1-q} \sim -ka(x),\end{eqnarray*}
which leads to
 $\hat{x}-\mathrm{CoHM}_{p, q}\left(X\big|Y\right)\sim \hat{x}-x$
due to (2.5). By Lemma A.5 (ii), it follows from (A.8) that
 \begin{eqnarray*}\hat{x}-x =\hat{x} - F^{\leftarrow}\left(1- C_p^{-1} \frac{(1+o(1))k^k}{\Gamma(k+1)}(1-q)^{k} \right) \sim \hat{x} - F^{\leftarrow}\left(1-C_p^{-1} \frac{k^k}{\Gamma(k+1)}(1-q)^{k}\right),\end{eqnarray*}
which makes relation (3.3) hold when
 $k \gt 1$
.
A.4 Proof of Theorem 3.3
As before, we use
 $q \uparrow 1$
and
 $x \uparrow \hat{x}$
interchangeably and discuss
 $k=1$
and
 $k \gt 1$
separately.
When
 $k=1$
, we start from (2.2) with
 $x=F^{\leftarrow}_{X|Y \gt y_p}(q)$
. As before, (A.4) still holds and can be rewritten as:
 \begin{equation*}\hat{x} - x = \hat{x} - F^{\leftarrow}\left(1-C_p^{-1}(1+o(1))(1-q)\right).\end{equation*}
Applying Lemma A.5 (ii), we obtain
 \begin{align}\hat{x} - x \sim C_p^{-1/\gamma}(\hat{x}- F^{\leftarrow}(q)).\end{align}
By Lemma A.7, (A.1), and (A.11)
 \begin{eqnarray*}\hat{x}-\mathrm{CoHM}_{p,q}\left(X\big|Y\right) \sim \hat{x}-x-\frac{\hat{x}-x}{\gamma+1}\frac{C_p \overline{F}(x)}{1-q} \sim \frac{\gamma}{\gamma+1} \left(\hat{x} - x \right) \sim C_p^{-1/\gamma}\frac{\gamma}{\gamma+1} (\hat{x}- F^{\leftarrow}(q)).\end{eqnarray*}
This proves relation (3.4) when
 $k = 1$
.
When
 $k \gt 1$
, we derive the approximation of
 $x$
solving Equation (2.4). By Lemma A.7,
 \begin{eqnarray*}(1-q)^{k} & \sim & C_p \frac{((k-1)\mathrm{B}(\gamma+1, k-1))^{k}}{(k\mathrm{B}(\gamma+1, k))^{k-1}}\overline{F}(x) \\& = & C_p \frac{\mathrm{B}(\gamma+1, k)(\gamma+k)^{k}}{k^{k-1}}\overline{F}(x),\end{eqnarray*}
or, equivalently,
 \begin{align}\overline{F}(\hat{x}-(\hat{x}-x)) \sim C_p^{-1} \frac{k^{k-1}}{(\gamma+k)^k \mathrm{B}(\gamma+1, k)}(1-q)^k. \end{align}
Applying Lemma A.5 (ii), we obtain
 \begin{eqnarray}\hat{x}-x & = & \hat{x}-F^{\leftarrow}\left(1-C_p^{-1} \frac{(1+o(1))k^{k-1}}{(\gamma+k)^k \mathrm{B}(\gamma+1, k)}(1-q)^k\right) \notag \\& \sim & \left(C_p^{-1} \frac{k^{k-1}}{\mathrm{B}(\gamma+1, k)(\gamma+k)^{k}}\right)^{1/ \gamma} (\hat{x}-F^{\leftarrow}(1-(1-q)^k).\end{eqnarray}
Finally, by (2.3), (A.2), (A.12), and (A.13), we have
 \begin{eqnarray*}\hat{x}-\mathrm{CoHM}_{p, q}\left(X\big|Y\right)& = & (\hat{x}-x)-\frac{\left(E\left[\left(X-x\right)_{+}^{k} \big| Y \gt y_p\right]\right)^{1/k}}{1-q} \\& \sim & (\hat{x}-x)- \frac{\left(C_p k\mathrm{B}(\gamma+1, k) (\hat{x}-x)^{k}\overline{F}(\hat{x}-(\hat{x}-x))\right)^{1/k}} {1-q} \\& = & \frac{\gamma}{\gamma+k}(\hat{x}-x) \\& \sim & C_p^{-1/ \gamma}\frac{\gamma k^{(k-1)/\gamma}}{(\gamma+k)^{(k/\gamma)+1}}\mathrm{B}(\gamma+1, k)^{-1/ \gamma} (\hat{x}-F^{\leftarrow}(1-(1-q)^k).\end{eqnarray*}
Thus, relation (3.4) holds when
 $k \gt 1$
.