INTRODUCTION
Low coral atolls, such as those in the Marshall Islands, are found across the tropical and sub-tropical Pacific and their emergence provided strategic “stepping-stones” for human colonization of Oceania (Irwin Reference Irwin1992; Dickinson Reference Dickinson2001). Atolls consist primarily of wave-deposited unconsolidated sand and rubble accumulations, called islets or motu, building on reef platforms to only a few meters above sea level, which encircle a lagoon (Wiens Reference Wiens1962; McLean and Woodroffe Reference McLean and Woodroffe1994; Nunn Reference Nunn1994). In the central Pacific, islets started to form on paleoreef flats during the mid-Holocene (Dickinson Reference Dickinson2003: 497), but few habitation dates are older than 2000 cal BP. What sets atolls apart from all other Pacific island types is not only their precarious nature for human colonization because of low elevation, small size, nutrient-poor soils, and lack of surface potable water, but that the islets also consist exclusively of biogenetic material—mostly coral and foraminifera with minor amounts of coralline algae, marine shells and urchin fragments. These biogenetic sediments are directly datable for establishing sequences of atoll emergence and islet development (Yamano et al. Reference Yamano, Kayanne, Matsuda and Tsuji2002; Woodroffe et al. Reference Woodroffe, Samosorn, Hua and Hart2007)—an essential baseline for constraining the chronology for human colonization (Weisler et al. Reference Weisler, Yamano and Hua2012). Because atoll sediments are marine-derived, accurately calibrating radiocarbon (14C) age determinations on these materials requires a robust marine 14C reservoir correction (ΔR) that spans the latter stages of islet development, including the entire period of prehistoric occupation. A refined ΔR also permits calibration of marine-derived materials from archaeological sites such as shell, bones of turtle, fish, and sea birds and also humans or other mammals (e.g., pigs, dogs, rats) that had marine contributions to their diet.
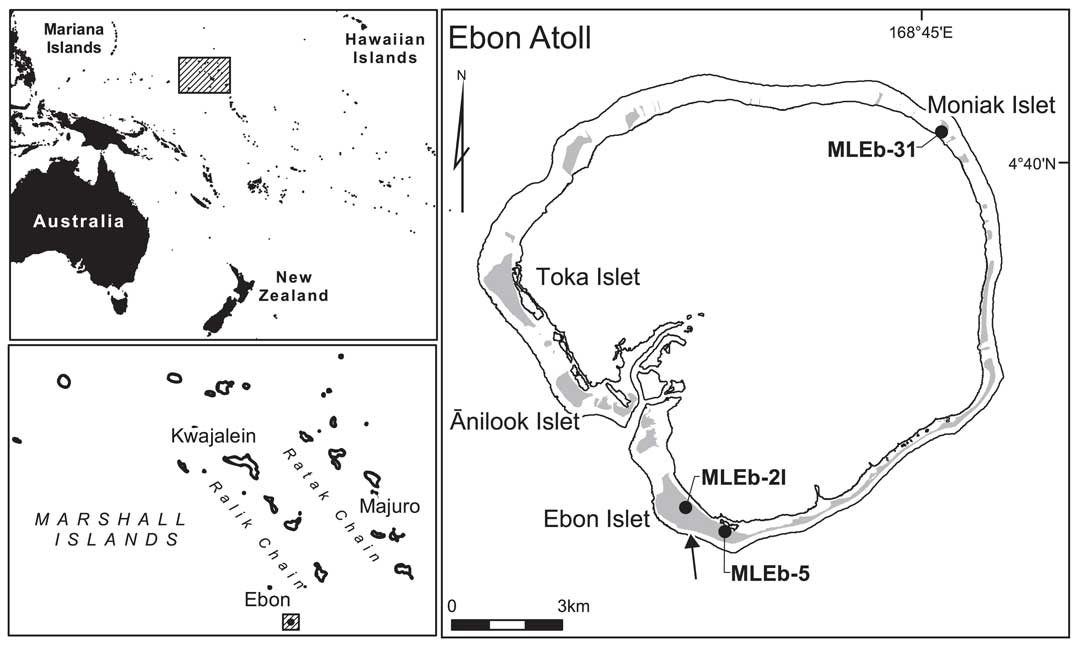
In this paper we report new ΔR values for the atoll archipelago of the Marshall Islands of eastern Micronesia (Figure 1). We selected pristine branch coral from the modern oceanside beach, archaeological sites, and islet developmental facies, then each sample was analyzed by U-series and accelerator mass spectrometry (AMS) 14C making it unnecessary to depend on stratigraphic association of sample pairs (e.g., wood charcoal and marine shell), which is a common method for deriving a ΔR for other islands of the Pacific (e.g., Jones et al. Reference Jones, Petchey, Green, Sheppard and Phelan2007; Petchey et al. Reference Petchey, Allen, Addison and Anderson2009). Our dating methodology has been used successfully for establishing ΔR values for the entire prehistoric sequence for the Hawaiian Islands (Weisler et al. Reference Weisler, Hua and Zhao2009) and for the colonization period of American Samoa (Clark et al. Reference Clark, Quintus, Weisler, St Pierre, Nothdurft, Feng and Hua2016). We provide a revised ΔR for the Marshall Islands with samples spanning ~500 yr before earliest known human colonization (the period when islets first became habitable) through the entire 2000-yr occupation sequence with samples from the most southern extent of the Marshall Islands−Ebon Atoll (4º34′N, 168º41′E). We argue that it is important to document temporal ΔR variability throughout the entire culture-historical sequence for an archipelago in order to calibrate marine-derived samples with adequate accuracy. Only using live-collected, pre-bomb museum specimens (usually modern) or pair-dated samples (marine and terrestrial) from archaeological contexts that represent only a portion of the culture-historical sequence may not document the temporal variability in ΔR.
Map of the Pacific, Marshall Islands archipelago, and Ebon Atoll including the locations of archaeological sites and oceanside beach (arrow) from where coral samples were collected and dated in this study.

Previous ΔR Values for the Marshall Islands
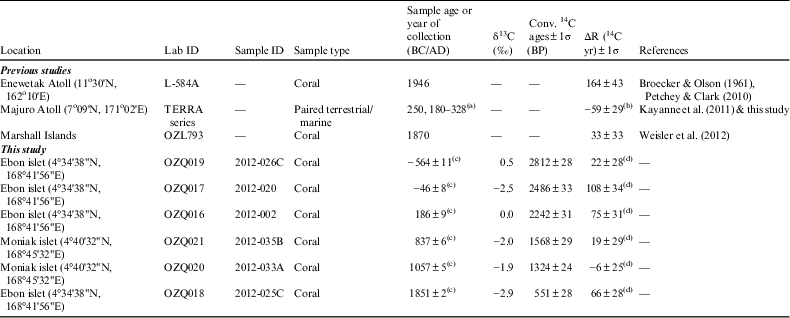
There are currently three ΔR values for the Marshall Islands. The first was published in Petchey and Clark (Reference Petchey and Clark2010). This ΔR value of 164±43 yr was estimated from a 14C date, measured by Broecker and Olson (Reference Broecker and Olson1961), on a coral sample (species not reported) collected live in 1946 at Enewetok (also spelled Enewetak) Atoll (11º30′N, 162º10′E), situated towards the northern extent of the archipelago.
Kayanne et al. (Reference Kayanne, Yasukochi, Yamaguchi and Yamano2011) established a ΔR of –35±25 yr derived from dating wood charcoal and marine mammal bones from the same prehistoric oven feature (U1/Fe5) from archaeological site MJ-Lr2-8, Majuro Atoll (7º12′N,171º22′E) located near the middle of the archipelago. Eight unidentified wood charcoal flecks were individually dated from the oven delivering a weighted mean of 1781±12 BP, which provides a calendar age range of AD 180–328 (95% probability) with a median value of AD 250 when the IntCal13 data (Reimer et al. Reference Reimer, Bard, Bayliss, Beck, Blackwell, Bronk Ramsey, Buck, Cheng, Edwards, Friedrich, Grootes, Guilderson, Haflidason, Hajdas, Hatté, Heaton, Hoffmann, Hogg, Hughen, Kaiser, Kromer, Manning, Niu, Reimer, Richards, Scott, Southon, Staff, Turney and van der Plicht2013) are used for age calibration. Three vertebrae of the melon-headed whale (Peponocephala electra) were also dated from the oven (weighted mean 14C age of 2067±21 BP) so the provenance of all 11 samples is secure and appropriate for “pair-dating.” The method of calculation of this ΔR value, however, was not clearly discussed by Kayanne et al. (Reference Kayanne, Yasukochi, Yamaguchi and Yamano2011). We therefore recalculated the ΔR value for this site using the weighted mean 14C ages of terrestrial and marine samples mentioned above and the online deltar software (Reimer and Reimer Reference Reimer and Reimer2016) with the IntCal13 and Marine13 data (Reimer et al. Reference Reimer, Bard, Bayliss, Beck, Blackwell, Bronk Ramsey, Buck, Cheng, Edwards, Friedrich, Grootes, Guilderson, Haflidason, Hajdas, Hatté, Heaton, Hoffmann, Hogg, Hughen, Kaiser, Kromer, Manning, Niu, Reimer, Richards, Scott, Southon, Staff, Turney and van der Plicht2013). The recalculated ΔR value is –59±29 yr, which is slightly lower than that published in Kayanne et al. (Reference Kayanne, Yasukochi, Yamaguchi and Yamano2011).
Weisler et al. (Reference Weisler, Yamano and Hua2012) AMS dated a coral finger of Acropora florida (Bishop Museum, Hawaii, sample number SC-3363) collected live in 1870 from an unspecified atoll, which yielded a ΔR of 33±33 yr (Table 2). Like the Enewetok sample, it is not known if the sample was collected from the lagoon or oceanside. However, multiple years of growth were sampled so the date is not subject to large seasonal/annual variability in ocean surface 14C.
The three ΔR values previously published for the Marshall Islands show large variation ranging from –59 to 164 yr. Aside from possible spatial variability in ΔR, the previous values may not be representative of the 2000-yr occupation sequence for the Marshall Islands due to possible temporal variations in ocean circulation within the archipelago. Therefore, it is necessary to develop robust ΔR values calculated from samples spanning the entire occupation sequence of the Marshall Islands using appropriate materials with known provenance.
STUDY AREA AND METHODS
Study Area and Field Sampling
The Marshall Islands form the eastern extent of Micronesia in the north Pacific, situated ~3,700 km west-southwest of Hawaii between 4°–12° north latitude (Figure 1). The archipelago consists of 29 low-lying atolls and five small coral islands orientated in two roughly parallel lines trending southeast-northwest for about 1000 km, encompassing a sea area of about 2 million km2—it is the most dispersed archipelago in the world. There is a marked rainfall gradient from the wet south, with ~4000 mm of annual precipitation, to ~1500 mm in the dry north. On Pacific atolls, variation in rainfall is the most significant determinant of terrestrial species diversity (Fosberg Reference Fosberg1984; Stoddart Reference Stoddart1992) and is mirrored in the prehistoric settlement patterns by varying degrees of surface artifacts, area of prehistoric habitations, and size of aroid agricultural systems (Weisler Reference Weisler1999a, Reference Weisler1999b, Reference Weisler2001a, 2001b). (Many aroids in the Araceae family have a starch-rich edible corm, which was an important source of carbohydrate.) Indeed, studies show that there is a positive correlation between human carrying capacity, island size, and climate (Williamson and Sabath Reference Williamson and Sabath1982). In 1993 Weisler initiated a long-term investigation into the variability in atoll settlement patterns, subsistence, economy, and human impacts to the marine and terrestrial ecosystems by selecting four study atolls across the rainfall gradient (Weisler Reference Weisler1999a, Reference Weisler1999b, Reference Weisler2001a, Reference Weisler2001b, Reference Weisler2002; Weisler et al. Reference Weisler, Yamano and Hua2012; Swindler and Weisler Reference Swindler and Weisler2000, Reference Swindler and Weisler2002; Horrocks and Weisler Reference Horrocks and Weisler2006; Pregill and Weisler Reference Pregill and Weisler2007; Christensen and Weisler Reference Christensen and Weisler2013). Situated at the extreme southern end of the archipelago where the rainfall is the greatest, Ebon Atoll consists of 22 islets (5.4 km2) surrounding a near-circular 104 km2 lagoon with the major pass at the southwest (Figure 1). During 1995–1996 and 2011–2012 Weisler conducted a complete archaeological survey recording >30 habitation sites, burial clusters, fish traps, trails, and agricultural systems. Excavations totaling 112 m2 (72.9 m3) were conducted at 8 habitation sites and agricultural systems. Predictably, the largest islets, situated along the leeward atoll rim (Figure 1: Ebon, Ānilook, and Toka), have the most extensive prehistoric villages and agricultural systems which parallel the lagoon and extend to the center of the islets. These largest islets have appreciable subterranean potable water (Ghyben-Herzberg lens), which is the primary attraction for earliest prehistoric settlement, whereas the smaller islets (mostly along the windward rim, e.g., Moniak) do not have formal agricultural systems. Only smaller habitation sites, however, evidence short-term, repeated occupations for staging fishing and shellfishing forays along the oceanside and lagoon reefs, collecting terrestrial crabs (especially, Birgus sp.), or capturing nesting seabirds (typically Sula spp.).
Coral samples for this study were collected from three archaeological sites and also on the oceanside beach of Ebon Atoll. Sites MLEb-2I and -5 are part of a contiguous habitation and agricultural system that extends ~2 km along Ebon islet, while site MLEb-31 is located on the small windward islet of Moniak (Figure 1). Appendix 1 provides the coral species, sample weight and maximum length, site, test pit (TP), depth below surface, and layer designation for each sample.
Sample Screening and Selection
The Marshall Islands ecoregion is a very diverse area with 329 coral species belonging to 67 genera (Veron et al. Reference Veron, Devantier, Turak, Green, Kininmonth, Stafford-Smith and Peterson2009; Huang and Roy Reference Huang and Roy2015). All samples used for this study are branching corals found in shallow water habitats and include: 1 Porites cylindrica, 1 Stylophora cf. subseriata, and 4 Pocillopora meandrina. In Bikini Atoll, northern Marshall Islands P. meandrina is found predominantly on the windward algal ridge (Wells Reference Wells1954: 404), but also in exposed reef crest, back reef, and reef slope habitats (Schmidt-Roach et al. Reference Schmidt-Roach, Miller, Lundgren and Andreakis2014). It has a cosmopolitan distribution from the tropical eastern Pacific to the Indian Ocean (Veron and Stafford-Smith Reference Veron and Stafford-Smith2000). P. cylindrica is also a widely distributed and common Indo-Pacific species that is a dominant taxon in lagoon and back reef margins, but can grow exposed in turbulence (Veron and Stafford-Smith Reference Veron and Stafford-Smith2000:III: 332–333), while S. cf. subseriata is common in most reef environments, but abundant on the windward reef flat (Wells Reference Wells1954: 402, 411, Figure 119).
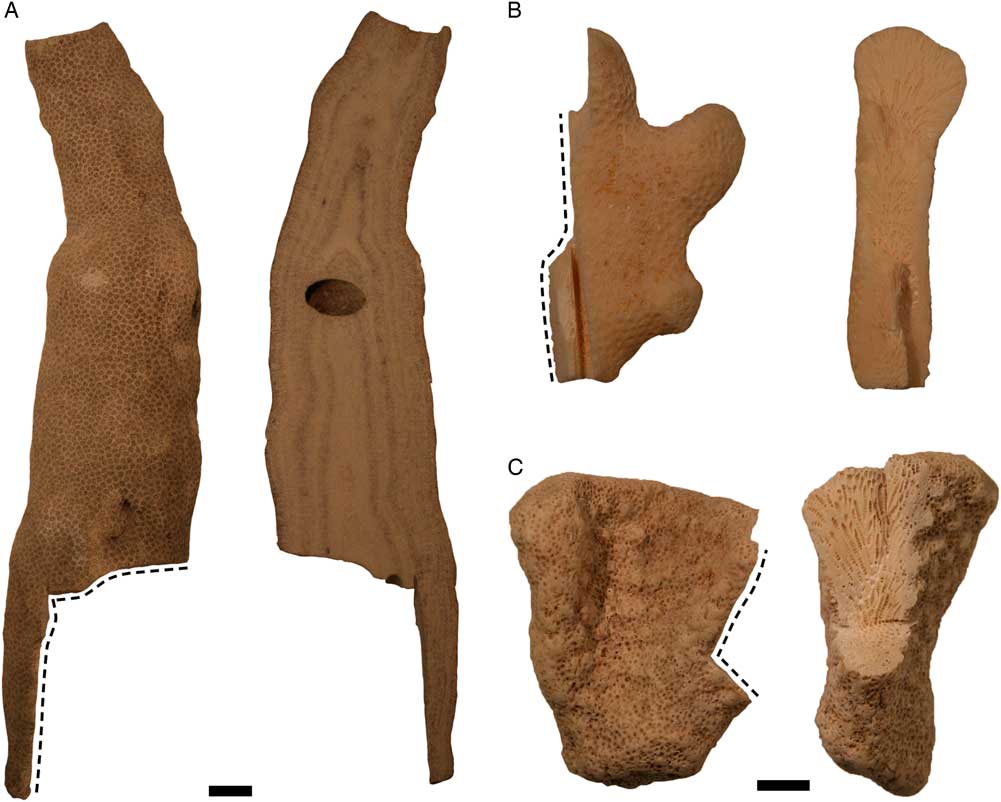
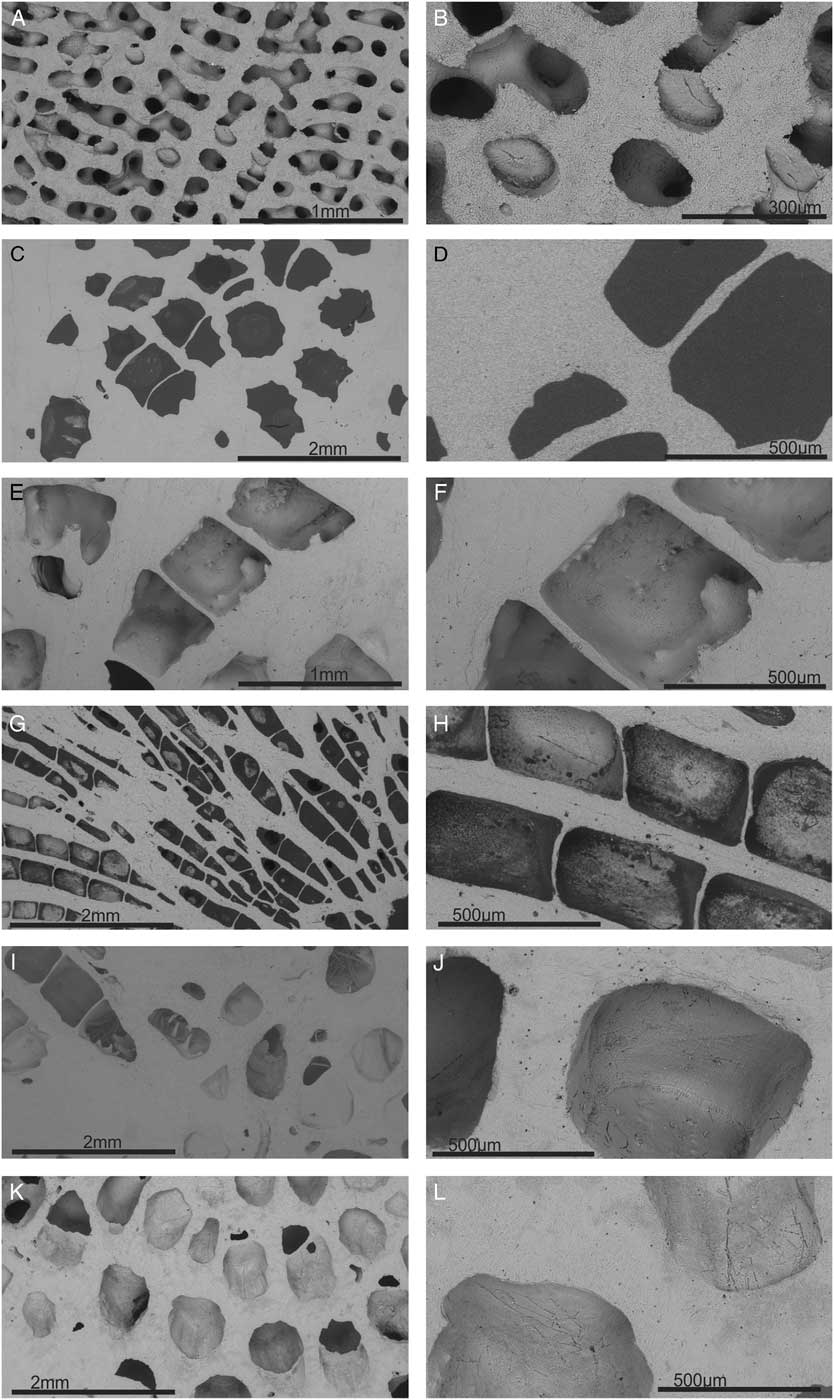
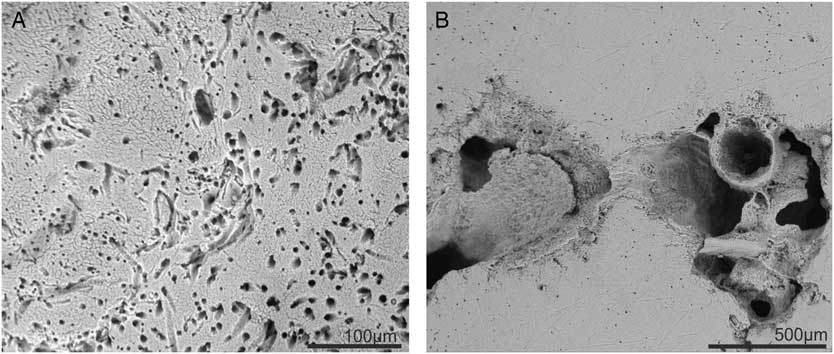
Coral branches were subsampled for analysis of diagenetic alteration using scanning electron microscopy (SEM) (Nothdurft and Webb Reference Nothdurft and Webb2009; Sadler et al. Reference Sadler, Webb, Nothdurft and Dechnik2014; Hua et al. Reference Hua, Webb, Zhao, Nothdurft, Lybolt, Price and Opdyke2015). Screening was performed at the Queensland University of Technology using a Hitachi TM3000 SEM and FEI Quanta 200 Environmental SEM, both with energy dispersive spectroscopy (EDS). Small representative pieces were cut with a diamond saw and analyzed with SEM for identifying pore-filling cements including marine aragonite and high magnesian calcite cements, meteoric cements, and dissolution and extensive bioerosion. Samples were then embedded in resin, polished, and etched with 1% formic acid solution for 15 s to observe the preservation of skeletal microstructure. Alteration of aragonite to calcite is readily determined with the SEM technique (Webb et al. Reference Webb, Nothdurft, Kamber, Kloprogge and Zhao2009). Samples that contained traces of calcite and any meteoric alteration were eliminated from the study. Samples for SEM and U-series dating and 14C analysis were immediately adjacent enabling a high level of spatial precision for selecting pristine aragonite samples. A total of 18 samples were analyzed with this method to ensure quality of the geochemical data for the best 6 samples selected for this study. Figure 2 illustrates representative coral samples and the locations of sampling. The pristine condition of each sample selected for dating is illustrated in Figure 3, while Figure 4 shows examples of a coral sample that was rejected for dating due to diagenetic contamination even though the exterior surface characteristics suggested a possible pristine condition.
Representative photos of coral samples used for dating. Dashed lines indicate the position of the subsamples used for U-series dating and 14C analysis. Exterior surface and interior view showing the locations of subsamples for dating: (A) Porites cylindrica, lab number 2012-002; (B) Stylophora cf. subseriata, 2012-026C; and (C) Pocillopora meandrina, 2012-033A. Table 1 lists the U-series dating and AMS analysis results, while the Appendix reports the provenance, weight, and maximum length of samples.

Scanning electron microscope images of sectioned coral samples used in this study. All samples are clean coral skeletons with a very low abundance of marine cements. They have been polished and etched for 15 s in weak formic acid. Two samples shown here have been set in epoxy resin in order to section and image (2012-20 and 2012-026C). (A and B) 2012-002; (C and D) 2012-020; (E and F) 2012-025C; (G and H) 2012-026C; (I and J) 2012-033A; and (K and L) 2012-035B. Samples are referenced in Tables 1 and 2.

Scanning electron microscope images of sample 2012-034B, which was excluded from this study due to diagenetic alteration of the original coral skeleton. (A) sector of coral skeleton with a density of bioerosion from microbial endoliths; (B) pores filled with high Mg calcite cement (right cavity) and other non-coral material including coralline red algae (left cavity).

U-Series Dating
U-series dating was performed in the Radiogenic Isotope Facility at the University of Queensland; see Burley et al. (Reference Burley, Weisler and Zhao2012) and Clark et al. (Reference Clark, Zhao, Roff, Feng, Done, Nothdurft and Pandolfi2014) for detailed analytical procedures. Each coral sample consisting of ~150 mg of carefully cleaned chips free of any weathered surfaces or dirt was spiked with a mixed 229Th-233U tracer and then completely dissolved in double-distilled concentrated HNO3. After digestion, each sample was further treated with H2O2 to decompose trace amounts of organic matter (if any) and to facilitate complete sample-tracer homogenization. U and Th were separated using conventional anion-exchange column chemistry using Bio-Rad AG 1-X8 resin. After stripping off the matrix from the column using double-distilled 7N HNO3 as eluent, 4N HNO3 and 2% HNO3 + 0.03% HF mixture were then respectively used to elute U and Th into 3.5-mL pre-cleaned test tubes. After screening U and Th concentrations in the U and Th fractions using their 1:100 dilute solutions on a quadrupole ICP-MS, the U and Th separates for the samples were then re-mixed in 2% HNO3 to make ~3 mL solution in a pre-cleaned 3.5-mL test tube. The mixed solution for each sample contains the entire Th fraction and a small percentage of the U fraction. The amount of U fraction to be added to the mixed solution was calculated based on the screening results, and the MC-ICP-MS working sensitivity, aiming to achieve ~5 volts of 238U signal. The remixed U-Th solution was injected into the MC-ICP-MS through a DSN-100 desolvation nebuliser system with an uptake rate of ~0.1 mL/min. U-Th isotopic measurements were performed on the MC-ICP-MS using a detector configuration to allow simultaneous measurements of both U and Th isotopes. The 230Th/238U and 234U/238U activity ratios of the samples were calculated using the decay constants given in Cheng et al. (Reference Cheng, Edwards, Hoff, Gallup, Richards and Asmerom2000). 230Th ages were calculated using the Isoplot 3.75 program (Ludwig Reference Ludwig2012). 230Th ages were corrected for non-radiogenic 230Th contributions assuming two different initial 230Th/232Th ratios (Table 1).
U-Th isotope data and ages for selected Pocillopora, Stylophora, and Porites branching coral samples from archaeological sites and oceanside beach. For sample provenance and taxon, see Appendix.

Note: Errors are quoted at 2 σ. Ratios in parentheses refer to activity ratios, calculated using decay constants from Cheng et al. (Reference Cheng, Edwards, Hoff, Gallup, Richards and Asmerom2000). All ages were calculated using Isoplot EX 2.3 program of Ludwig (Reference Ludwig2012). Uncorrected age was calculated assuming no non-radiogenic 230Th, whereas corrected age I and II, assuming 230Thnr/232Th atomic ratio of 4.4±2.2 x 10⁻⁶ (bulk-earth value), and 1.4±0.7 x 10⁻⁵ (determined from a modern coral at Kahikinui, Maui [Kirch and Sharp Reference Kirch and Sharp2005]). See Burley et al. (Reference Burley, Weisler and Zhao2012), Clark et al. (Reference Clark, Zhao, Roff, Feng, Done, Nothdurft and Pandolfi2014) and Weisler et al. (Reference Weisler, Collerson, Feng, Zhao and Yu2006) for detailed analytical procedures.
AMS 14C Analysis
U-Th dated coral samples containing >3 yr of growth were used for AMS 14C analysis. This approach aimed to avoid possible large seasonal/annual variability in surface ocean 14C (Druffel et al. Reference Druffel, Griffin, Guilderson, Kasahgarian, Southon and Schrag2001; Guilderson et al. Reference Guilderson, Schrag and Cane2004; Hua et al. Reference Hua, Woodroffe, Smithers, Barbetti and Fink2005), which could influence the results of our study. The samples were cut using a diamond saw, cleaned in Milli-Q water in an ultrasonic bath several times, oven dried, and homogenized using a mortar and pestle. The powdered carbonate samples were hydrolyzed to CO2 using 85% phosphoric acid and then converted to graphite using the H2/Fe method (Hua et al. Reference Hua, Jacobsen, Zoppi, Lawson, Williams, Smith and McGann2001). A small portion of graphite from each sample was employed for the determination of δ13C using the Micromass IsoPrime elemental analyzer/isotope ratio mass spectrometer (EA/IRMS) at ANSTO. The remaining graphite of each sample was loaded into an aluminum cathode by rear pressing for 14C analysis. AMS measurements were carried out using the STAR facility at ANSTO (Fink et al. Reference Fink, Hotchkis, Hua, Jacobsen, Smith, Zoppi, Child, Mifsud, van der Gaast, Williams and Williams2004) with a typical analytical precision of ~0.4% (1σ) or better.
RESULTS AND DISCUSSION
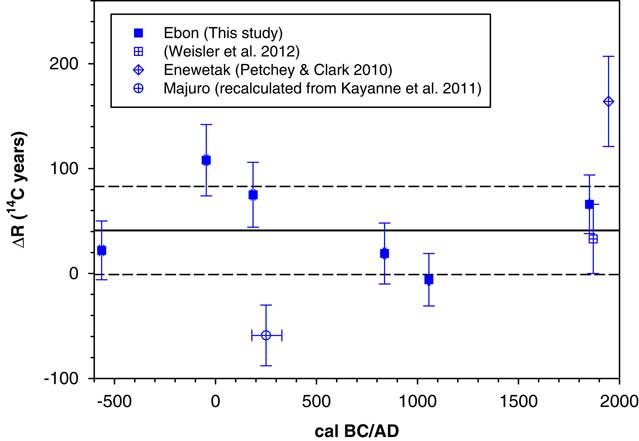
Some 18 coral samples were sectioned, then examined for diagenesis under SEM in order to select 6 unaltered samples appropriate for this study. This procedure is advocated to insure that only pristine samples are used for dating. Because the two corrected U-Th ages in Table 1 are very similar (as they overlap within 2σ uncertainties), we simply chose the corrected Age-I for ΔR calculation. The ΔR values for Ebon Atoll, Marshall Islands from this study shows a small variation ranging from −6±25 to 108±34 yr (Table 2 and Figure 5). This variation in our data might indicate temporal variability in 14C of surface ocean waters around Ebon Atoll for the past 2500 yr. However, this temporal variation, if it exists, is not substantial as the lowest and highest ΔR values just overlap with each other within 2σ uncertainties. The weighted mean ΔR value for Ebon Atoll for the past 2500 yr is 41±42 yr (χ2 5:0.05=10.45<11.10).
ΔR values for the Marshall Islands from previous work and this study. Solid and dashed lines represent a weighted mean ΔR of 41±42 yr (1σ) for Ebon Atoll for the past 2500 yr.

ΔR values for the Marshall Islands

(a) Cal. age (median and age range at 95% probability) resulted from age calibration of a terrestrial 14C age of 1781±12 BP (Kayanne et al. Reference Kayanne, Yasukochi, Yamaguchi and Yamano2011) using IntCal13 (Reimer et al. Reference Reimer, Bard, Bayliss, Beck, Blackwell, Bronk Ramsey, Buck, Cheng, Edwards, Friedrich, Grootes, Guilderson, Haflidason, Hajdas, Hatté, Heaton, Hoffmann, Hogg, Hughen, Kaiser, Kromer, Manning, Niu, Reimer, Richards, Scott, Southon, Staff, Turney and van der Plicht2013) and OxCal v4.2 program (Bronk Ramsey Reference Bronk Ramsey2009).
(b) ΔR value of paired terrestrial/marine samples (terrestrial 14C age of 1781±12 BP and marine 14C age of 2067±21 BP; Kayanne et al. Reference Kayanne, Yasukochi, Yamaguchi and Yamano2011) calculated using the online deltar software (Reimer and Reimer Reference Reimer and Reimer2016) and the IntCal13 and Marine13 data (Reimer et al. Reference Reimer, Bard, Bayliss, Beck, Blackwell, Bronk Ramsey, Buck, Cheng, Edwards, Friedrich, Grootes, Guilderson, Haflidason, Hajdas, Hatté, Heaton, Hoffmann, Hogg, Hughen, Kaiser, Kromer, Manning, Niu, Reimer, Richards, Scott, Southon, Staff, Turney and van der Plicht2013). See text for detailed information.
(c) Mean Th/U age±2σ.
(d) ΔR and uncertainty calculated using the online deltar online software (Reimer and Reimer Reference Reimer and Reimer2016) and the Marine13 data (Reimer et al. Reference Reimer, Bard, Bayliss, Beck, Blackwell, Bronk Ramsey, Buck, Cheng, Edwards, Friedrich, Grootes, Guilderson, Haflidason, Hajdas, Hatté, Heaton, Hoffmann, Hogg, Hughen, Kaiser, Kromer, Manning, Niu, Reimer, Richards, Scott, Southon, Staff, Turney and van der Plicht2013).
The three ΔR values previously published for the Marshall Islands are also listed in Table 2 and plotted in Figure 5 for comparison with our ΔR values. The ΔR value of 33±33 yr, estimated from a single, live-collected coral (Acropora florida) from an unspecified location in the Marshall Islands in AD 1870 (Weisler et al. Reference Weisler, Yamano and Hua2012), agrees well with that of similar-age sample OZQ018 (AD 1851±2) of 66±28 yr within 1σ uncertainty. In addition, this previous ΔR value is almost identical to the weighted mean value for Ebon Atoll of 41±42 yr. However, the ΔR values for Enewetak Atoll (164±43 yr; Petchey and Clark Reference Petchey and Clark2010) calculated from a 14C date published by Broecker and Olson (Reference Broecker and Olson1961) and Majuro Atoll (–59±29 yr) estimated from the data reported in Kayanne et al. (Reference Kayanne, Yasukochi, Yamaguchi and Yamano2011) are higher and lower than those for Ebon Atoll, respectively (Figure 5).
Petchey and Clark (Reference Petchey and Clark2010) question the utility of the high ΔR value of 164±43 yr for Enewetak Atoll. As the location of the coral was not reported, it is not known whether the sample was from the oceanside or lagoon. If the latter is the case, the coral sample used for dating might be influenced by hardwaters containing 14C-depleted bicarbonates derived from high permeability Pleistocene limestone aquifers at the atoll. The hardwater effect might become significant due to restricted lagoonal water exchange with open oceans as indicated by variable long residence times of waters in the lagoon of up to 120 days (Petchey et al. Reference Petchey, Anderson, Zondervan, Ulm and Hogg2008; Petchey and Clark Reference Petchey and Clark2010), resulting in the high ΔR value reported for Enewetak Atoll.
There are several issues on accurately determining ΔR values using 14C analysis of paired terrestrial/marine samples in archaeological contexts (e.g., the contemporaneousness of the paired samples and inbuilt age for terrestrial samples). However, the ΔR of –59±29 yr determined for Majuro Atoll using this method was based on the secured association of 8 wood charcoal samples and 3 melon-headed whale (Peponocephala electra) samples from a prehistoric oven. Although the 8 wood charcoal samples were not identified to species and their δ13C values ranged from –22.2 to –27.3‰ (Kayanne et al. Reference Kayanne, Yasukochi, Yamaguchi and Yamano2011: Table S1) indicating more than one woody species, the old wood problem is unlikely for these samples. It is because their weighted mean value of 1781±12 BP reported by Kayanne et al. (Reference Kayanne, Yasukochi, Yamaguchi and Yamano2011) was actually estimated from 7 similar 14C ages and the oldest age of 1889±36 BP (sample TERRA-03267a04), which was substantially higher than the mean age of the other charcoal samples (1781±12 BP) and subject to inbuilt age, was not taken into account. Kayanne et al. (Reference Kayanne, Yasukochi, Yamaguchi and Yamano2011) argued that the use of bones from the melon-headed whale for ΔR determination might overestimate this value because the melon-headed whale and its prey both inhabit deep waters (up to 2500 m in depth; Jefferson and Barros Reference Jefferson and Barros1997) containing relatively older carbon that is not representative of local, nearshore surface waters surrounding the atolls of the Marshall Islands (Östlund and Stuiver Reference Östlund and Stuiver1980). However, this is not the case as the determined ΔR value of –59±29 yr is quite low, indicating limited influence of 14C-depleted carbon. In addition, all food sources, except chemosynthetic organisms near vents, for marine fishes are based on organic carbon which is produced photosynthetically in the surface ocean so they are as old as dissolved organic carbon of the surface waters. This ΔR value of –59±29 yr for Majuro Atoll in AD 180–328 is significantly lower than that of similar-age sample from Ebon Atoll OZQ016 (AD 186±9) of 75±31 yr (see Table 2) as the two values do not overlap within 2σ uncertainties. This might indicate spatial variability in ΔR for the Marshall Islands and further ΔR values for Majuro Atoll are needed for such study.
Due to the issues discussed above, the ΔR values estimated for Enewetak Atoll (Petchey and Clark Reference Petchey and Clark2010) and Majuro Atoll cannot therefore be currently combined with our values for Ebon Atoll for a discussion of temporal and spatial variations in ΔR for the Marshall Islands for the past 2500 yr.
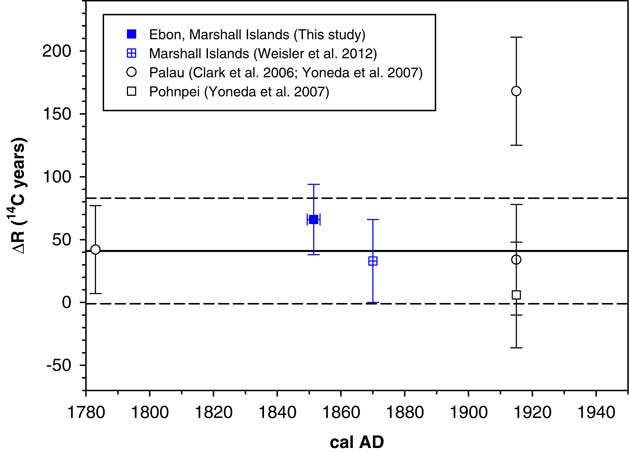
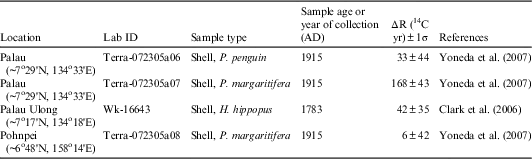
Published pre-bomb ΔR values derived from suspension feeding shellfish from the region surrounding the Marshall Islands, including Palau (Clark et al. Reference Clark, Anderson and Wright2006; Yoneda et al. Reference Yoneda, Uno, Shibata, Suzuki, Kumamoto, Yoshida, Sasaki, Suzuki and Kawahata2007) and Pohnpei (Yoneda et al. Reference Yoneda, Uno, Shibata, Suzuki, Kumamoto, Yoshida, Sasaki, Suzuki and Kawahata2007) in Micronesia, are presented in Table 3 and plotted in Figure 6. Except for one high ΔR value from Palau of 168±43 yr (sample Terra-072305a07; Yoneda et al. Reference Yoneda, Uno, Shibata, Suzuki, Kumamoto, Yoshida, Sasaki, Suzuki and Kawahata2007), these values are similar to the modern value for Ebon Atoll and that for the Marshall Islands reported by Weisler et al. (Reference Weisler, Yamano and Hua2012), and agree well with the weighted mean ΔR of 41±42 yr for Ebon Atoll within 1σ uncertainties. As the Marshall Islands and Micronesia are fed by the same surface water, the North Equatorial Counter Current (NECC) flowing eastward between ~3°N and ~10°N in the Pacific (Tomczak and Godfrey Reference Tomczak and Godfrey2001; Petchey et al. Reference Petchey, Allen, Addison and Anderson2009), the above evidence supports our ΔR results for Ebon Atoll.
Modern ΔR values for the Marshall Islands and nearby in Micronesia. Solid and dashed lines represent a weighted mean ΔR of 41±42 yr (1σ) for Ebon Atoll for the past 2500 yr.

Published ΔR values for the region surrounding the Marshall Islands derived from live-collected suspension feeding shellfish.

Zaunbrecher et al. (Reference Zaunbrecher, Cobb, Beck, Charles, Druffel, Fairbanks, Griffin and Sayani2010) reported no substantial variations in coral Δ14C and consequently ΔR values during the last millennium for Palmyra Island (6°N, 162°W) in the central tropical Pacific, which is also on the path of the NECC (Tomczak and Godfrey Reference Tomczak and Godfrey2001; Petchey et al. Reference Petchey, Allen, Addison and Anderson2009). These results together with those in this study for Ebon Atoll indicate the stability of the NECC for the past 2500 yr. Stability in ΔR has also been demonstrated for other archipelagos in the Pacific including the Marquesas, Samoa, and the southern Cook Islands since AD 1200 (Petchey et al. Reference Petchey, Allen, Addison and Anderson2009) and the Hawaiian Islands since AD 700 (Weisler et al. Reference Weisler, Hua and Zhao2009). Hua et al. (Reference Hua, Webb, Zhao, Nothdurft, Lybolt, Price and Opdyke2015: 39) has shown that during the late Holocene (~5.4 cal kyr BP onwards) ΔR variations in several tropical and subtropical sites across the Pacific were not substantial and most values agreed with their respective modern values. Any variation observed at a particular site during this period of time might be due to local conditions and settings.
CONCLUSIONS
-
1. Ideally, all coral samples should be sectioned then examined under high magnification as we described here to screen for the effects of sample diagenesis and for selecting only pristine samples for U-series dating and AMS analysis.
-
2. A ΔR of 41±42 yr from ~500 yr before and throughout the 2000-yr culture-historic sequence was established for the southern extent of the Marshall Islands at Ebon Atoll, showing no substantial temporal variation. This ΔR is nearly identical to one estimated (33±33 yr), from a single coral sample (Acropora florida) collected live in 1870, previously reported by Weisler et al. (Reference Weisler, Yamano and Hua2012).
-
3. This new ΔR provides a robust value for calibrating marine materials such as coral, foraminifers, fish bone, and shellfish, and also bones from terrestrial animals (including humans, dogs, pigs, and rats) that had some order of marine diet.
-
4. Future studies should focus along the ~1000 km length of the Marshall Islands to determine any spatial variability in the reservoir offset.
-
5. ΔR for other archipelagos should be calculated for the entire culture-historical sequences to provide robust values for calibrating marine derived and influenced materials.
Acknowledgments
Weisler’s 2011–2012 fieldwork in the Republic of the Marshall Islands was supported by a grant from the Office of the Deputy Vice Chancellor (Research), University of Queensland and permission to conduct archaeological research on Ebon Atoll was granted by Josepha Maddison (Republic of the Marshall Islands, Historic Preservation Office, Ministry of Internal Affairs). U-series dating was funded by an Australian Research Council Discovery grant (DP0773909) and an Australian Research Council Lief grant (LE0989067) supported the next generation MC-ICPMS equipment. The Australian Institute of Nuclear Science and Engineering (AINSE) grant (ALNGRA 12004) funded AMS dating. We acknowledge the financial support from the Australian Government for the Centre for Accelerator Science at ANSTO through the National Collaborative Research Infrastructure Strategy (NCRIS). We thank Matthew Harris for preparing Figures 1 and 2, and three anonymous reviewers for their useful comments, which improved the manuscript.
APPENDIX
AMS analyses are presented for 6 well-preserved branch corals collected from the modern oceanside beach of Ebon islet and prehistoric habitation sites on Ebon and Moniak islets, Ebon Atoll, Republic of the Marshall Islands. AMS measurements were carried out using the STAR facility at the Australian Nuclear Science and Technology Organisation (ANSTO). Archaeological site numbers are those used by the Historic Preservation Office, Republic of the Marshall Islands. U-series dates are listed in Table 1.
δ 13C=0.0% OZQ016 Ebon Islet 2242±31 BP
Porites cylindrica branch coral (243.4 g; 181.09 mm maximum length; Figure 2A) from archaeological site MLEb-2I situated 425 m from the lagoon shore. Sample from Test Pit (TP) 22, spit 9, 87 cmbs (centimeters below surface). Collected on 13 January 2012 by MIW and submitted by MIW on 19 December 2012.
δ 13C=–2.5% OZQ017 Ebon Islet 486±33 BP
Pocillopora meandrina branch coral (17.5 g; 47.44 mm maximum length) from archaeological site MLEb-5 located 118 m from the lagoon shore. Sample from TP15, 137 cmbs. Collected on 12 December 2011 by MIW and submitted by MIW on 19 December 2012.
δ 13C=–2.9% OZQ018 Ebon Islet 551 ± 28 BP
Pocillopora meandrina branch coral (19.7 g; 59.52 mm maximum length) collected from the ocean side sand and gravel beach. Obtained on 12 December 2011 by MIW and submitted by MIW on 19 December 2012.
δ 13C=0.5% OZQ019 Ebon Islet 2812 ± 28 BP
Stylophora cf. subseriata branch coral (18.8 g; 46.33 mm maximum length; Figure 2B) from archaeological site MLEb-2I located 425 m from the lagoon shore. Sample from TP21, layer III, 100–130 cmbs. Collected on 13 January 2012 by MIW and submitted by MIW on 19 December 2012.
δ 13C=–1.9% OZQ020 Moniak Islet 1324 ± 24 BP
Pocillopora meandrina branch coral (51.1 g; 57.40 mm maximum length; Figure 2C) from archaeological site MLEb-31 located 60 m from the lagoon shore. Sample from TP6, spit 9, 70–80 cmbs. Collected on 3 January 2012 by MIW and submitted by MIW on 19 December 2012.
δ 13C=–2.0% OZQ021 Moniak Islet 1568 ± 29 BP
Pocillopora meandrina branch coral (19.3 g; 68.59 mm maximum length) from archaeological site MLEb-31 located 38 m from the lagoon shore. Sample from TP5, 40 cmbs. Collected on 3 January 2012 by MIW and submitted by MIW on 19 December 2012.