I. INTRODUCTION
Thermoelectric (TE) materials are capable of driving a direct conversion between heat and electricity, showing a huge advantage of improving the efficiency of energy. The efficiency of TE devices depends on material properties through the dimensionless figure of merit ZT, where T is the working temperature. Z is defined as σα2/κ, where σ is the electrical conductivity expressed by σ = neμ in which n is the carrier concentration and μ is the carrier mobility, α is the Seebeck coefficient expressed by α ≈ γ-ln n in which γ is the scattering factor, κ = κl + κe is the thermal conductivity composed of lattice and electronic parts. κe increases with σ, which can be expressed by the Wiedemann–Franz law, κe = LσT = LneμT, where L is the Lorenz constant. Recent leading TE materials such as PbTe, Reference Lu, Wang and Lu1 BiSbTe, Reference Poudel, Hao, Ma, Lan, Minnich, Yu, Yan, Wang, Muto, Vashaee, Chen, Liu, Dresselhaus, Chen and Ren2 skutterudites, Reference Biswas, Good, Roberts, Subramanian and Hendricks3 AgPbSbTe (LAST) Reference Zhou, Li and Kita4 exhibit outstanding TE properties (ZT > 1). However, they are confronted with the common problem of high costs and toxic raw materials, especially Pb and Te.
Cu1.8Se as a potential TE material with abundant source has been studied earlier because of its interesting properties and potential application in solar cells, window material, optical filter, electron-optical devices, and TE converter. Reference de Lima, Machado, Grandi, Gasperini, Maurmann, Souza and Campos5 Its crystal structure is cubic with a high symmetry. Based on the rigid fcc sublattice of Se, the Cu ions are concentrated at the tetrahedral 8(c) (1/4, 1/4, 1/4) sites at room temperature and gradually become mobile by raising temperature, showing a superionic behavior. Reference Heyding and Murry6 According to Danilkin's report, Reference Danilkin7 low-energy phonons could be strongly scattered by mobile Cu ions, which contribute to reducing κl. However, Cu1.8Se still possesses a high κ = 5.7 W m−1 K−1 (Ref. Reference Xiao, Xie, Tang and Zhang8) and a rather low α = 8 μV K−1 at room temperature. Reference Ohtani, Tachibana, Ogura, Miyake, Okada and Yokota9
Compositional control as an effective method to improve TE properties has been widely used in many TE alloy materials. For example, a 67% enhancement of ZT has been achieved through changing the Bi/S ratio from 2:3 to 2:2.9 in Bi2S3−x system. Reference Zhao, Zhang, Liu, Zhang and Li10 A 36% enhancement of ZT has also been obtained in CuCrS2+x compound through a subtle control of S content. Reference Hang, Zhang, Ge, Zhang and Liu11 Similar remarkable TE enhancements have been achieved in BiCu1−x SeO Reference Liu, Zhao and Liu12 system by introducing Cu deficiencies and in In4Se3−x Reference Zhu, Lan, Wang, Joshi, Hao, Chen and Ren13 system by Se deficiencies. Thus, compositional optimization through Cu-rich Cu1.8+x Se as an available route to improve TE properties was taken into account. On the one hand, Cu1.8Se is a p-type semiconductor. Reference Xiao, Xie, Tang and Zhang8 Since α is inversely proportional to n and κe is proportional to n, increasing Cu content could introduce electrons to decrease hole concentration n which benefits to improve α and to decrease κe. On the other hand, since low-energy phonons could be strongly scattered by mobile Cu ions, increasing mobile Cu ions will enhance the phonon scattering and result in reducing κl. In the present work, p-type Cu1.8+x Se (x = 0, 0.16, 0.20) polycrystals were fabricated by mechanical alloying (MA) and spark plasma sintering (SPS) technique. The phase structure, microstructure, band gap, and TE properties were investigated with a special emphasis on the influence of excess Cu content x.
II. EXPERIMENTAL
Commercial high-purity powders of Cu (99.5%) and Se (99.95%) were used as raw materials. Powders with chemical composition of Cu1.8+x Se (x = 0, 0.16, 0.20) were subjected to MA at 425 rpm for 2 h in an atmosphere of argon (95%) and hydrogen (5%) gas mixture using a planetary ball mill (QM-1SP2, NanJing University, Nan Jing, China). The resultant powders were loaded into a graphite die with an inner diameter of 20 mm, and then sintered at 873 K for 5 min under an axial compressive stress of 40 MPa in vacuum by using a SPS system (SPS1050; Sumitomo, Tokyo, Japan). The SPS prepared specimens were disk-shaped with dimensions of Ø20 mm × 4 mm. The phase structure was analyzed by x-ray diffraction with a Cu Kα radiation (λ = 1.5406 Å) filtered through a Ni foil (RAD-B system; Rigaku, Tokyo, Japan). The morphologies of powders and the fracture of bulk samples were observed by field-emission scanning electron microscopy (FESEM, SUPRA 55, Carl Zeiss, Oberkochen, Germany). The actual chemical compositions of samples were determined by electron probe microanalysis (EPMA; JXA-8100, JEOL, Tokyo, Japan). The electrical transport properties were evaluated along a sample section perpendicular to the SPS pressing direction. The Seebeck coefficient and electrical resistivity were measured from 323 to 773 K in helium atmosphere using a Seebeck coefficient/electrical resistance measuring system (ZEM-2, Ulvac-Riko, Japan). The density (d) of the sample was measured by the Archimedes method. In addition, the thermal conductivity of the sample was calculated by the relationship k = DC p d from the thermal diffusivity D measured by the laser flash method (LFA427; NETZSCH, Selb, Bavaria, Germany), specific heat (C p) measured by a differential scanning calorimeter (DSC-60, Shimadzu, Kyoto, Japan), and density d.
III. RESULTS AND DISCUSSION
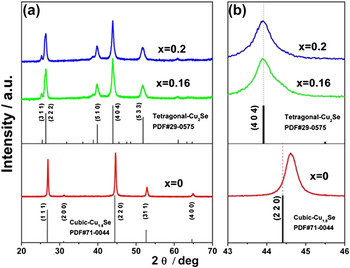
Figure 1 shows the XRD patterns of Cu1.8+x Se powders (x = 0, 0.16, 0.20). All the diffraction peaks of the x = 0 sample are well matched with the PDF#71-0044 card, indicating the formation of a single cubic Cu1.8Se phase. The 2-theta angle of (220)cubic peak for the x = 0 powder is 44.60° which is slightly higher than that (44.41°) in PDF#71-0044 in Fig. 1(b), indicating a shrink of lattice. The decreased lattice is ascribed to Cu vacancies caused by incomplete reaction of Cu during short 2 h-milling process rather than Se vacancies which lead to the enlargement of lattice. Reference Holgate, Zhu, Zhou, Bangarigadu-Sanasy, Kleinke, He and Tritt14 The reaction equation is described in the following:
 $$1.8{\rm{Cu}} + {\rm{Se}}\buildrel {2\,{\rm{h - MA}}} \over \longrightarrow {\rm{C}}{{\rm{u}}_{1.8 - x}}{\rm{Se}} + x{\rm{Cu}} + xV{\rm{Cu'}} + xh$$
XRD patterns with a selected 2θ range of 20°-70° (a) and 43°-46° (b) for Cu1.8+x Se (x = 0, 0.16, 0.20) powders obtained by applying MA at 425 rpm for 2 h.

The undetectable diffraction peaks of Cu are attributed to so few left Cu in the incomplete reaction. As x increases to 0.16 and 0.20, the main phase becomes tetragonal-Cu2Se (PDF#29-0575) without any impurity phase [Fig. 1(a)]. No any shift on the highest diffraction peak of (404)tetragonal plane for the x = 0.16 and 0.20 samples is observed compared to that in PDF#29-0575, indicating a complete reaction of Cu, which is different from the x = 0 sample. Because the formation energy (−ΔH 0) of Cu2Se is 21.8 kJ mol−1 which is lower than that (33.4 kJ mol−1) of Cu1.8Se, Reference Chakrabarti and Laughlin15 Cu2Se is easier to be synthesized than Cu1.8Se under the same 2 h-milling time. The diffraction peak of (404)tetragonal plane for x = 0.16 and 0.20 samples is wider than that of (220)cubic plane for the x = 0 sample, indicating refined grains, although their phase structure is different. Since the formation energy of Cu2Se is lower than that of Cu1.8Se, the left energy after powder Cu2Se was synthesized in x = 0.16 and 0.20 samples is used to fragment Cu2Se powder particles under enough 2 h-milling time, contributing to refined grains. There is no obvious distinction of XRD patterns between x = 0.16 and 0.20 powder samples.
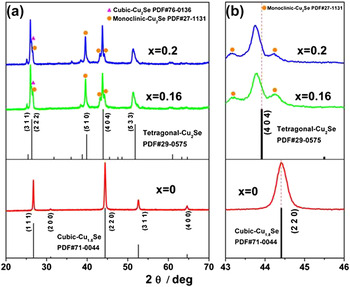
Figure 2 shows the XRD patterns of Cu1.8+x Se bulks (x = 0, 0.16, 0.20) sintered by applying SPS at 873 K for 5 min. The diffraction pattern of the x = 0 bulk matches well with cubic-Cu1.8Se (PDF#71-0044) phase as shown in Fig. 2(a). No obvious change on the width of the diffraction peak of (220)cubic plane for the x = 0 bulk is found between powder and bulk samples, indicating little grain growth during SPS process. However, compared to the x = 0 powder, the diffraction peak of (220)cubic plane in the x = 0 bulk shifts to low angle and returns to that in cubic-Cu1.8Se (PDF#71-0044) without any shift as shown in Fig. 2(b), indicating the disappearance of Cu vacancies and the complete reaction of left Cu in powder sample during SPS process. The reaction equation is described in the following:
 $${\rm{C}}{{\rm{u}}_{1.8 - x}}{\rm{Se}} + x{\rm{Cu}} + xV{\rm{Cu'}} + xh\buildrel {{\rm{SPS}}} \over \longrightarrow {\rm{C}}{{\rm{u}}_{1.8}}{\rm{Se}}$$
XRD patterns with a selected 2θ range of 20°-70° (a) and 43°-46° (b) for Cu1.8+x Se (x = 0, 0.16, 0.20) the bulks sintered by applying SPS at 873 K.

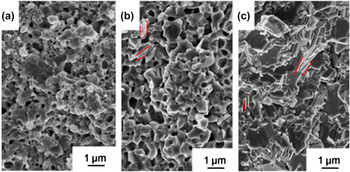
As x increases to 0.16 and 0.20, the main phase of tetragonal-Cu2Se (PDF#29-0575) is kept in both bulks without obvious distinction of XRD patterns between x = 0.16 and 0.20 bulks, similar to those in powder samples. Simultaneously, two second phases indexed as monoclinic-Cu2Se (PDF#27-1131) and cubic-Cu2Se (PDF#76-0136) appear, indicating that the structure of the two samples crystallizes in three ways: tetragonal, monoclinic, and cubic, as reported by Yu. Reference Yu, Liu, Chen, Wang, Wang, Chen and Ren16 The peak intensity of (222)tetragonal plane becomes stronger relative to that of (404)tetragonal plane in the XRD patterns for both x = 0.16 and x = 0.20 bulks, indicating the {111} texturing. According to the phase diagram, tetragonal-Cu2Se in x = 0.16 and x = 0.20 bulks would become cubic-Cu2Se whose structure is similar to that of cubic-Cu1.8Se over 400 K. Reference Chakrabarti and Laughlin15 Based on the fcc sublattice of Se, a part of Cu ions easily fell in the interstitial octahedral 4(b) (1/2, 1/2, 1/2) position with rising temperature and reserved as interstitial Cu ions during fast cooling process to the room temperature so as to contribute to the {111} texturing. Reference Danilkin7,Reference Yu, Liu, Chen, Wang, Wang, Chen and Ren16 Due to the interstitial Cu ions, the diffraction peak of (404)tetragonal plane for x = 0.16 and x = 0.20 bulks shifts to low angle compared to that of the PDF#29-0575, revealing the enlargement of lattice. Besides, the diffraction peak of (404)tetragonal plane for x = 0.16 and 0.20 bulks becomes narrower and sharper than that of the powder samples, indicating an enhanced grain size, which is different from the x = 0 bulk. This may be due to that the interstitial Cu ions contribute to a larger diffusion rate and a lower diffusion activation energy of the interstitial solid solution which favor the grain growth. The FESEM images of the fractured surfaces for Cu1.8+x Se bulks are shown in Fig. 3. The x = 0 bulk whose measured density is 5.14 g cm−3 reveals a porous microstructure with an average grain size about 500 nm. As x increases to 0.16 and 0.20, the average grain size changes to 800 and 1100 nm and the density changes to 5.91 g cm−3 and 6.47 g cm−3, which is due to the interstitial Cu ions as described in Fig. 2(b). A layer structure is clearly seen in x = 0.16 and 0.20 bulks as marked by red rods, being consistent with the {111} texturing as shown in Fig. 2(a), similar to the case in Yu's experiment. Reference Yu, Liu, Chen, Wang, Wang, Chen and Ren16 The thickness of every lamella is only about 40 nm, which may benefit to reduce the lattice thermal conductivity due to the phonon scattering on interface. Reference Yu, Liu, Chen, Wang, Wang, Chen and Ren16
Field emission scanning electron microscopy of the fractured surfaces for the Cu1.8+x Se bulks. (a) x = 0, (b) x = 0.16, (c) x = 0.20.

Actual composition of bulk samples measured by electron probe microanalysis (EPMA) for Cu1.8+x Se is listed in Table I. The measured Cu/Se ratio is 1.8244 for x = 0 bulk, close to its nominal Cu/Se ratio 1.8. The measured Cu/Se ratio for the x = 0.16 bulk is 1.8492, which is much lower than the nominal value 1.96. Since the EPMA was operated only in an area about one square micrometer and the compensation of Se is impossible, the reason is attributed to that x = 0.16 composition whose nominal molecular formula is Cu1.96Se and has the phase structure of Cu2Se according to XRD patterns in Figs. 1 and 2, easily forming into some Cu-poor composition in some area which contributes to the composition fluctuation. The defect equation is described in the following:
 $${\rm{C}}{{\rm{u}}_{1.8492}}{\rm{Se}}\buildrel {y = 0.1508} \over \longrightarrow {\rm{C}}{{\rm{u}}_{2 - y}}{\rm{Se}} + yV{\rm{Cu'}} + yh$$
Actual composition of the bulk samples for Cu1.8+x Se at room temperature.

The y value is 0.1508, much larger than the theoretical value 0.04. As a result, a mass of point defects are brought in which is beneficial to the reduction of thermal conductivity at high temperature. It is worth noting that the composition fluctuation has been reported in many materials. For example, a Pb-rich phase of Pb0.33Sn0.3Ge0.37Te which deviates from the nominal stoichiometric ratio of Pb0.25Sn0.25Ge0.5Te was found by Gelbstein. Reference Gelbstein17 In the synthesis of Bi1.995Cu0.005S3, some regions that are rich of Cu were found by Ge. Reference Ge, Zhang, Liu and Li18 While since the x = 0.20 composition with the molecular formula Cu2Se is well matched with its phase structure of Cu2Se in Figs. 1 and 2, the measured Cu/Se ratio for the x = 0.20 bulk which is 2.0174 is close to the nominal Cu/Se ratio which is 2.0.
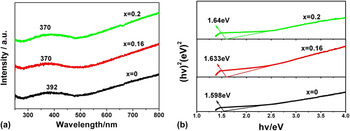
Figure 4(a) shows the optical absorption spectra of Cu1.8+x Se bulks. All samples exhibit an absorption peak in the wave length region of 300–400 nm. As x increases from 0 to 0.20 a blue shift trend from 392 to 370 nm is detectable, corresponding to the widening of band gap energy (E g) as shown in Fig. 4(b). The dependence of (αhv)2 as a function of photon energy hv indicates that all samples are the directly allowed nature of band-to-band transitions. The band gap energies are 1.598, 1.633, and 1.64 eV for x = 0, x = 0.16, and x = 0.20, respectively, in the plot of (αhv)2 versus hv which are determined by extrapolating the linear region of the curve to the hv axis where (αhv)2 = 0.
UV-vis absorption spectra (a) and relationship between (αhv)2 and hv for Cu1.8+x Se (x = 0, 0.16, 0.20) bulks (b).

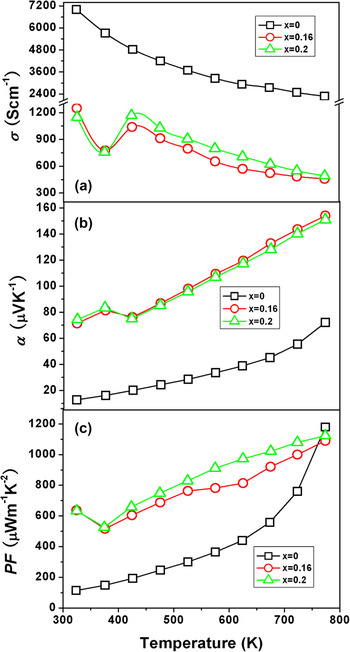
Figure 5 illustrates the temperature dependence of electrical transport properties for Cu1.8+x Se (x = 0, 0.16, 0.20). The electrical conductivity (σ) shown in Fig. 5(a) is expressed as σ = neμ, where n, μ and e are carrier concentrations, carrier mobility and electric charge, respectively. The x = 0 bulk has the largest σ up to 7000 S cm−1 at 323 K and shows a metallic behavior along with a decreased σ with rising temperature. As x increases, the σ decreases due to reduced n caused by increased Cu ions, similar to Xiao's report that n decreases significantly with increased Cu/Se ratio in Cu–Se compounds. Reference Xiao, Xie, Tang and Zhang8 A discontinuous variation occurs in the temperature range of 370–420 K in both x = 0.16 and x = 0.20 bulks, which is due to a transformation from tetragonal-phase to cubic-phase according to the phase diagram. Reference Chakrabarti and Laughlin15 Due to less n caused by more Cu content, σ decreases from 1250 to 778 S cm−1 in the temperature range of 323–373 K as x = 0.16 which is a little higher than that (1150–758 S cm−1) as x = 0.20. After phase transition from tetragonal-phase to cubic-phase, σ of the x = 0.16 bulk decreases from 1040 to 459 S cm−1 in the temperature range of 423–773 K which is inversely lower than that (1170–493 S cm−1) of the x = 0.20 bulk. The reason is attributed to strong carrier scattering on point defects Reference Ehrenreich19–Reference Glicksman21 caused by the composition fluctuation in the x = 0.16 sample, which contributes to a lower μ and is consistent with the EPMA results in Table I.
Temperature dependence of electrical conductivity (a), Seebeck coefficient (b), and power factor (c) for the Cu1.8+x Se (x = 0, 0.16, 0.20) bulks.

The Seebeck coefficient (α) in Fig. 5(b) which is usually inversely proportional to σ is positive for Cu1.8+x Se bulks, indicating a p-type semiconductive behavior with the main carrier of hole. The x = 0 bulk has a low α from 12.8 to 72 μV K−1 in the whole temperature interval. As x increases to 0.16 and 0.20, α becomes about four times higher than that of the x = 0 bulk at room temperature, which is attributed to the remarkable reduce of σ. A discontinuous variation is also detectable in the temperature range of 370–420 K in both x = 0.16 and x = 0.20 bulks due to the phase transition. The x = 0.16 bulk achieves the largest α = 150 μV K−1 (about two times of that for the x = 0 bulk) at 773 K. The increase in α with rising temperature reveals that the maximum of α is not yet reached at 773 K, which is consistent with the measured wide band gap of ∼1.6 eV in this material [Fig. 4(b)] and indicates that a further improvement may be obtained at higher temperature. Within this measurement range, bipolar diffusion can be neglected and thermally activated electrons do not cause a reduction in α. Reference Johnsen, He, Androulakis, Dravid, Todorov, Chung and Kanatzidis22 The power factor calculated by PF = σα2 in Fig. 5(c) increases with rising x and reaches 1100 W m−1 K−2 in x = 0.20 bulk at 773 K. The x = 0.16 bulk also gets 1090 W m−1 K−2 at the same temperature, comparative with x = 0.20 bulk.
Figure 6(a) shows the temperature dependence of thermal conductivity (κ) expressed as κ = κl + κe, where κe and κl are carrier thermal conductivity and lattice thermal conductivity, respectively. κe increases with σ, which can be expressed by the Wiedemann–Franz law, κe = LσT, where L is the Lorenz constant 2.45 × 10⁻⁸ V2 K−2. κ for x = 0 bulk is 4.8 W m−1 K−1 at room temperature, then decreases with increasing temperature and becomes 2.8 W m−1 K−1 at 773 K. As x increases to 0.16 and 0.20, κ value reduces markedly which is commonly below 1.6 W m−1 K−1 in the whole temperature range due to reduced κe caused by decreased σ and reduced κl caused by phonon scattering on increased mobile Cu ions and lamella interface with the thickness of only about 40 nm. In the temperature range of 323–423 K, κ of the x = 0.16 bulk is about 0.2 W m−1 K−1 and lower than that of the x = 0.20 bulk. This is attributed to that the x = 0.16 bulk owns more pores and grain boundaries [Figs. 3(b) and 3(c)], whose size is comparable to the mean free path low-energy phonons with long wave length, so as to intensify low-energy phonon scattering and reduce κl. Reference Zhang, Day, Snedaker, Wang, Kramer, Birkel, Ji, Liu, Snyder and Stucky23,Reference Row24 As temperature rises, κ of the x = 0.16 bulk gets lower further than that of the x = 0.20 bulk, resulting from decreased κe and stronger scattering of high-energy phonons on more point defects whose size is comparable to the mean free path high-energy phonons with short wave length in the x = 0.16 bulk. Reference Braden, Pintschovius, Uefuji and Yamada25 The x = 0.16 bulk gains the lowest κ of 0.69 W m−1 K−1 at 773 K, which is nearly 76.8% lower than that of the x = 0.20 bulk. A comparison of κ between x = 0.16 and x = 0.20 bulks after phase transformation is shown in the inset of Fig. 6(a). The distinction of thermal conductivity (Δκ) and carrier thermal conductivity (Δκe) between x = 0.16 and x = 0.20 bulks is given as follows according to Wiedemann–Franz law:
 $$\Delta {{\rm{\kappa }}_{\rm{e}}} = L\Delta {\rm{\sigma }}T$$
 $$\Delta {\rm{\kappa }} = \Delta {{\rm{\kappa }}_{\rm{l}}} + \Delta {{\rm{\kappa }}_{\rm{e}}}$$
where Δκl and Δσ are the distinction of lattice thermal conductivity and electrical conductivity, respectively and L is the Lorenz constant. Reference Liu, Shi, Xu, Zhang, Zhang, Chen, Li, Uher, Day and Snyder26 As shown in the inset of Fig. 6(a), Δκe is responsible for Δκ from 423 to 573 K due to Δσ. After 573 K, Δκl replaces Δκe and dominates Δκ resulting from scattering of high-energy phonons on point defects which is markedly effective at high temperature. Relaxation time of phonon scattering on point defects τPD is given by Reference Zebarjadi, Esfarjani, Dresselhaus, Ren and Chen27 :
 $${\rm{\tau }}_{{\rm{PD}}}^{ - 1} = {{V\Gamma } \over {4{\rm{\pi }}{v^{_3}}}}{{\rm{\omega }}^4} \propto {{\rm{\omega }}^4}$$
Temperature dependence of thermal conductivity (a) and ZT value (b) for Cu1.8+x S.

V, Γ, v, ω are the average volume per atom, disorder scaling parameter, average phonon velocity, and phonon frequency, respectively. As the temperature rises, the amount of high-energy phonons with high frequency increases, contributing to the increase of ω. Thus, phonon scattering on point defects could become rather strong at high temperature due to the ω4 frequency dependence which accounts for the large Δκl after 573 K between the x = 0.16 and x = 0.20 bulk. Reference Klemens28
Based on the measure ahead, the dimensionless TE figure of merit (ZT) was calculated by ZT = α2σT/κ as shown in Fig. 6(b). Among all samples, the x = 0.16 bulk acquires the highest ZT = 1.23 at 773 K which is about threefold that (0.41) of the x = 0 bulk due to the lowest κ especially largely decreased κl resulting from scattering of high-energy phonons on point defects at high temperature. There is also a 34% increment relative to Liu's report Reference Liu, Shi, Xu, Zhang, Zhang, Chen, Li, Uher, Day and Snyder26 as shown in Fig. 6(b).
IV. CONCLUSION
P-type Cu1.8+x Se polycrystals were synthesized by a process combining MA and SPS technique. The Seebeck coefficient of both x = 0.16 and x = 0.20 bulks achieved a 100% enhancement compared with that of the x = 0 bulk at 773 K. The thermal conductivity was commonly below 1.6 W m−1 K−1 in the whole temperature interval for x = 0.16 and x = 0.20 bulks, showing a pronounced reduction compared with that of the x = 0 bulk. The x = 0.16 bulk achieves the lowest thermal conductivity 0.69 W m−1 K−1 and reveals the highest ZT value 1.23 at 773 K, which is even 34% higher than that prepared by melting method in Liu's report at the same temperature, Reference Liu, Shi, Xu, Zhang, Zhang, Chen, Li, Uher, Day and Snyder26 confirming that this subtle composition optimization in Cu1.8+x Se system to improve its TE performance is really an effective method.
ACKNOWLEDGMENTS
This work was supported by National Natural Science Foundation of China (Grant No. 51272023) and High-Tech 973 Program of China (Grant No. 2013CB632500).