Nomenclature
- VCCTEF
Variable Camber Continuous Trailing Edge Flap
- RANS
Reynolds-Averaged Navier-Stokes
- URANS
Unsteady Reynolds-Averaged Navier-Stokes
- SST
Shear Stress Transport
- AOA
angle-of-attack
-
 ${C_L}$
-
lift coefficient
-
${C_D}$
-
drag coefficient
- L/D
-
lift-drag ratio
-
$Ma$
-
Mach number


1.0 Introduction
Design for drag reduction of aircraft has always been a research hotspot in the field of aircraft aerodynamic design [Reference Neittaanmäki, Rossi and Korotov1–Reference Beck, Landa and Seitz4]. The elliptical circulation distribution of the wings can minimise the induced drag, which is beneficial to the drag reduction of the aircraft [Reference Aoki and Muraoka5, Reference Demasi, Monegato and Cavallaro6]. Due to many design constraints, few aircraft can achieve an elliptical circulation distribution in their wings. In addition, as the flight condition changes, the circulation distribution of a wing also changes. A well-designed wing under one specific condition may not guarantee excellent aerodynamic performance under other conditions [Reference Guo, Tao and Wang7]. Here we take the long-range wide-body aircraft as an example. During the cruise period, the aircraft’s entire mission profile shows a variety of flight conditions induced by fuel consumption, change of cruise altitude, and Mach number. The traditional design method is to compromise on the performance of a variety of flight conditions, while such a design method cannot guarantee the optimal performance of the entire mission profile of the aircraft [Reference Burdette and Martins8]. In this context, variable camber technology has emerged, which adjusts the spanwise camber distribution of a wing according to different operating conditions of the aircraft [Reference Greff9, Reference Szodruch and Hilbig10], thereby further improving the performance during the entire mission profile of the aircraft.
The realisation of variable camber technology has various forms, including droop nose variable camber technology [Reference Vasista, Riemenschneider and Keimer11], variable camber flap technology [Reference Fielding12], and VCCTEF technology [Reference Kaul and Nguyen13]. The droop nose variable camber technology refers to using the deflection of the leading edge device to change the camber of the wing. The variable camber flap technology refers to cooperating the trailing edge flap and the spoiler to change the camber of the wing. The VCCTEF technology refers to changing the camber of the wing through continuous elastic deformation of the trailing edge of the wing. The ultimate goal of these technologies is to adjust the spanwise circulation distribution and pressure distribution of the wing in real time according to the flight conditions so that the spanwise circulation distribution of the aircraft wing benefits to increasing efficiency in the entire flight mission profile.
Due to the continuous elastic deformation of the trailing edge, the camber distribution along the spanwise is more precisely controlled, and thus, the control effect is better. As a result, most of the current variable camber researches focus on the VCCTEF technology. Eric Ting et al. [Reference Ting, Chaparro and Nguyen14] carried out an optimisation for drag reduction of NASA’s GTM configuration using VCCTEF technology. They studied the influence of different spanwise and chordwise segments of the flap and optimised the begin cruise condition. Besides, the optimised configuration was also evaluated at end cruise and ±30% design lift coefficient, as well as a Mach overspeed condition. The results showed that the configuration with the parabolic flap deflection angle can obtain 8.4% of drag reduction at the begin cruise condition. Sonia Lebofsky et al. [Reference Lebofsky, Ting and Nguyen15] used finite element and vortex-lattice method to optimise the design and off-design conditions of the GTM configuration coupled with aeroelasticity. The results showed that using the control surface deflection of the aircraft to change the wing shape has the potential for certain aerodynamic performance improvement.
Although the VCCTEF technology has a good performance of drag reduction, it has high requirements to the skin material and the variable camber mechanism, which lead to difficulty in engineering application. The variable camber flap technology uses the high-lift device which is originally required in the aircraft to realise the camber change. Its realisation difficulty is small, and the cost is very low. The technology of using flap deflection to achieve camber change of a wing has been successfully applied to the long-range wide-body passenger aircraft such as Boeing 787 and has achieved good performance [Reference Nelson16]. At present, most of the variable camber studies are based on two-dimensional aerofoils or jet transport aircraft. There are few reports on variable camber studies on propeller aircraft which deviates more from the elliptical circulation distribution. Liu Yi et al. [Reference Liu, Ouyang and Zhao17] used wind tunnel test to study the effect of propeller aircraft on the lift-drag ratio, by using trailing edge flaps with small-angle deflection to achieve camber change. But their test model did not consider the effect of propeller slipstream. Strictly speaking, it cannot be regarded as a study on the variable camber of a propeller aircraft.
To propeller aircraft, due to the influence of slipstream, the flow around the wings on both sides of the propeller is very different, and it varies with the change of the aircraft’s flight conditions. In addition, when all the propellers of a twin-engine or four-engine propeller aircraft rotate in the same direction, the flow on the left and right wings is also asymmetric [Reference Moens and Gardarein18]. Therefore, the spanwise circulation distribution of propeller aircraft wings is usually more different from the elliptical circulation distribution than turbofan aircraft. By introducing the variable camber flap technology into the design of the propeller aircraft wing, the circulation distribution of the left and right wings can be adjusted according to the flow at different spanwise positions of the wings and different flight conditions. Thus, the drag reduction of the propeller aircraft can be realised.
The current numerical simulation methods of propeller slipstream are mainly divided into the actuator disc method [Reference Bo, Dewang and Guoping19], the unsteady method [Reference Zhang, Yang and Song20], and the quasi-steady method under the multiple reference coordinate system [Reference Müller, Kozulovic and Friedrichs21]. The cost of simulation of the quasi-steady method is small, but the result is closely related to the initial phase angle of the propeller. The results obtained by different initial phases angle are quite different because the propeller slip flow is an unsteady periodic phenomenon. The simulation accuracy of the unsteady method is high, but it requires the unsteady simulation of the full aircraft, which consumes very high computing resources and time. The actuator disc method is an approximation of the real propeller effect. It can simulate the overall effect of the propeller by linking the changes in airflow speed and pressure with the propeller’s pull and torque.
Bontempo et al. [Reference Bontempo and Manna22] used an analytical method to analyse and evaluate the two kinds of error of propeller momentum theory in simulating propeller slipstream, including error caused by different differential forms and error caused by general momentum theory linearisation of tangential velocity square. The results showed that if and only if the thrust coefficient is less than 1, the error of the propeller momentum theory is small. Zhang et al. [Reference Zhang, Chen and Zhang23] combined the actuator disc method with the finite volume method to study the slipstream influence on the twin-propeller aircraft. The results showed that relatively accurate CFD results can be obtained by calculating a propeller in advance and then substituting the data into actuator disc model. Xia [Reference Xia24] has developed an actuator disc method with non-uniform distribution of radial and circumferential loads. Through the unsteady simulation of a single propeller, the unsteady load is extracted as a boundary condition to the steady simulation of the full aircraft. She used this method to study the problem of slipstream and wing aerodynamic interference, taking into account simulation accuracy and efficiency.
This paper uses the actuator disc method with non-uniform distribution of radial and circumferential loads to numerically simulate the propeller aircraft. The method is implemented in ANSYS CFX, and the implementation steps are described in detail. The method is verified by the wing+propeller configuration. Finally, based on this method, the variable camber flap technology is introduced into the design of the propeller aircraft wing for drag reduction. The flap is divided into several segments, and each segment is deflected at a small angle. The influence of flap deflection angle on the local angle-of-attack and circulation distribution is analysed. Through multi-round design, the designed configuration reduces the drag of the propeller aircraft in different flight conditions, which verifies the application value of the variable camber flap technology in the drag reduction of the propeller aircraft.
2.0 Model and simulation tool
The studied model adopted in this paper is a well-designed twin-engine propeller aircraft considering the effects of the slipstream. Each propeller has 6 blades. The trailing edge flap of the propeller aircraft is driven by a fixed-axis rotation mechanism, and camber change is very easy to be achieved in cooperation with the spoiler. Figure 1 shows the basic model. The blade pitch angle is 53°, and the direction of rotation is counterclockwise viewing upstream. The rotation speed is 810rev/min in the cruise condition and 870rev/min in the climb condition. The propellers on both wings rotate in the same direction. The design cruise condition is set at a flight altitude of 6km, with flight Mach number of
 $Ma = 0.5$
, and lift coefficient of
 ${C_L} = 0.5$
. The lift coefficients of the begin and end cruise conditions are
 ${C_L} = 0.52$
and
 ${C_L} = 0.48$
, respectively. The design climb condition is set at a flight altitude of 3km, with flight Mach number of
 $Ma = 0.33$
, and lift coefficient of
 ${C_L} = 0.79$
.
Shape of the propeller and aircraft.

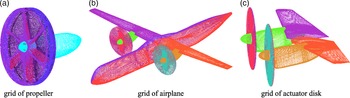
A structural grid is applied for the numerical simulation. The simulation of a single propeller is divided into two domains: the propeller disc domain where the propeller is located and the outer field domain where the engine is located. The coupling of these two domains is realised by the patched grid at the cylindrical surface between the front and rear surfaces of the disc. The grid for the single propeller simulation is shown in Fig. 2(a). The grid of the full aircraft is shown in Fig. 2(b). To apply the actuator disc method, the area of the propeller disc is changed to a disc with a small thickness, as shown in Fig. 2(c).
Simulation grid of propeller and aircraft.

In this paper, ANSYS CFX software is used for numerical simulation. The load distribution obtained by the actuator disc method is applied as a boundary condition to solve the steady RANS, so as to realise the simulation of the propeller slipstream. Steady RANS is applied for the numerical simulation of the full aircraft, and unsteady RANS is applied for the numerical simulation of the single propeller. The turbulence model is the SST model [Reference Menter25].
3.0 Actuator disc method
3.1 Theory of actuator disc method
The basic actuator disc method assumes that the free stream is perpendicular to the propeller disc and only considers the non-uniform distribution of radial load. But in most cases of actual flight conditions, the free stream is not perpendicular to the propeller disc. For example, during takeoff or landing, the free stream has a larger angle-of-attack and the induction effect of lift will also increase the local angle-of-attack. In either of these cases, the distribution of circumferential load on the propeller disc is also non-uniform. Therefore, this paper uses the actuator disc method with non-uniform distribution of radial and circumferential loads [Reference Xia24].
Supposing the rotational angular velocity of the propeller is
 $\omega $
, the propeller has
 $N$
blades; then, we can obtain the rotation period of the propeller is
 $\bar T = 2\pi /\omega $
.
Assuming that there is a micro-element area
 $dS$
at a distance
 $r$
from the propeller hub, the angle at which a blade sweeps the micro-element area is
 $d\theta $
, and the time is
 $dt$
. At another time in a cycle, the blade will never sweep this specific micro-element area. The pulling and the circumferential forces produced by the blade sweeping the area of the micro-element are
 $T$
and
 $F$
, respectively. The micro-element area is
 \begin{align}dS = rd\theta dr\end{align}
After the blade sweeps this specific micro-element area in one cycle, the axial and circumferential momentum changes are generated. The axial momentum change
 $\left( {d{I_a}} \right)$
and the circumferential momentum change
 $\left( {d{I_r}} \right)$
are
 \begin{align}\begin{array}{l}d{I_a} = Tdrdt\\d{I_r} = Fdrdt\end{array}\end{align}
The changes in axial momentum and circumferential momentum after all blades sweeping this specific micro-element area in a period are
 \begin{align}\begin{array}{l}d{I_{ap}} = N \cdot d{I_a}\\d{I_{rp}} = N \cdot d{I_r}\end{array}\end{align}
Assuming that the pressure change of the airflow through the micro-element area is
 $\Delta p$
, the circumferential velocity change is
 $\Delta v$
, the axial and the circumferential momentum changes of the airflow through the micro-element area in a cycle are
 \begin{align}\begin{array}{l}d{I_{ap}} = \Delta p \cdot dS \cdot \bar T\\d{I_{ar}} = \Delta v \cdot (\rho \cdot u \cdot dS) \cdot \bar T\end{array}\end{align}
where
 $\rho $
is the density and
 $u$
is the speed of the airflow at the micro-element area.
 \begin{align}\Delta p = \frac{{N \cdot T}}{{2\pi r}}\end{align}
 \begin{align}\Delta v = \frac{{N \cdot F}}{{2\pi r \cdot \rho u}}\end{align}
Among them, the pulling force
 $T$
and circumferential force
 $F$
at the micro-element can be obtained by integrating the pressure distribution on the surface of the blade.
Based on the above formulas, an actuator disc model with non-uniform distribution of radial and circumferential loads is established, and the radial and circumferential non-uniform aerodynamic loads on the blades are transformed into the non-uniform distribution axial pressure load and circumferential momentum load on the actuator disc.
3.2 Steps of actuator disc method
The actuator disc method with non-uniform distribution of radial and circumferential loads is divided into four steps: unsteady simulation of a single propeller, extracting the blade load distribution, computation of the actuator disc load distribution, and steady simulation of the propeller aircraft. The specific implementation process of each step is as follows.
-
1. Unsteady simulation of a single propeller
The URANS method is used to perform an unsteady simulation of a single propeller to obtain the propeller load distribution in a cycle. As a matter of fact, using unsteady simulation of an installed propeller to obtain the propeller load distribution is more accurate. However, the actuator disc method used in this paper is an approximate method. Considering the simulation cost, the differences between the propeller load distribution obtained by an installed propeller and a single propeller can be accepted. Therefore, a single propeller is used in this paper. For the actuator disc to be constructed, the axial and circumferential momentum during one rotation period should be equal to the momentum exerted by the propeller to the airflow. Therefore, during the simulation, the aerodynamic changes of each grid point on the propeller blade are recorded, thereby obtaining the aerodynamic effect of the propeller. In a single propeller simulation, the stable unsteady simulation must exceed one cycle to obtain a stable propeller load.
-
2. Extracting the load distribution of a blade
The effect of the propeller on the airflow in a period can be decomposed into the effect of each blade in different phases. Therefore, it is required to extract the load distribution of a single blade in different phases. By intercepting multiple slices along the radial direction on a single blade, the pressure distribution of each slice can be obtained. The force components of the slice in the axial and circumferential directions of the propeller, namely the pulling force
 $T$
and the circumferential force
 $F$
, can be obtained by integrating the pressure distribution.
-
3. Computation of the load distribution of the actuator disc
According to the corresponding relationship between the load of the propeller and that of the actuator disc (formulas (5) and (6)), the radial and circumferential non-uniform loads on the blade can be converted into the non-uniform distribution axial pressure load and circumferential momentum load on the actuator disc, thereby transforming the unsteady propeller effect into the steady actuator disc effect.
-
4. Simulation of the full aircraft with actuator disc method
The actuator disc load is introduced to the flow field of the full aircraft as a boundary condition, and then, the numerical simulation is conducted for the full aircraft.
3.3 Verification of actuator disc method
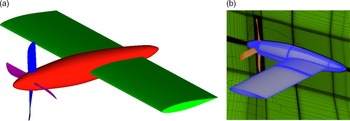
The wing-propeller configuration is used to verify the actuator disc method used in this paper. The diameter of the propeller is 0.64m. Figure 3 shows the validation model and the simulation grid. Grid refinement is carried out in the vicinity of the propeller and in the wake area of the slipstream to obtain a more detailed simulation of the influence of the slipstream.
Model and grid of validation model.

Under sea-level atmospheric conditions with the free stream at 51m/s and the angle-of-attack of 5°, the effect on the wing of a propeller slipstream with a rotating speed of 111.11rev/min is simulated. In the unsteady simulation, the flow field domain is divided into two parts: the stationary domain and the rotating domain. The rotating domain surrounds the propeller, while the rest is a stationary domain. The simulated time step is 1.5e-3s, namely the propeller rotates 1° at each time step.
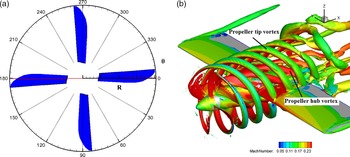
The propeller rotational motion is periodic. In order to more clearly describe the periodic characteristics of the propeller during the rotation period, a blade phase angle
 $\theta $
is defined, as shown in Fig. 4 (left). Observing from the backward direction, when the blade is horizontal and point to the right, the phase angle of the blade is defined as 0°. As the right blade rotates clockwise, the phase angle increases. Through unsteady simulation, a high-precision flow field is obtained. The vortex structure can be obtained through the Lambda-2 criterion [Reference Xu, Long and Ji26]. As shown in Fig. 4 (right), the propeller tip vortex and the propeller hub vortex dragged by the propeller wake can be clearly seen.
Definition of phase angle
 $\theta $
and isosurface of Lambda-2.

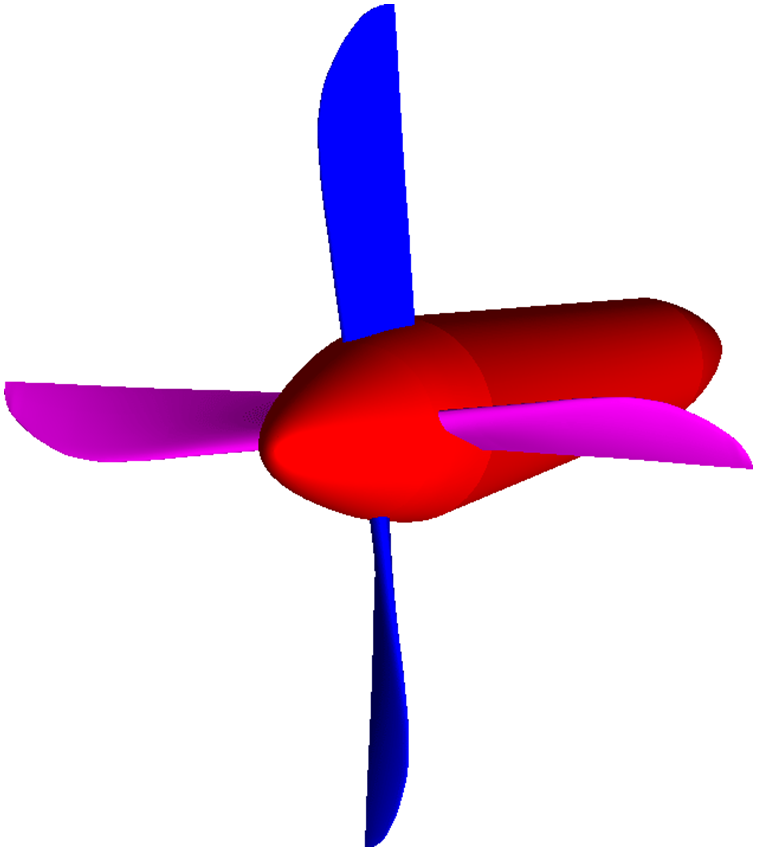
The propeller load distribution is obtained by unsteady simulation of a single propeller. The model of the single propeller is shown in Fig. 5. The imported time-dependent result needs to be a complete and stable rotation period. 41 slices were taken on the horizontal blade. Integrating pressure distributions of these slices, we can obtain the force parallel to the propeller hub and vertical to the blade radius of each slice, and then, we can obtain the load distribution of the blade. Since the interception is performed at each time step, although only one blade is used, the load distribution at different times and different phases of the blade is obtained, which is interwoven into the time-average load distribution of the entire propeller disc.
Model of the single propeller.

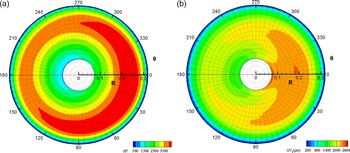
After obtaining the time-averaged load distribution of the propeller disc, the load distribution of the actuator disc can be calculated according to formula (5) and (6), namely the axial pressure load and the circumferential momentum load distribution. The result of the actuator disc load is shown in Fig. 6.
Actuator disc load distribution.

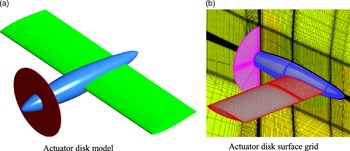
Before using the actuator disc method to simulate, the model needs to be modified. We remove the propeller blades and place a disc with the same diameter as the propeller at the rear edge and keep its thickness as small as possible. This disc is the actuator disc domain, and the rest is the flow field domain. The configuration is shown in Fig. 7(a). Local changes are made on the propeller configuration grid to obtain the actuator disc simulation grid, as shown in Fig. 7(b), which is refined near the actuator disc to ensure the simulation of momentum gradient and pressure gradient.
Actuator disc model and surface grid.

The aerodynamic forces are obtained using the actuator disc method and compared with the time-averaged unsteady simulation results. We compared the wing lift and drag respectively, and the results are shown in Table 1. The results show that the difference in wing lift is small, while the difference in wing drag is slightly larger. But the difference in the two aerodynamic forces is less than 3%.
Comparison of wing aerodynamic forces

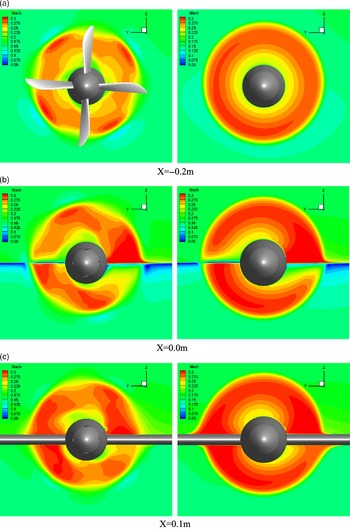
Three slices parallel to the actuator disc are taken, whose positions are shown in Fig. 8. Figure 9 shows the comparison of Mach number contour at the three slices, whose left side is the time-averaged result of the unsteady method and right side is the result of the actuator disc method. Since the angle-of-attack of the free stream is 5°, the effect of the slipstream on the upper and lower surfaces of the wing is inconsistent. The Mach number at the leeward side of the wing leading edge in the upwash area of the slipstream increases significantly, and the actuator disc accurately simulates this feature.
Position of sections.

Comparison of Mach number contour(left: unsteady method, right: actuator disc method).

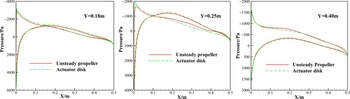
As shown in Fig. 10, the pressure distribution at different positions of the wing is compared. The red line is the time-averaged result of the unsteady method, while the green line is the result of the actuator disc method. It can be seen from the figure that, in the wake area of the propeller, the simulated negative pressure peak of the actuator disc is slightly higher, while on the outside wing, the pressures are in good agreement. This result shows that using the propeller load obtained by unsteady simulation of a single propeller could simulate a propeller aircraft properly. In summary, the actuator disc method used in this paper can be applied to the numerical simulation of a propeller aircraft.
Comparison of pressure distribution in different slices of the wing.

4.0 Results and discussion
4.1 Simulation and analysis of original configuration
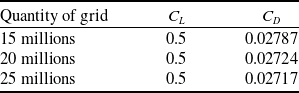
The original configuration is numerically simulated by the actuator disc method established in Section Section 3. And the actuator disc load varies with the flight condition. The original cruise and climb configurations are named Ori_cruise and Ori_climb, respectively. The grid refinement effects have been discussed using the Ori_cruise at design cruise condition. Three quantities of grid have been evaluated in the fixed lift coefficient which is 0.5. Table 2 shows the results. The difference in drag coefficient between 15 millions of grid and 20 millions of grid is larger than 6 counts, while between 20 millions of grid and 25 millions of grid is smaller than 1 count. Therefore, the 25 millions of grid is used in this paper. Furthermore, the design has been carried out in the same quantity of grid, so the error induced by the quantity of grid is not quite important. The design in this paper is focused on the performance increments, not the exact values.
Comparison of aerodynamic forces evaluated by the three quantities of grid

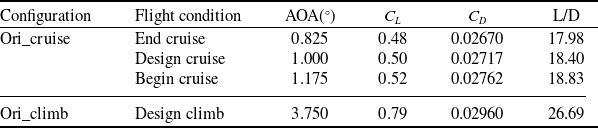
Table 3 shows the simulation results of the original configuration. The lift coefficient at design cruise condition is 0.5, and the angle-of-attack is 1°. The drag coefficient is 0.02717, leading to the lift-to-drag ratio of 18.4. The lift coefficient at begin cruise condition is 0.52, the drag coefficient is 0.02762, and thus, the lift-drag ratio is 18.83. The lift coefficient at end cruise condition is 0.48, and the drag coefficient is 0.0267, resulting in the lift-drag ratio being 17.98. The lift coefficient at design climb condition is 0.79, the angle-of-attack is 3.75°, the drag coefficient is 0.0296, and the lift-to-drag ratio is 26.69. The numerical simulation is converged to a fixed lift for each flight condition.
Aerodynamic coefficients of the original configuration

Figure 11 shows the spanwise circulation distribution of the wing at the design cruise and design climb conditions. In order to analyse the change law of the spanwise circulation distribution, the wing with flap is divided into three segments, according to the relative position of the wing and the propeller. The three segments are the inner side of the propeller hub, the outside of the propeller hub to the outer edge of the propeller blade, and the outside of the propeller. The left segments are named LA, LB, LC from inside to outside, while the right segments are named RA, RB, RC from inside to outside. It can be seen that the trend of the spanwise circulation distribution at the design cruise condition and the design climb condition are similar: on the outermost sides of the left and right wings, the wing’s circulation distribution is smaller than the elliptical circulation distribution. The difference in circulation distribution between the left wing and the ellipse is greater than that between the right wing and the ellipse. The circulation of the left wing gradually increases from outside to inside, and the difference in circulation distribution between the left wing and the ellipse is also increasing. The circulation decreases in the LB segment and then increases sharply, making the circulation at the root of the wing greater than the elliptical circulation distribution. The circulation of the right wing gradually increases from outside to inside, and it increases sharply near the RB segment. It exceeds the elliptical circulation distribution but then drops again, which leads to the circulation smaller than the elliptical circulation distribution. At the wing root, the circulation increases and gradually approaches the elliptical circulation distribution.
Wing spanwise circulation distribution.

In order to explain the spanwise circulation distribution of the wing, we take the local angle-of-attack at the position of the red line in Fig. 12. By shifting the leading edge line of the wing forward by 0.4m, and then shifting down by 0.4m, the position of the red line can be obtained. The red line inside the left engine is named Lwing_line1, while the red line outside the left engine is named Lwing_line2. Similarly, the red line inside the right engine is named Rwing_line1, and the red line outside the right engine is named Rwing_line2.
Lines of the local angle-of-attack.

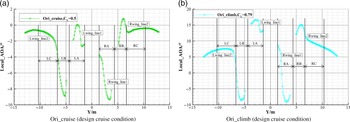
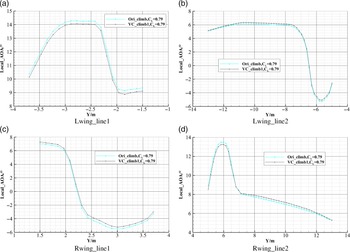
Figure 13 shows the distribution of the local angle-of-attack on the red line of Fig. 12 at design cruise and design climb conditions. It can be seen that the trend of local angles of attack at the design cruise and design climb conditions are similar. Therefore, in this paper, we only analyse the distribution of the local angle-of-attack at the design cruise condition. But the relevant conclusions are also applicable to the design climb condition.
Wing spanwise local angle-of-attack distribution.

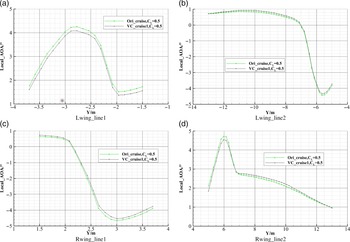
For the design cruise condition, the local angle-of-attack of the flapless part of the left wing remains within 0.7° to 0.85° and that of the right wing remains within 1° to 2°. The local angle-of-attack does not change much along the spanwise direction. This phenomenon shows that the slipstream effect is little on these parts of wing. The local angle-of-attack of the LC segment gradually decreases as the spanwise position approaches the fuselage, and the decreasing rate gradually increases, making the local angle-of-attack decreasing from 0.85° to −1°. It shows that the wing of the LC segment is gradually affected by the propeller rotation effect as the spanwise position approaches the fuselage. Since the wing of the LC segment is outside of the propeller, the rotation propeller induces a downwash, and the downwash speed increases as the spanwise position approaching the fuselage. The wing of the LB segment is located directly behind the left half of the left propeller, so it is in the wake of the propeller slipstream, and the local angle-of-attack shows a trend from initial decreasing to increasing afterward. The local angle-of-attack is reduced from −1° to −4.5° and then increased to −3.8°. The wing of the LA segment is located directly behind the right half of the left propeller, which leads to the wing of this segment being influenced by an upwash induced by the propeller. The local angle-of-attack appears to increase first and then decrease. The local angle-of-attack increases from 1.8° to 4.3° and then decreases to 1.5°. The wing of the RA segment is located on the right side of the right propeller. Since the left and right propellers rotate in the same direction, the wing of this segment is subject to the downwash speed induced by the propeller, and the local angle-of-attack is reduced from −0.6° to −4.7° and then increased to −3.9°. The wing of the RB segment is located on the left half of the right propeller. The local angle-of-attack increases from 2.1° to 4.7° and then decreases to 3.2° due to the upwash induced by the propeller. The wing of the RC segment is located on the outside of the right propeller, and the upwash induced by the propeller is significantly reduced, making the local angle-of-attack decreasing slowly.
Based on the above analysis, it can be concluded that the LB and LC segments are affected by the downwash induced by the propeller, and the local angle-of-attack decreases, causing the spanwise distribution of these two segments to be smaller than the elliptical circulation distribution. The local angle-of-attack needs to be increased by flap deflection to increase the spanwise circulation distribution. The LA segment is affected by the upwash induced by the propeller, and the local angle-of-attack increases, causing the spanwise circulation distribution in this segment to be greater than the elliptical circulation distribution. The local angle-of-attack of this segment needs to be reduced by flap deflection, thereby reducing the spanwise circulation distribution. Similarly, the spanwise circulation distribution of the right wing can also be adjusted by flap deflection.
In addition, the values of the local angle-of-attack in the same segment are quite different in the spanwise distribution. Therefore, a finer adjustment of the circulation along the spanwise direction can be achieved through finer division. In fact, the larger the number of segments, the closer the ability to control the spanwise circulation distribution to the VCCTEF technology. However, for variable camber flap technology, too many segments will bring other problems, including the need for more complex driving mechanisms, handling of gaps between the segments, etc, which are very difficult to be applied. Therefore, in this paper, we divide the flap into three segments based on the distribution law of the local angle-of-attack in the span direction. The segmentation of the flap is consistent with the segmentation criterion in analysing the spanwise circulation distribution in the previous paper. Figure 14 shows the flap segmentation.
Schematic of flap segmentation.

4.2 Simulation and analysis of variable camber configuration
Each segment of the flap is deflected separately to obtain a variable camber configuration. After the flaps are deflected, the spoiler deflects and laps on the flaps to ensure the continuity of the upper surface of the wing. And there are no gaps between each segment of flap. In order to facilitate the modelling, the spoiler was not modelled separately, but integrated with the deflected flaps. The variable camber flap technology realises the change of camber through the deflection of the flaps. The large-angle deflection will cause the problem of a significant increase in shape resistance, and thus, the variable camber flap technology is normally applied with a small deflection angle. The downward deflection of the flaps can increase the local camber, thereby increasing the local angle-of-attack and increasing the circulation distribution, and vice versa.
Through the analysis of circulation distribution and local angle-of-attack distribution, the LC and LB segments of flap need to deflect downwards, while the LA segment of flap needs to deflect upwards. The RC segment of flap needs to deflect downwards, while the RA and RB segments of flap need to deflect upwards. Since the free stream velocity at the design climb condition is smaller and the propeller rotation speed is higher, the wash flow effect induced by the propeller is stronger, and the influence on the local angle-of-attack is also greater. Therefore, the flap deflection angles should be greater than that at the cruise condition.
Table 4 shows the deflection angles of each segment of flap at the first round of variable camber design. We define the downward deflection as positive and the upward deflection as negative. The designed variable camber cruise configuration at the first round is named VC_cruise1, and the variable camber climb configuration is named VC_climb1.
Deflection angles of the six segments of flap

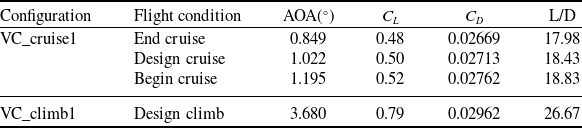
Table 5 shows the simulation results of the designed configurations in the first round. Compared with the original configuration, the drag coefficient at begin cruise condition is reduced by 0.1 counts, while it is reduced by 0.4 counts at design cruise condition. The drag coefficient at end cruise condition remains unchanged. The lift-to-drag ratio at the begin cruise condition remains unchanged as that at end cruise condition and increases by 0.03 at design cruise condition. The drag coefficient at design climb condition increases by 0.2 counts, and the lift-to-drag ratio decreases by 0.02. The lift-drag characteristics of the three cruise conditions have little improvement, while they decrease at the design climb condition.
Aerodynamic coefficients of first-round variable camber configuration

Figures 15 and 16 show the comparisons of the local angle-of-attack distribution between the design cruise condition and the design climb condition of the first-round designed variable camber configuration. In order to clearly see the difference, the local angles of attack at the four lines are displayed in different figures. Since the angle-of-attack of the variable camber configuration at design cruise condition has increased by 0.022°, the local angles of attack of the VC_cruise1 configuration in Fig. 15 are moved down by 0.022°. Similarly, the local angles of attack of VC_cruise1 configuration in Fig. 16 are moved up by 0.07° evenly. It can be seen that after each segment of flap deflects, the local angles of attack have a certain change. For the design cruise condition, the LA segment of flap is deflected by −1°, leading to a significant reduction of the local angle-of-attack of Lwing_line1. The LB and LC segments of flap are deflected by 0.4°, leading to an increase of the local angle-of-attack of Lwing_line2. The RA segment of flap is deflected by 0.4°, leading to an increase of the local angle-of-attack of Rwing_line1. The RB and RC segments of flap are deflected by −1° and 0.4,° respectively, making the local angle-of-attack of Rwing_line2 first decreasing and then increasing. The distribution law of the local angle-of-attack of the design climb condition is similar. This result shows that the goal of adjusting the local angle-of-attack by deflecting the flaps has been realised.
Comparison of wing spanwise local angle-of-attack distribution (design cruise condition).

Comparison of wing spanwise local angle-of-attack distribution (design climb condition).

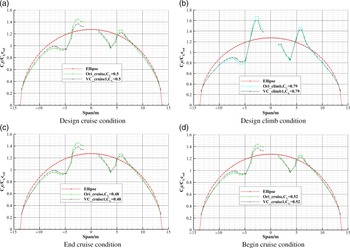
Figure 17 shows the comparisons of the spanwise circulation distribution of the wing under different flight conditions. It can be seen that after each segment of flap deflects, the spanwise circulation distributions of variable camber cruise configuration at the three conditions and that of variable camber climb configuration at one condition are all closer to the elliptical circulation distribution, and they are very similar. Taking the design cruise condition as an example, we can see the LB and LC segments of flap are deflected by 0.4°, making the cambers increasing, and thus the circulations increase. The LA segment of flap is deflected by −1°, making the camber reducing, and thus, the circulation decreases. The RA and RC segments of flap are deflected by 0.4°, making the cambers increasing, and thus, the circulations increase. The RB segment of flap is deflected by −1°, making the camber decreasing, and thus, the circulation decreases.
Wing spanwise circulation distribution.

From the results of the designed configuration at the first round, it can be seen that although the circulation distribution is adjusted by flaps deflection to make it closer to the elliptical circulation distribution, the lift-drag ratio has not been significantly improved and even decreased at design climb condition. The reason might be that although the designed circulation distribution is beneficial to reduce the induced drag since it is closer to the elliptical distribution, the profile drag increase when the flaps are deflected. The profile drag increase offsets the decrease in the induced drag due to the high flap deflection angle. In order to verify the authors’ conjecture, the authors reduce the flap deflection angle, based on the analysis of design results of the first round. After multiple rounds of design, a better design result is finally obtained. Table 6 shows the deflection angles of each segment of the flap. The final variable camber cruise configuration is named VC_cruise, and the variable camber climb configuration is named VC_climb.
Deflection angles of the six segments of flap

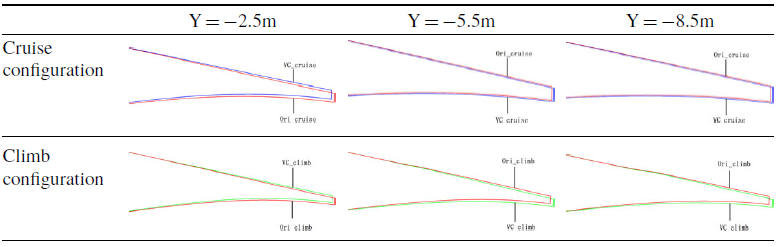
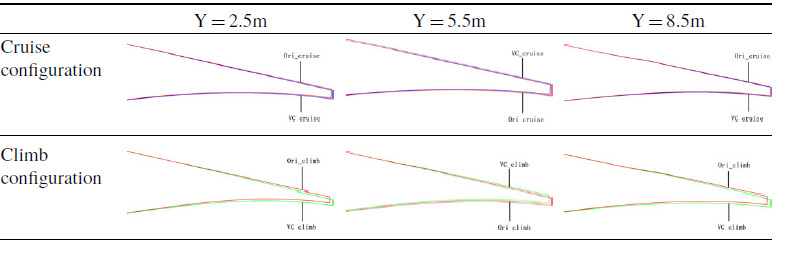
In order to obtain an intuitive understanding of the shape change of the variable camber configuration, we intercept the slices at Y = −2.5m, Y = −5.5m, Y = −8.5m, and Y = 2.5m, Y = 5.5m, Y = 8.5m on the wing to see corresponding aerofoils. We compare the cruise and climb configurations after deflecting the flaps with the original configuration. Figure 18 shows the spanwise position of each slice on the wing. Here Y = −2.5m is located in the LA segment, Y = −5.5m is located in the LB segment, and Y = −8.5m is located in the LC segment. Correspondingly, Y = 2.5m, Y = 5.5m, Y = 8.5m are located in RA, RB, and RC segments, respectively. Tables 7 and 8 show the comparisons of the trailing edge of the six slices. The difference in the shape of the trailing edge after each segment of flap deflection can be seen from the figure.
Position of slices on the wing.

Comparison of the shape of the trailing edge of the left wing

Comparison of the shape of the trailing edge of the right wing

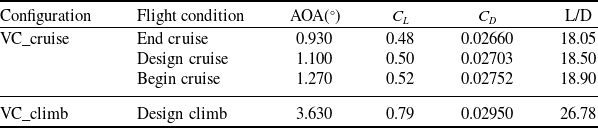
Table 9 shows the simulation results of the final designed configuration. For VC_cruise, the angle-of-attack at design cruise condition is 1.1°, the drag coefficient is 0.02703, leading to the lift-to-drag ratio of 18.5. The drag coefficient relative to Ori_cruise is reduced by 1.4 counts, and the lift-to-drag ratio is increased by 0.1. The angle-of-attack at begin cruise condition is 1.27°, the drag coefficient is 0.02752, leading to the lift-to-drag ratio of 18.9. Compared to Ori_cruise, the drag coefficient is reduced by 1 count, and the lift-drag ratio is increased by 0.07. The angle-of-attack at end cruise condition is 0.93°, and the drag coefficient is 0.0266, making the lift-drag ratio to be 18.05. Compared with Ori_cruise, the drag coefficient decreases by 1 count, and the lift-drag ratio increases by 0.07. For VC_climb, the angle-of-attack at design climb condition is 3.63°, and the drag coefficient is 0.0295, resulting in the lift-to-drag ratio being 26.78. Compared with Ori_climb, the drag coefficient is reduced by 1 count and the lift-to-drag ratio is increased by 0.09. This result shows that the application of the variable camber flap technology into the wing design of a turboprop aircraft can improve the overall aerodynamic performance.
Aerodynamic coefficients of final variable camber configuration

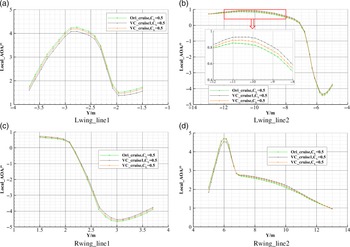
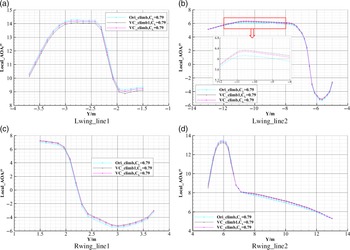
Figures 19 and 20 are the comparisons of the local angle-of-attack distribution at the design cruise and the design climb conditions. Since the angle-of-attack at design cruise condition increases by 0.1°, the local angles of attack of VC_cruise in Fig. 19 move down by 0.1°. Since the angle-of-attack at design climb condition has decreased by 0.12°, the local angles of attack of the VC_climb in Fig. 20 move up by 0.12°. It can be seen that the local angles of attack of VC_cruise are between the angle values of Ori_cruise and VC_cruise1. It indicates that, after the flap deflection angles are reduced, the change of the local angle-of-attack also decreases, but it still satisfies the improvement of the local angle-of-attack of each segment. The results at design climb condition are similar.
Comparison of wing spanwise local angle-of-attack distribution(design cruise condition).

Comparison of wing spanwise local angle-of-attack distribution(design climb condition).

Figure 21 shows the comparisons of the circulation distribution of the wing under different flight conditions. It can be seen that the circulation distributions of VC_cruise are between that of Ori_cruise and VC_cruise1. Compared to Ori_cruise, they are closer to the elliptical ring distribution, while compared to VC_cruise1, they are otherwise. The circulation distribution of VC_climb is the same. Based on this, we can conclude that using the variable camber flap technology to adjust the circulation distribution can realise the drag reduction of the propeller aircraft. But the flap deflection angle cannot be too large, and it can be determined by optimal design.
Wing spanwise circulation distribution.

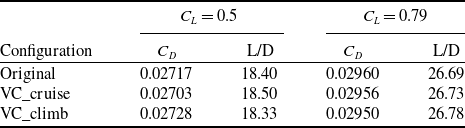
This result arouses a question: why not design the wing as the shape after flaps deflection from the beginning? To answer this question, we evaluate the variable camber cruise configuration at design climb condition, as well as the variable camber climb configuration at design cruise condition. Table 10 gives the comparison of aerodynamic forces. The results show that the drag coefficient of the variable camber cruise configuration at design climb condition is 0.02956. Compared with the original configuration, the drag coefficient is reduced by 0.4 counts and the lift-to-drag ratio is increased by 0.04. However, compared with the variable camber climb configuration, the drag coefficient is increased by 0.6 counts, and the lift-to-drag ratio decreases by 0.05. The drag coefficient of the variable camber climb configuration at design cruise condition is 0.02728, which is 1.1 counts higher than the original configuration, and the lift-to-drag ratio decreases by 0.07. Compared to the variable camber cruise configuration, the drag coefficient increases by 2.5 counts, and the lift-to-drag ratio decreases by 0.17. This result shows that if the wing is initially designed as a variable camber cruise configuration, the climb and cruise performance can be improved, and the climb performance can be further improved by the variable camber flap technology. If the wing is initially designed as a variable camber climb configuration, the climb performance can be improved, but the cruise performance will be reduced. Therefore, the variable camber flap technology has application value in the wing design of propeller aircraft.
Comparison of aerodynamic forces

5.0 Conclusion
This paper uses the actuator disc method with non-uniform distribution of radial and circumferential loads to numerically simulate the propeller aircraft and applies the variable camber flap technology into the design of the propeller aircraft wing to realise drag reduction. First of all, we theoretically deduced the actuator disc method with non-uniform distribution of radial and circumferential loads and established the simulation method. Next, we introduce the implementation steps of the actuator disc method in detail. Finally, we verify the actuator method established in this paper using a wing-propeller configuration. The actuator disc results were compared with the unsteady results. The Mach number contour of the propeller disc and the pressure distribution of the wing were compared, respectively, which verified the reliability of the actuator disc method.
We performed variable camber design on a well-designed twin-engine propeller aircraft, including design cruise and design climb conditions. The results show that by segmenting the flap and adjusting the deflection angles of different segments of flap, drag reduction in design cruise and climb conditions can be realised. The drag coefficient at design cruise condition reduces by 1.4 counts and the lift-to-drag ratio increases by 0.1. The drag coefficient at design climb condition reduces by 1 count, and the lift-to-drag ratio increases by 0.09. The variable camber cruise configuration is evaluated at begin cruise and end cruise conditions. At both conditions, the drag coefficients reduce by 1 count, and the lift-to-drag ratios increase by 0.07. In addition, a larger flap deflection angle can make the circulation distribution closer to the elliptical circulation distribution, but it is not beneficial to the lift-drag ratio. The flap deflection angle can be determined through optimal design.
Finally, we evaluate the variable camber cruise configuration at design climb condition, as well as the variable camber climb configuration at design cruise condition. For the variable camber cruise configuration, the drag coefficient at design climb condition is reduced by 0.4 counts and the lift-to-drag ratio is increased by 0.04 compared to the original configuration. However, compared to the variable camber climb configuration, the drag is increased by 0.6 counts and the lift-drag ratio is reduced by 0.05. Compared to the original configuration, the drag coefficient of the variable camber climb configuration at design cruise condition increases by 1.1 counts, and the lift-to-drag ratio decreases by 0.07. Compared with the variable camber cruise configuration, the drag increases by 2.5 counts, and the lift-to-drag ratio decreases by 0.17. It proves that the variable camber flap technology has application value in the drag reduction of propeller aircraft.