

INTRODUCTION
Human-induced introduction of bivalves, e.g. mytilids and dreissenids, has caused serious impacts on native ecosystems and industries in many countries (see Gosling, Reference Gosling and Gosling1992; Nalepa & Schloesser, Reference Nalepa and Schloesser1992). Competitive exclusion of native species, ecosystem alternation by the exotic species, and other ecological aspects of the invasion have been studied by many researchers (e.g. Dexter & Crooks, Reference Dexter and Crooks2000; Williams et al., Reference Williams, Ebert and Allen2005). There have been, however, few studies about coexistence mechanisms of native and exotic bivalves with similar niches based on comparison of ecological traits between these bivalves (Harger, Reference Harger1970, Reference Harger1972; Griffiths & Hockey, Reference Griffiths and Hockey1987; Safriel & Sasson-Frostig, Reference Safriel and Sasson-Frostig1988; Van Erkom Schurink & Griffiths, Reference Van Erkom Schurink and Griffiths1990; Griffiths et al., Reference Griffiths, Hockey, Van Erkom Schurink and Le Roux1992).
The mytilid Musculista senhousia is native to coastal waters from southern Siberia through mainland China and Japan to south-eastern Asia (Morton, Reference Morton1974; Kimura & Sekiguchi, Reference Kimura and Sekiguchi1993). This mytilid that was introduced to the Mediterranean, the Pacific coasts of North America, Australia, and New Zealand has established permanent populations that have profound impacts on native ecosystems (Crooks, Reference Crooks1998). In Japan, this mytilid is commonly and abundantly found along the coasts from Hokkaido (northern Japan) to Kyushu (southern Japan). On the other hand, another mytilid Xenostrobus securis is exotic to Japanese coasts (it was erroneously identified with Limnoperna fortunei kikuchii in previous studies; see Kimura et al., Reference Kimura, Tabe and Shikano1999) and is now common and abundant together with M. senhousia (Kimura et al., Reference Kimura, Tabe and Shikano1999). This mytilid was introduced probably from Australia and/or New Zealand in the 1970s and to Italy in the 1990s and to Spain and Korea in the 2000s (Lazzari & Rinaldi, Reference Lazzari and Rinaldi1994; Garci et al., Reference Garci, Trigo, Pascual, González, Rocha and Guerra2007; Shirafuji & Sato, Reference Shirafuji and Sato2003). These two mytilids are classified as obligate suspension filter feeders and are usually found on muddy sediments in eutrophicated bays and estuaries, where they often form characteristically large colonies or mats on the sediments (Kimura, Reference Kimura1994). Such dense colonies or mats almost completely entrap the individuals, which are anchored in position and to each other by well-developed byssus (Morton, Reference Morton1974; Ito & Kajihara, Reference Ito and Kajihara1981a, Reference Ito and Kajiharab; Kimura & Sekiguchi, Reference Kimura and Sekiguchi1996a).
In the brackish Lake Hamana located along the Pacific coast of central Japan, M. senhousia was dominant among fouling organisms and among benthos on tidal flats before 1974 (Kajihara et al., Reference Kajihara, Hirano and Chiba1976). Then, X. securis was introduced into the lake during the period 1974–1979. Since then these two mytilids have predominated among fouling organisms and benthos on tidal flats in the lake (Kajihara et al., Reference Kajihara, Hirano and Chiba1976; Abdel-Razek et al., Reference Abdel-Razek, Chiba, Kurokura and Hirano1993a, Reference Abdel-Razek, Chiba, Kurokura and Hiranob; Kimura, Reference Kimura1994). Because these two mytilids have similar life forms and niches, they may compete for habitats available in the lake (Kimura, Reference Kimura1994). According to Kimura & Sekiguchi (Reference Kimura and Sekiguchi1996a) who succeeded in culturing larval and post-larval stages of these mytilids at different temperatures in the laboratory, they showed marked differences in early life histories (e.g. larval growth, planktonic life period and size at larval settlement). This is contrasted with similar life history characteristics during their benthic stages.
In this study, we compared spatio-temporal distributions of individuals after larval recruitment between M. senhousia and X. securis based on their cohort separation to elucidate the mechanisms by which benthic populations of these two mytilids exist together in the lake.
MATERIALS AND METHODS
Study area
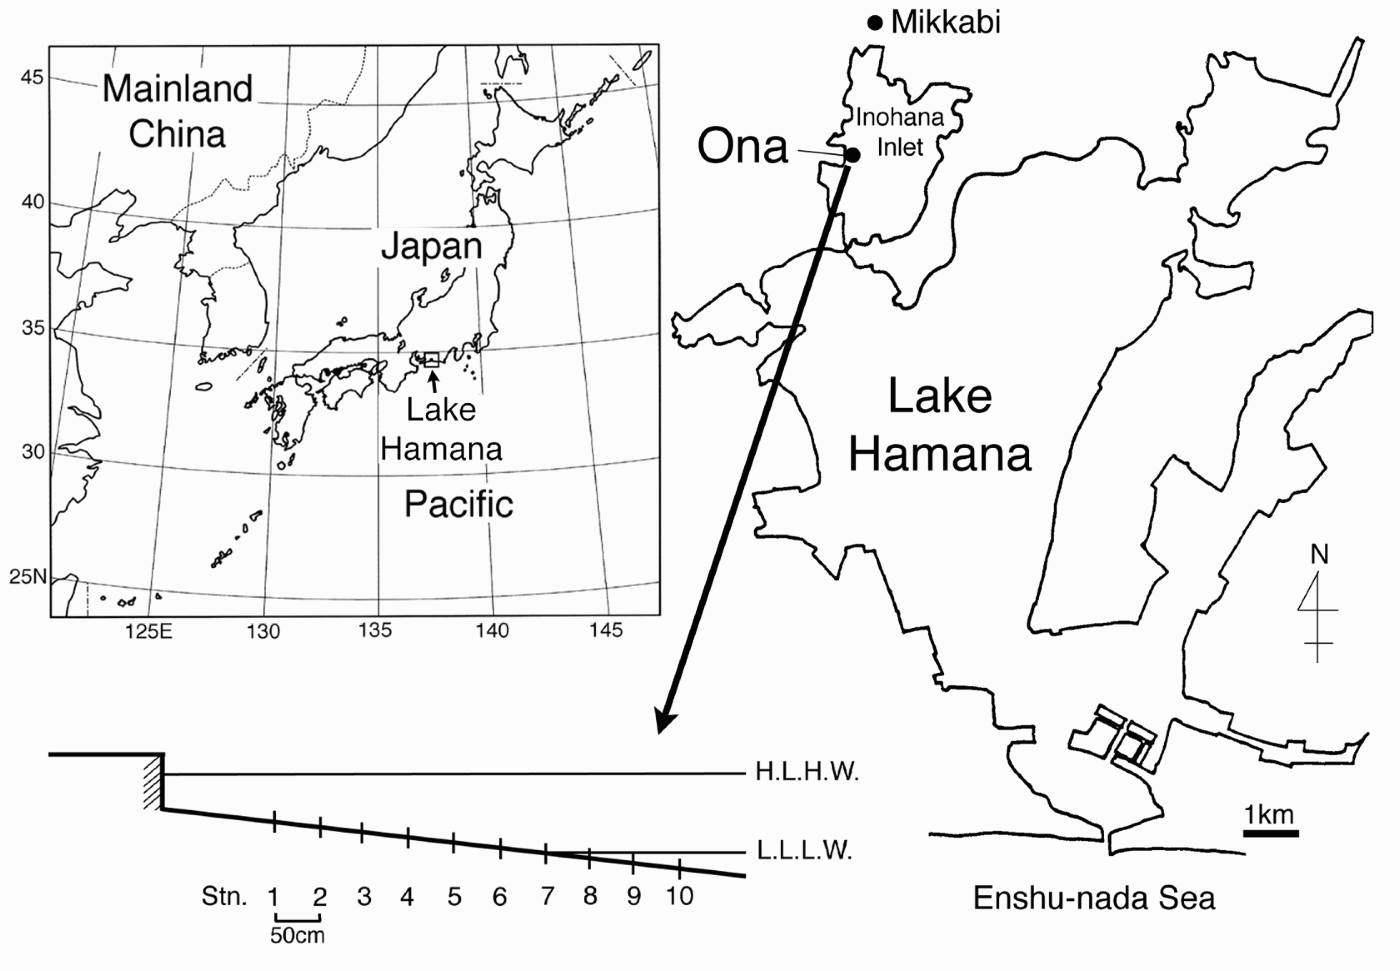
Lake Hamana is located along the Pacific coast of central Japan (Figure 1), covering a surface area of 74 km2 with a mean depth of 2.5 m in the southern part and 7.2 m in the northern part. The lake is connected with the Enshu-nada Sea (north of the Kuroshio Current) through a passage 200 m wide and 3 m deep. Lake Hamana is famous for floating cage cultures of oyster and also clam fisheries (including Ruditapes philippinarum). Considerable surface area of the lake is occupied by floating cage systems for culturing oyster. However, because of eutrophication due to discharges from towns around the semi-enclosed lake, the brackish water in Lake Hamana, including Inohana Inlet, have become turbid, and red tides, as well as the oxygen-poor water just above the bottom, have often been observed through a year, particularly during the summer (Kimura & Sekiguchi, Reference Kimura and Sekiguchi1996b).
Study area and sampling locations within Inohana Inlet, Lake Hamana, along the Pacific coast of central Japan.

The study area was in the intertidal to subtidal zones of the Ona area within Inohana Inlet (one of several inlets within Lake Hamana) covering a surface area of 6.9 km2 with an average depth of 5 m in the central part. This inlet is located in the innermost part of Lake Hamana, and is connected with the other parts of the lake by a passage 100 m wide and >12 m deep (Figure 1; Mazda, Reference Mazda1982; Fujimura & Mazda, Reference Fujimura and Mazda1983).
To sample benthic stages of mytilids, we set sampling points on a fixed transect line extending from the intertidal zone down to the upper subtidal zone in the Ona area: points 1–7 in the intertidal zone (from H.L.H.W. to L.L.L.W.) and points 8–10 in the subtidal zone (below L.L.L.W.) (Figure 1). These sampling points (except for point 5) have bottom sediments of fine sand/mud-mixed gravels, whereas point 5 had artificial flattened rocks on the bottom. We tried to set a pair of transect lines parallel to each other, but cancelled such transect lines due to bureaucratic problems around the Ona area, so we did a preliminary survey on bottom sediments near the above fixed transect line before launching our studies, and then confirmed similar sediments on the bottom near this fixed transect line except for point 5 where flattened rocks were found.
Sampling of bivalves
For sampling the benthic stages of mytilids, we set up 10 sampling points (points 1–10) at intervals of 50 cm on a fixed transect extending from the intertidal zone down to the subtidal zone within the Ona area along the western coast of Inohana Inlet (Figure 1). We collected surface sediments for sampling mytilid individuals because both M. senhousia and X. securis dwell mainly on the sediment surface throughout their benthic stages. Two sediment samples were collected at each sampling point once a month from July 1991 to August 1993: surface sediments (<2.0 cm deep) were collected using a core sampler (covering 44.2 cm2) and immediately fixed with 10% formalin–seawater after filtering these sediments using a mesh (mesh opening 1.0 mm), that indicate to collect individuals after larval recruitment.
Definitions of ‘recruitment’ vary depending on research fields and/or target species: definitions of recruitment in marine organisms vary among taxa, but it is well known that higher mortality occurs at and shortly after planktonic larvae settling on the bottom sediment, followed by a relatively constant and low mortality. Higher mortality at larval recruitment and shortly after larval recruitment has been confirmed for several bivalve species by Miyawaki & Sekiguchi (Reference Miyawaki and Sekiguchi1999) and Nanbu et al. (Reference Nanbu, Mizuno and Sekiguchi2008). In this study, we defined larval recruitment as individuals getting shell lengths of 1.0 mm and more following Miyawaki & Sekiguchi (Reference Miyawaki and Sekiguchi1999) and Ishii et al. (Reference Ishii, Kawakami, Sekiguchi, Nakahara and Jinnai2001).
Data processing
Densities of M. senhousia and X. securis, respectively, were referred to as ind/cm2: two samples were pooled to calculate density of these mytilids. Based on these data over all sampling points, spatio-temporal variation in densities of these mytilids was examined throughout the survey period. Shell lengths of individuals were measured to the nearest 0.1 mm with a calliper. On the basis of shell length–frequency histograms using individuals collected at all sampling points (because shell length histograms at each sampling point were similar to each other for each mytilid), we identified different cohorts according to Akamine (Reference Akamine1985) and Aizawa & Takiguchi (Reference Aizawa and Takiguchi1999), who separated polymodal distributions into multiple normal distributions to calculate the mean shell length and standard deviation of each cohort. We estimated the density of different cohorts based on cohort separation and the surviving curves of different cohorts. Then, we estimated the growth curves of different cohorts based on temporal changes in the average shell length of each cohort. In this study, the year 1991 indicates the period from July 1991 to June 1992 while the year 1992 is from July 1992 to June 1993.
Environmental conditions
Environmental conditions (water temperature, salinity and chlorophyll-a concentration) were measured in the surface water at a sampling point close to a shoreline during the low tide once a week from July 1991 to August 1993. Salinity (psu) was measured using a salinometer (TSK, Tsurumi Seiki Ltd., Yokohama, Japan). We measured the chlorophyll-a concentration (µg/l) after filtering a surface water sample of 0.5–1.0 l with a Whatman G/F filter (mean pore size 1.0 µm) following the Oceanographic Society of Japan (1990). Weekly rainfall data (mm/week) around the Ona area were obtained from the Mikkabi Weather Observatory in Hamamatsu city close to Lake Hamana (see Figure 1 for location).
RESULTS
Temporal variation in environmental conditions
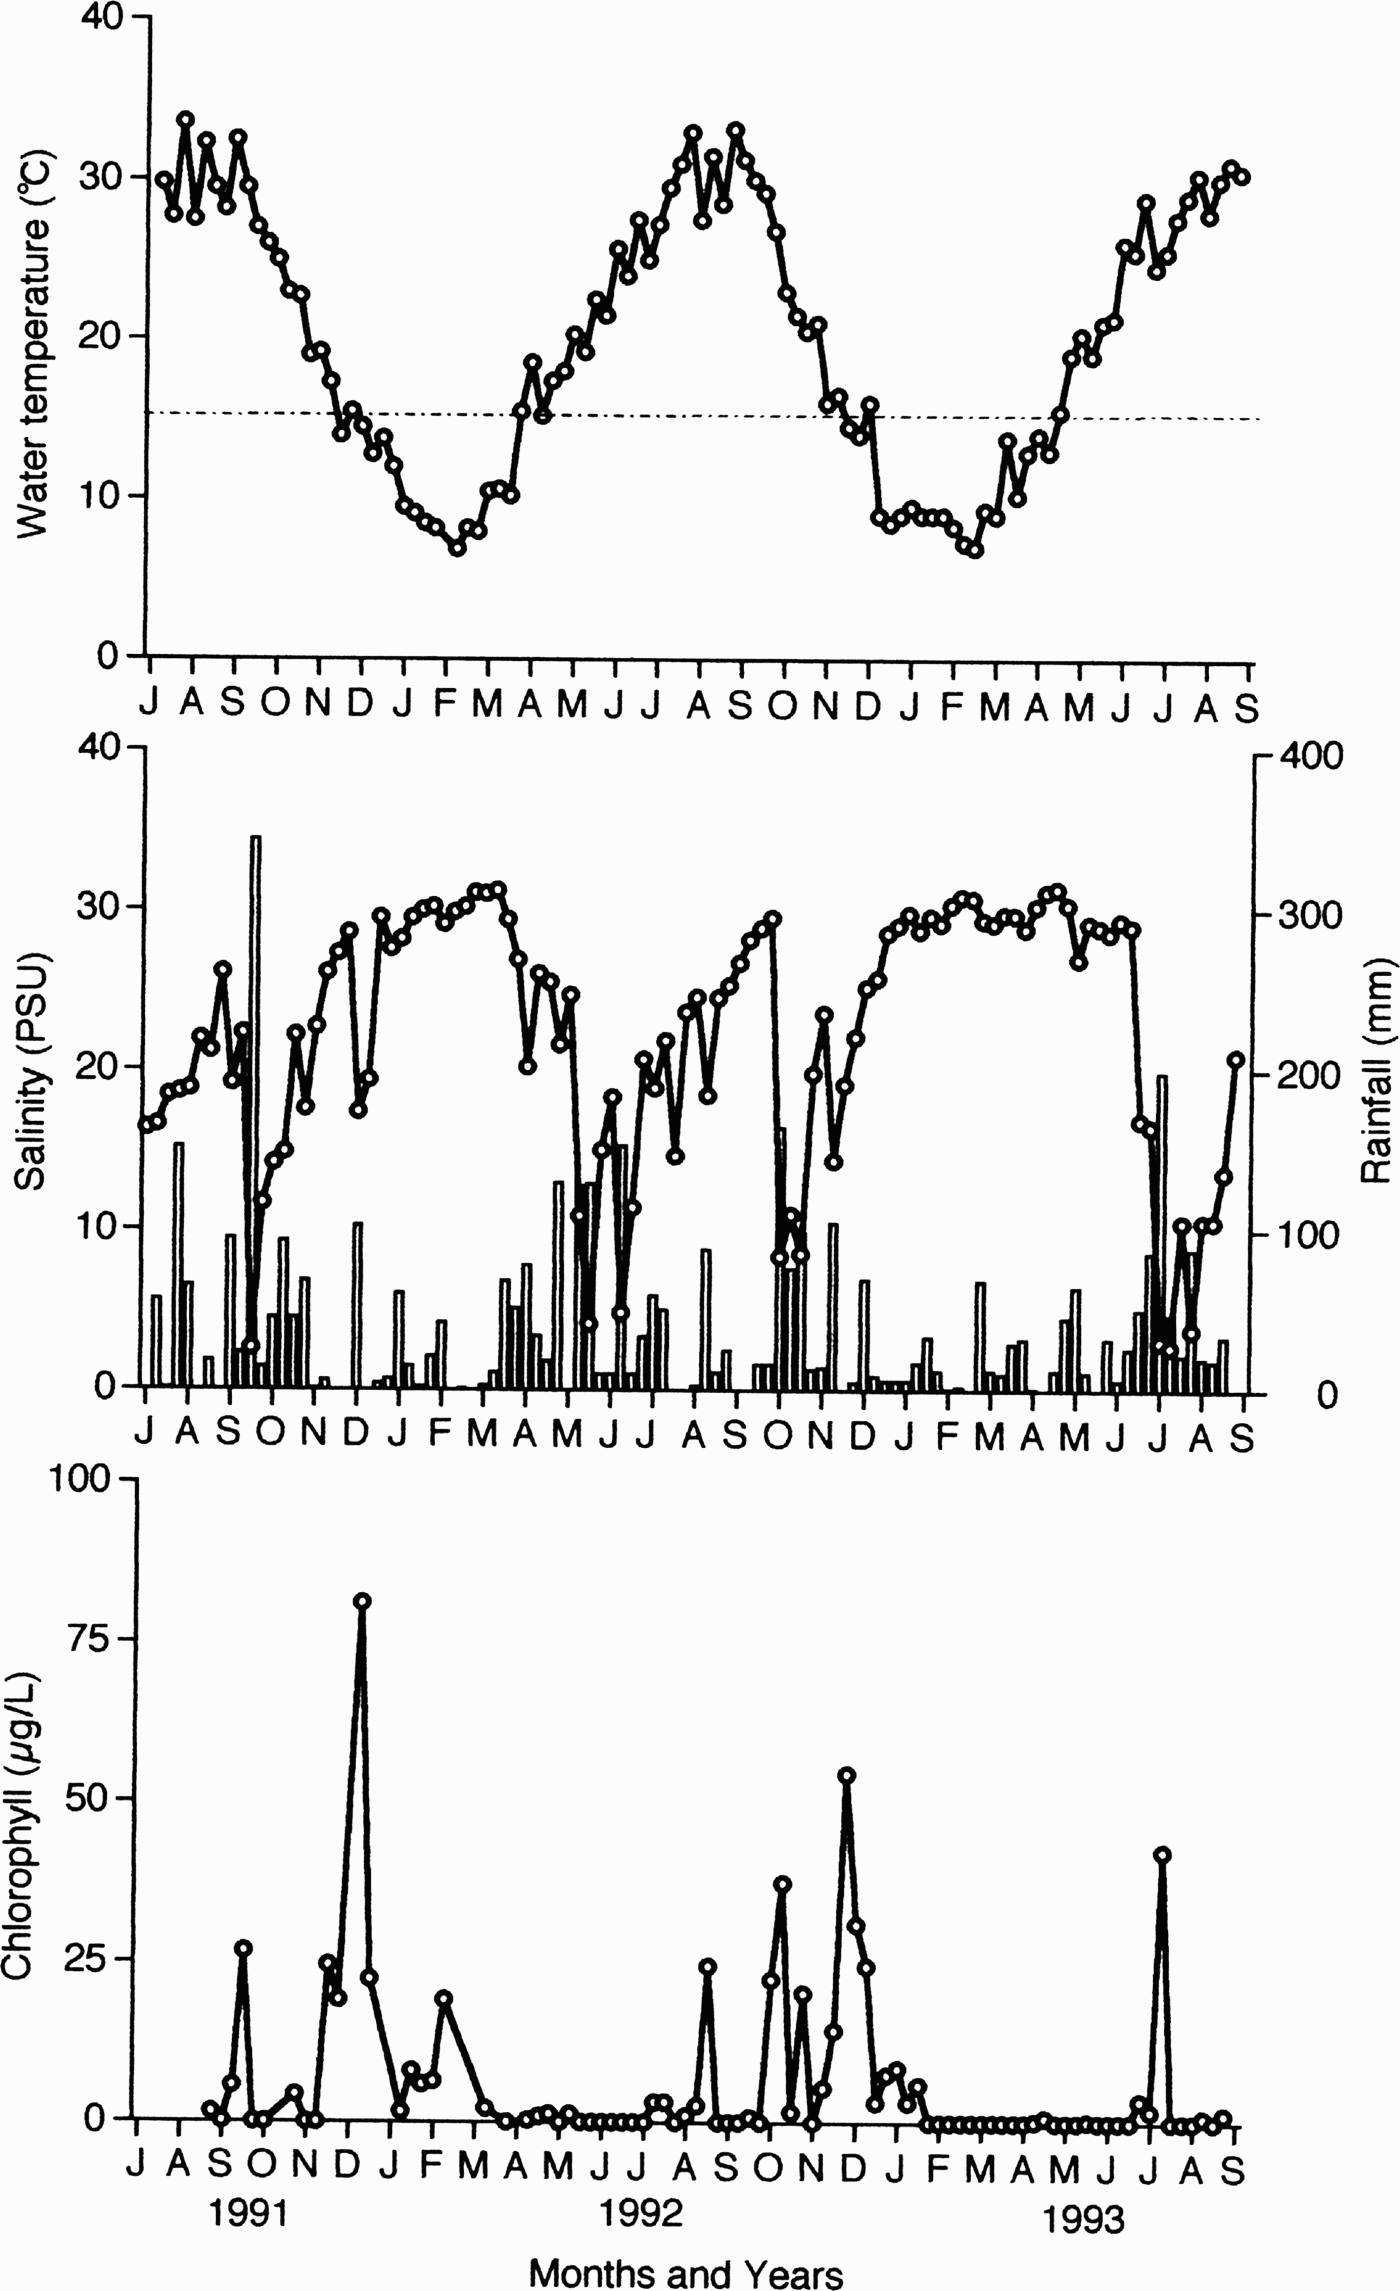
Temporal variation in environmental conditions is shown in Figure 2. Water temperature increased to >30°C (the highest 33.6°C) from January–August, and then decreased down to <10°C (the lowest 6.9°C) toward February. Salinity was in the range of 2.6–31.3 psu: marked variation in salinity, particularly rapid decreasing, twice a year, was observed during and after high rainfall exceeding 100 mm/week in spring and autumn, whereas salinity was almost stable in winter when rainfall was low. Chlorophyll-a concentration did not show seasonal/monthly variation similar to that of water temperature: it was much higher except for the period from March–June: extraordinarily high concentration exceeding 15 µg/L (usually defined as red tide) was often detected from July–December, indicating severe eutrophication issues in Inohana Inlet. There were not significant differences in each of the above environmental conditions (except for salinity) between two years (Figure 3; Mann–Whitney U-test, P > 0.05).
Seasonal and interannual variations in environmental conditions (water temperature, salinity, rainfall and chlorophyll-a concentration) in Inohana Inlet, Lake Hamana. Horizontal line in the upper panel indicates 15°C below the planktonic larvae of Musculista senhousia and Xenostrobus securis are difficult to get competent enough to settle/metamorphose to benthic juveniles on the bottom. Open column and circles indicate rainfall and salinity, respectively.

Comparison of environmental conditions in Inohana Inlet, Lake Hamana between two years 1991 and 1992. W.T., Sal, Rain and Chl indicate water temperature (°C), salinity (psu), rainfall (mm/week) and chlorophyll-a concentration (µg/L), respectively. Columns with vertical line indicate averages with SE. *: P < 0.05, Mann–Whitney U-test. 1991: July 1991–June 1992, 1992: July 1992–June 1993.

Spatial distributions of Musculista senhousia and Xenostrobus securis
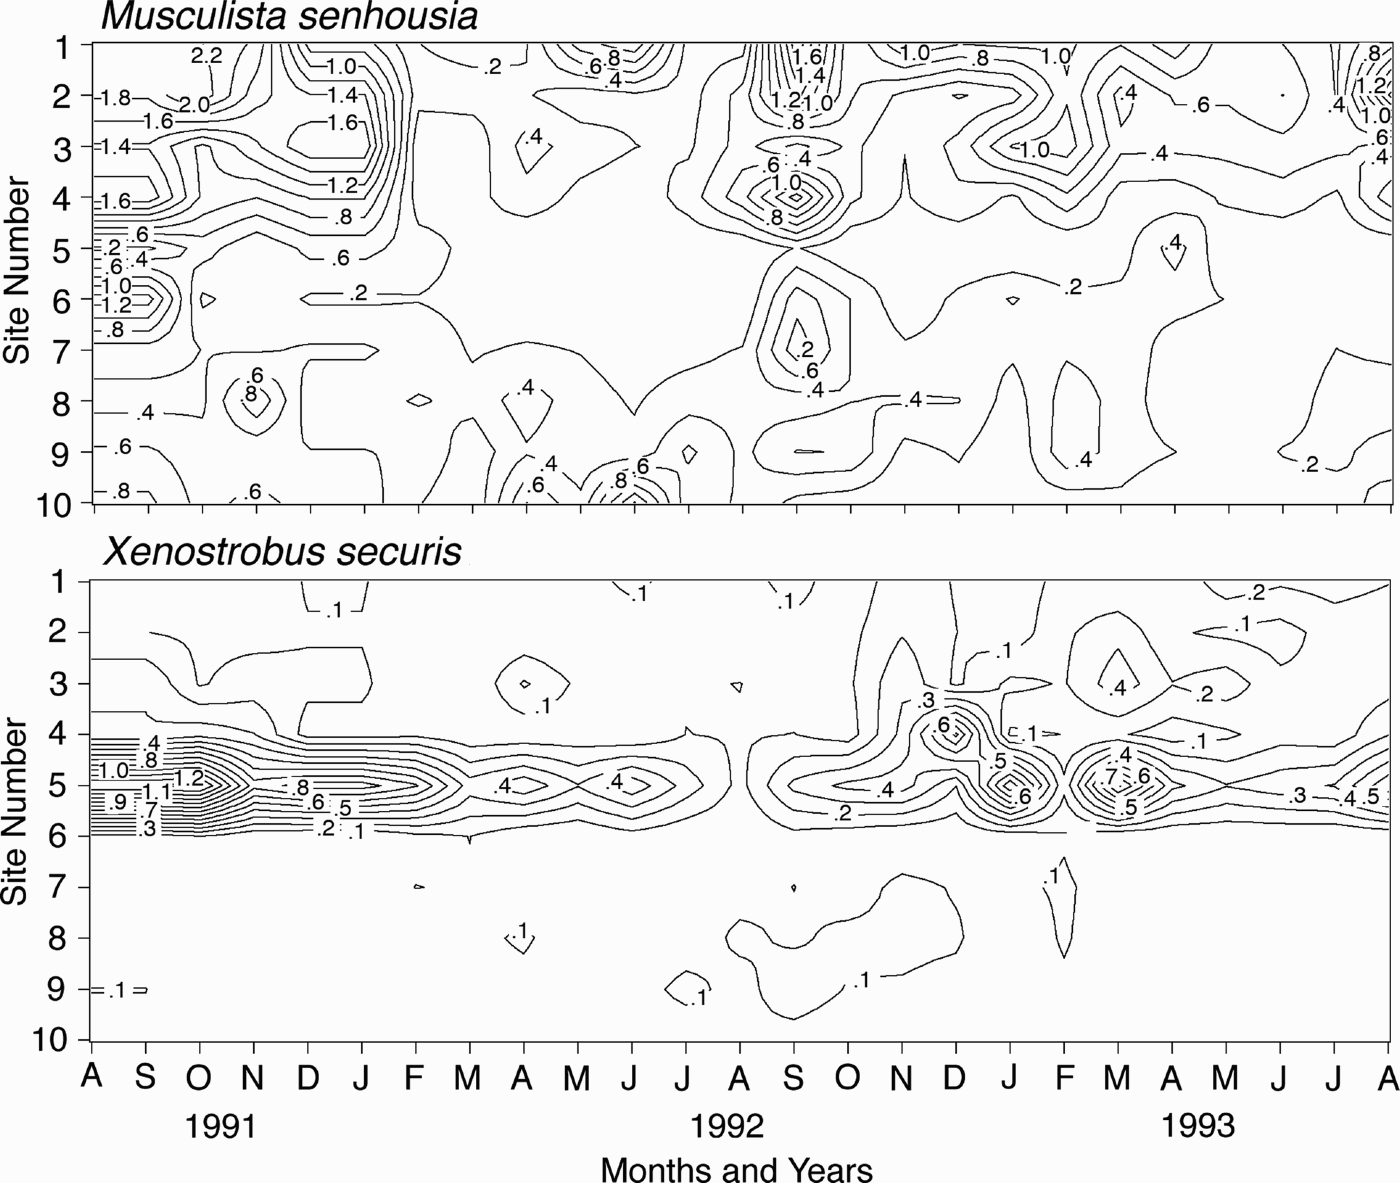
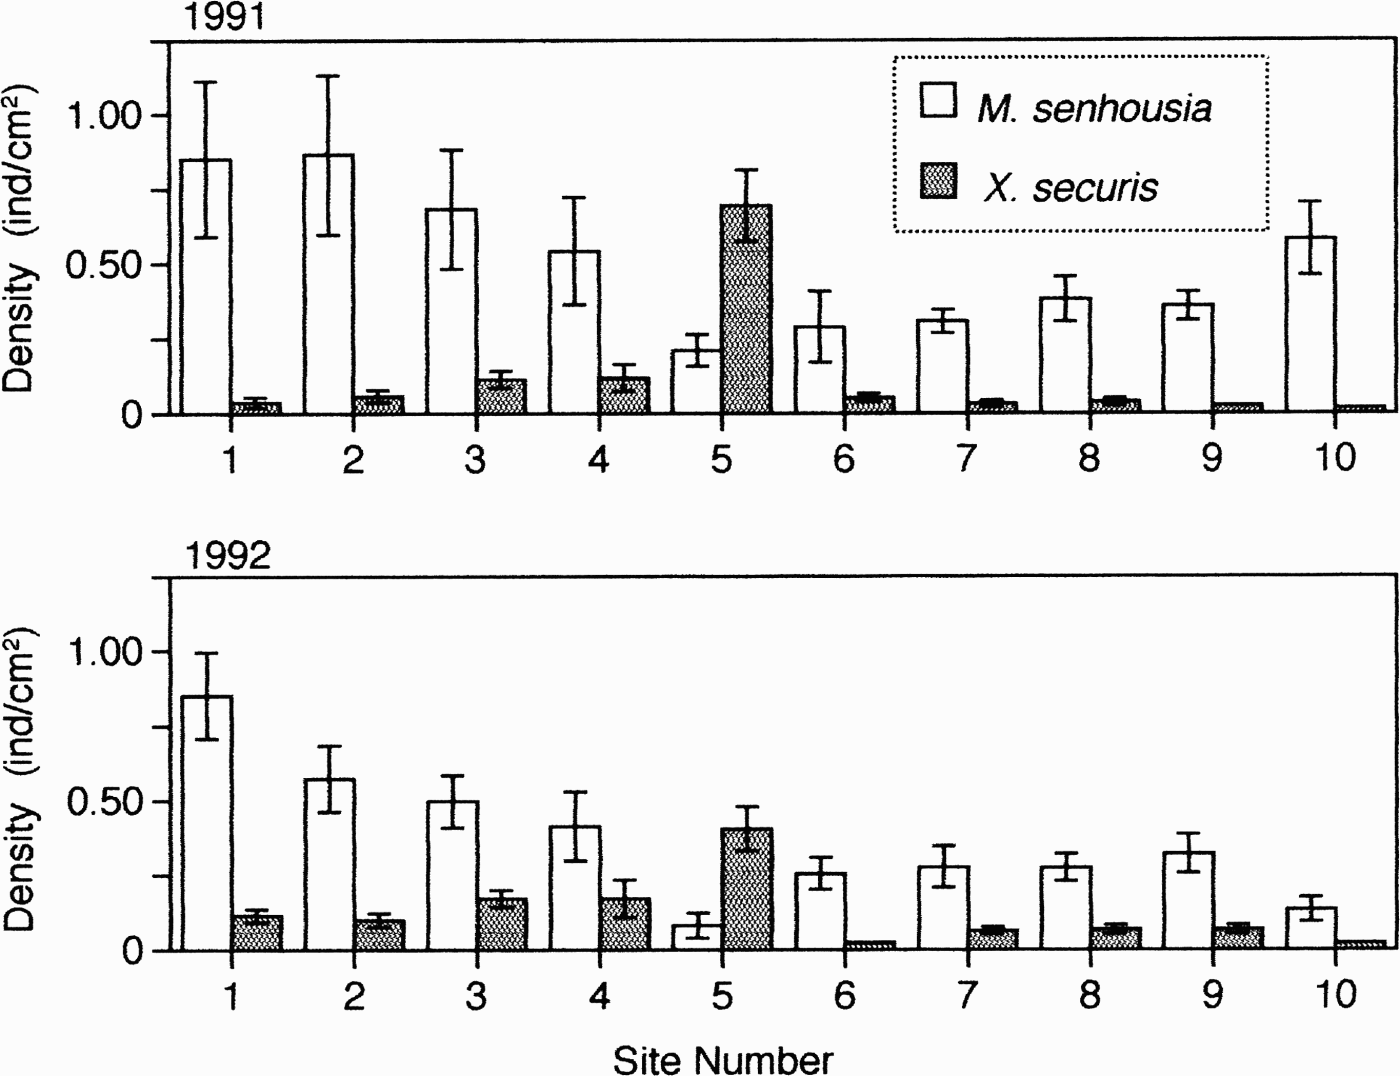
Individuals of M. senhousia and X. securis were collected throughout the year. For M. senhousia, higher densities exceeding 1.0 ind/cm2 were mainly detected at the upper sampling points than at the lower points (points 7–10) for both years (Figures 4 & 5): any point of 1 to 4 had average densities exceeding 0.5 ind/cm2 for each year, although higher average density was detected also at point 10 in 1991. A much different situation was detected for X. securis for both years: much higher densities were detected at point 5 than at any other point, with densities close to or more than 0.5 ind/cm2 for each year. The contrast between spatial distributions of these two mytilids may be related intimately to the characteristics of bottom sediments among points. Very high densities of M. senhousia were detected at any sampling point (except for point 5) with bottom sediments of sand/mud-mixed gravels. On the other hand, higher densities of X. securis were collected around point 5 with flattened rocks on the bottom.
Spatio-temporal distributions of Musculista senhousia and Xenostrobus securis densities, respectively, in Inohana Inlet, Lake Hamana. Numbers on contours indicate density (ind/cm2).

Variation in Musculista senhousia and Xenostrobus securis density, respectively, among sampling points in Inohana Inlet, Lake Hamana, for two years 1991 and 1992. Columns with vertical line indicate mean with SE. 1991: July 1991–June 1992, 1992: July 1992–June 1993.

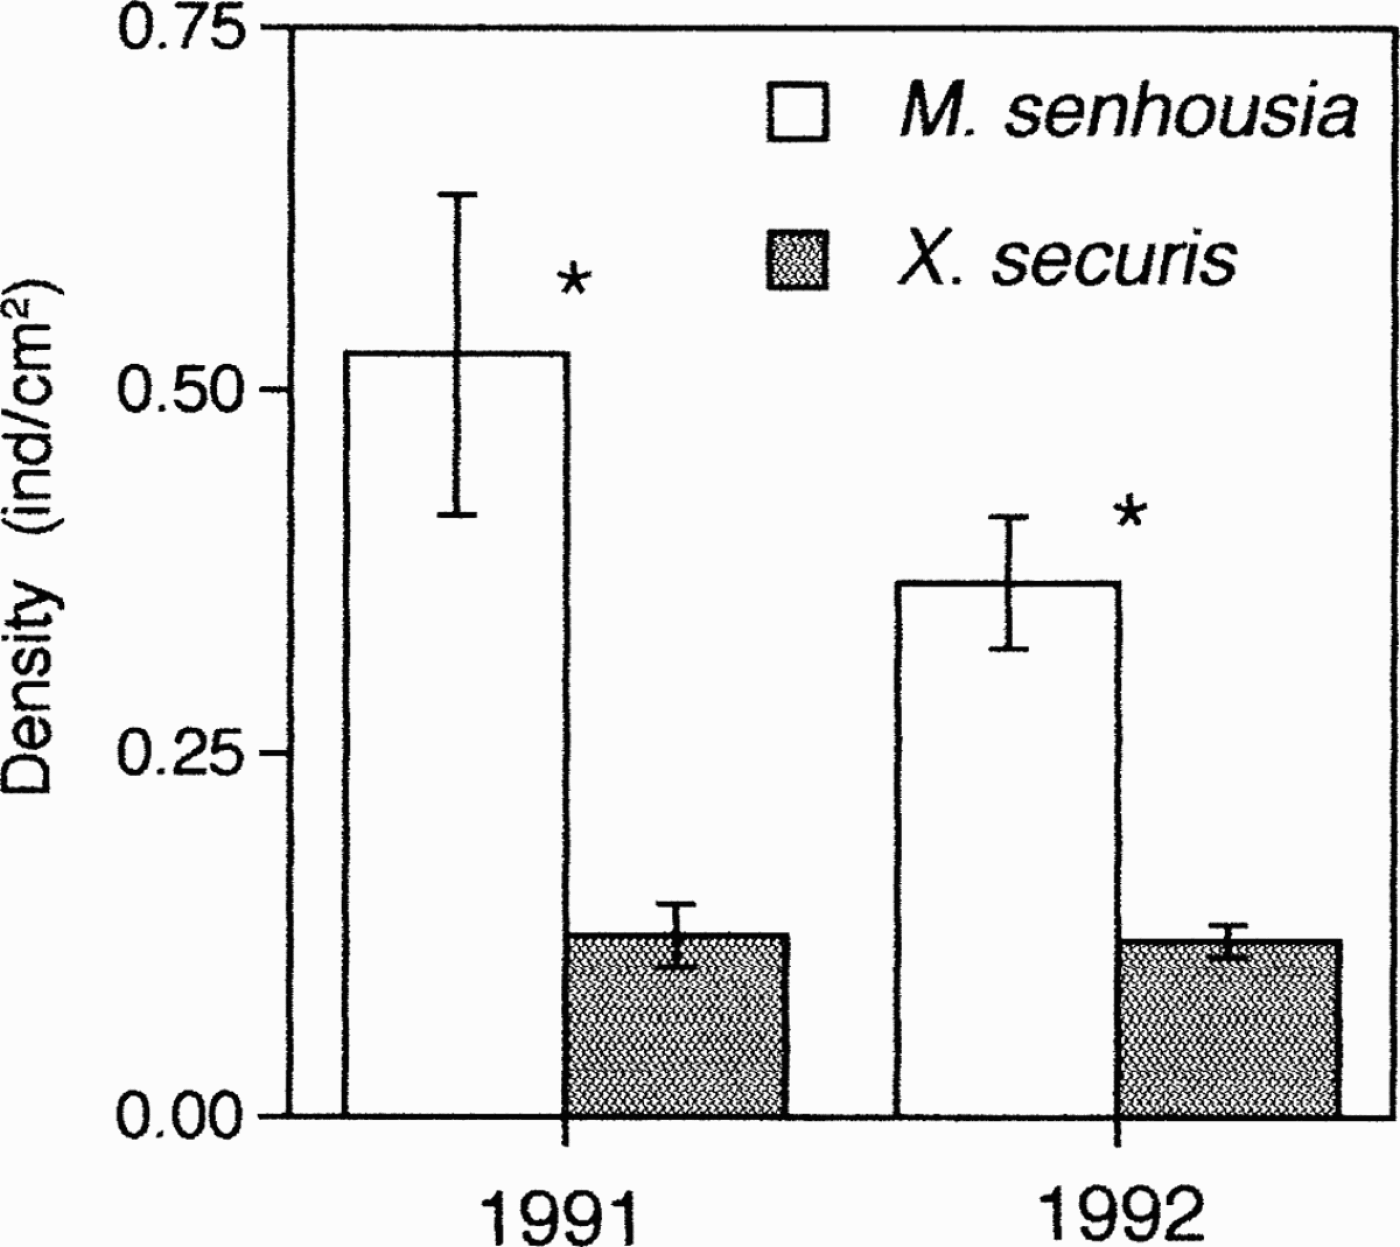
There was not any significant difference in density between two years for M. senhousia and X. securis, respectively, although M. senhousia density was significantly higher than X. securis for both years (Figure 6; Mann–Whitney U-test, P < 0.05), i.e. average densities of M. senhousia were two or three times higher than those of X. securis.
Comparison of Musculista senhousia and Xenostrobus securis densities, respectively, between two years 1991 and 1992 in Inohana Inlet, Lake Hamana. Columns with vertical line indicate mean with SE. *: P < 0.05, Mann–Whitney U-test. 1991: July 1991–June 1992, 1992: July 1992–June 1993.

Cohort separation of Musculista senhousia and Xenostrobus securis
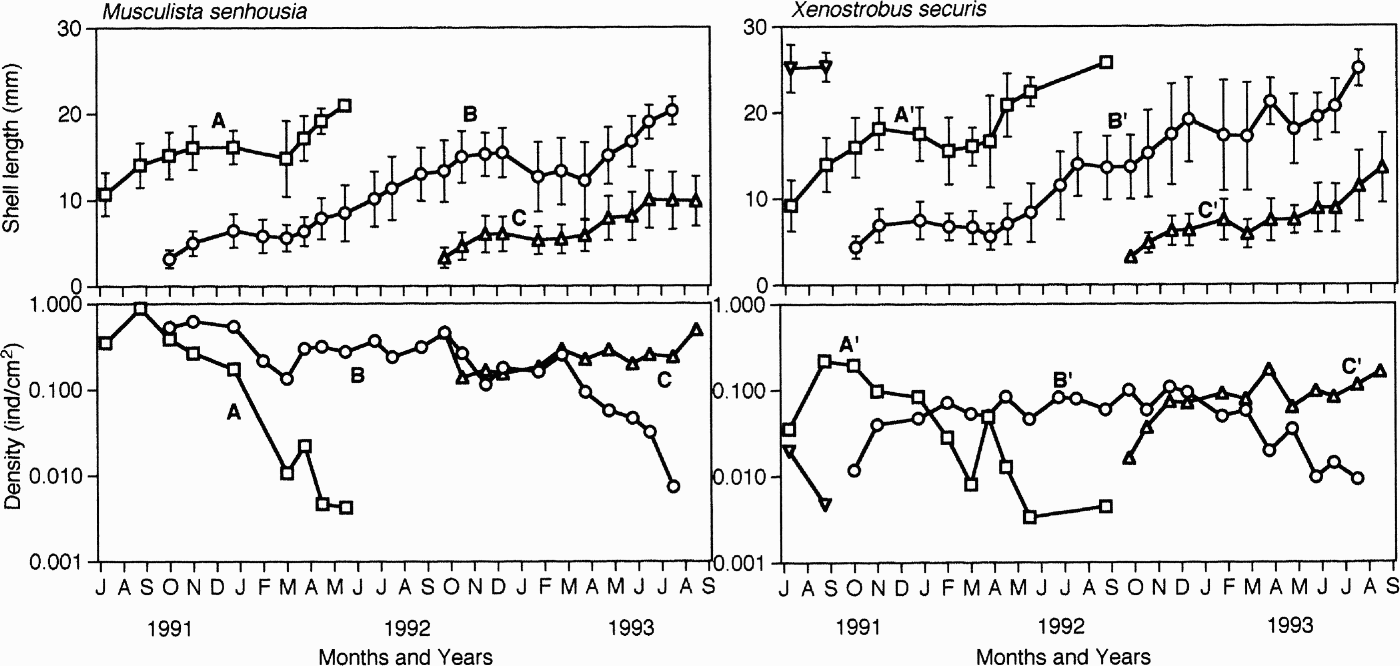
For M. senhousia individuals, three cohorts (A–C) were identified (Figure 7). Cohort A probably originated from smaller individuals (with shell lengths less than 1.0 mm) that had already been recruited before our study started, whereas smaller individuals of the other cohorts (B and C) recruited to large individuals (with 1.0 mm and more shell length) in July–October 1991 and 1992, respectively. Cohort B was detected throughout the year, and reached 20.8 mm by July 1993, passing about 21 months after larval recruitment in October 1991, and then disappeared. These three cohorts may correspond to different year-class, i.e. A to 3+ year-class, B to 2+ year-class and C to 1+ year-class. Densities of cohort A clearly became lower according to sampling months, whereas cohorts B and C did not indicate such a trend in density variation: cohort B indicated almost stable or gradually decreasing in density for the first half period of the cohort occurrence (extending from November 1991 to November of the following year) according to sampling months, but clearly and rapidly decreasing in density for the posterior half period (extending from November 1992 to August of the following year). On the other hand, cohort C indicated gradually increasing density according to sampling months. These facts suggest that cohort B density became almost stable or gradually decreased due to the continuous addition of new recruits for the first half period and then rapidly decreased due to ending of the addition of new recruits for the posterior half period. Cohort C density became gradually increased due to the continuous addition of new recruits for the present study period (probably equivalent to the first half period).
Cohort separation and surviving curves of Musculista senhousia and Xenostrobus securis individuals, respectively, in Inohana Inlet, Lake Hamana. Upper figure: cohorts separated based on shell length–frequency histograms incorporating the data of individuals collected over all points with shell length 1.0 mm and more. Columns with vertical line indicate average with SD; lower one: surviving curves of different cohorts with the vertical axis of logarithm. A–C and A′–C′: different cohorts.

For X. securis individuals, there was a situation similar to M. senhousia for cohort separation and trajectories of density variation of each cohort (Figure 7). Three cohorts (A′–C′) were identified, although a few large individuals were detected as a separate cohort for two months after the study started. Cohort B′ was detected throughout the year, and reached 25.0 mm in July 1993, passing about 21 months after larval recruitment in October 1991, and then disappeared. These cohorts may correspond to different year-class, i.e. A′ to 3+ year-class, B′ to 2+ year-class and C′ to 1+ year-class. Densities of cohort A′ clearly and rapidly became lower according to sampling months. On the other hand, densities of cohorts B′ and C′, respectively, indicated much different trends in density variation: cohort B′ became almost stable or gradually increased in density for the first half period of the cohort occurrence (extending from November 1991 to December of the following year), and clearly and rapidly decreased in density for the posterior half period (extending from December 1992 to August of the following year), whereas cohort C′ clearly became increased in density according to sampling months. These facts suggest that cohort B′ density became gradually increasing due to the continuous addition of new recruits for the first half period and then rapidly decreased due to ending of the addition of new recruits for the posterior half period. Cohort C′ density became clearly increased due to the continuous addition of new recruits for the present study period (probably equivalent to the first half period).
As indicated in Figure 4, higher densities exceeding 1.0 ind/cm2 of M. senhousia were detected several times through the survey period, i.e. in August 1991–January 1992, August–September 1992, January–February 1993, and July–August 1993. As with the cohort separation and surviving curve of each cohort (Figure 7), these higher densities correspond to the appearance of new recruits of each cohort, respectively. A similar situation was also detected for X. securis: higher densities exceeding 0.5 ind/cm2 of X. securis were detected several times, i.e. in August 1991–January 1992, and December 1992–April 1993, that correspond to the appearance of new recruits of each cohort, respectively.
DISCUSSION
In general, two mytilids Musculista senhousia and Xenostrobus securis have very similar ecological traits: as typical suspension filter-feeders, these surface dwellers are commonly and abundantly found on sediments with higher percentages of mud/organic matter in estuarine waters in the central to southern parts of Japan, where they often form dense colonies or mats (Abdel-Razek et al., Reference Abdel-Razek, Chiba, Kurokura and Hirano1993a; Kimura, Reference Kimura1994). We also found similarities in their life histories with regard to larval recruitment season each year, and the number and duration of benthic cohorts. According to Kimura & Sekiguchi (Reference Kimura and Sekiguchi1996a), larvae of M. senhousia and X. securis kept alive at 25°C or more grew faster and were successful in larval settlement, whereas those kept at 15°C or less postponed their planktonic life and were destined not to be successful in larval settlement. On the other hand, salinities and chlorophyll-a concentrations did not show to be related to the failure and success in larval recruitment of these species in the laboratory. However, the early life history of X. securis is different from that of M. senhousia: at their optimum range of temperature (25°C or more) in the laboratory; larvae of the former species showed faster growth, shorter period of planktonic life, and larger size at larval settlement than the latter species (Kimura & Sekiguchi, Reference Kimura and Sekiguchi1996a).
In the brackish Lake Hamana, as well as in other estuarine waters, spatial distributions of juveniles/adults of M. senhousia and X. securis overlap at a local or regional spatial scale, but the occurrence of high densities is generally separated at the micro-spatial scale on tidal flats: M. senhousia on muddy sites while X. securis on hard substrates (Kimura, Reference Kimura1994). Of course, juveniles/adults of M. senhousia are also collected on hard substrates, e.g. rocks and concrete banks, as well as on soft sediments. However, within estuarine waters, juveniles/adults of X. securis are found in less saline sites than are those of M. senhousia (Kimura et al., Reference Kimura, Kakuta and Kurokura1995), although their spatial distributions overlap. In this study, individuals of M. senhousia and X. securis were distinctive in their spatial distributions: higher densities of M. senhousia were detected at all sampling points except for point 5, where high densities of X. securis were mainly collected on artificial rock at point 5. A similar situation has been observed in an estuary in Western Australia: these two mytilids are common and abundant, although M. senhousia was introduced in 1982 (Wilson, Reference Wilson1969; Slack-Smith & Brearley, Reference Slack-Smith and Brearley1987).
As indicated in Figure 2, seasonal variations were marked in environmental factors such as water temperature, salinity and chlorophyll-a concentration: water temperature in the range of 6.9–33.6°C, salinity in the range of 2.6–31.3 psu, and chlorophyll-a concentration with extraordinarily high concentration exceeding 15 µg/l in March–June. However, such marked seasonal variations (Figure 2) appear to be not related intimately or directly with seasonal variations in spatial patterns of abundance of these two mytilids as indicated in Figures 4 & 7, because episodes of new recruits (getting shell length of 1.0 mm and more) had great influence onto seasonal variations in spatial patterns of abundance of these two mytilids. This suggests that spatial patterns of abundance of these two mytilids may vary seasonally (probably interannually) through a key factor such as the failure and success of larval recruitment, and/or the strength of new recruits.
There are following alternative scenarios (1, 2) explaining spatial distributions of X. securis densities as contrasted with M. senhousia: (1) there is a similar larval density of X. securis as M. senhousia, but mortality rates at and shortly after larval settlement were extremely higher for X. securis then to attain much lower density for X. securis individuals than M. senhousia; or (2) there is a much lower larval density of X. securis than M. senhousia then to attain much lower density for X. securis individuals than M. senhousia. In another of our studies studies (unpublished data), larval density was not markedly different between these two mytilids. Based on the above-mentioned unpublished data, the above scenario (1) may be supported in this study. As indicated in Figure 7, densities for cohorts B and C of M. senhousia, as well as for cohorts B′ and C′ of X. securis, became almost stable or increased due to the continuous addition of new recruits for the first half of the period of the cohort occurrence. These new recruits may be supplied through the recruitment of smaller individuals in the same area, or through the continuous addition of smaller individuals from other areas.
In conclusion, differences in microhabitat separation for benthic individuals exceeding 1.0 mm shell length (large individuals), as revealed in this study, may contribute to avoiding interspecific interactions during the benthic stages and thus to allowing the coexistence of these two mytilids on estuarine tidal flats in the brackish Lake Hamana. Microscale habitat alteration or expansion due to artificial hard substrata as related to human activities could facilitate successful colonization episodes of substrate-specific species (Carlton, Reference Carlton1996). This suggests that increasing harbours and banks, which have been constructed by hard substrata in bays and estuaries, promotes the invasion and increasing of X. securis. Factors generating such interspecific differences will be examined in future studies.
ACKNOWLEDGEMENTS
We express our sincere thanks to Drs K. Iwasaki (Nara University) and J. Crooks (Tijuana River National Estuarine Research Reserve) for comments on the early version of our manuscript, and to Drs A. Kawamura (Mie University), K. Chiba, A. Hino, H. Kurokura, K. Okamoto and S. Aoki (University of Tokyo), S. Uehara (TNFRI), K. Ikejima (Asian Institute of Technology), K. Watanabe (Kyoto University), and H. Saito (NRIFE) for their encouragement throughout the present study. Thanks are also due to T. Shikishima and Y. Tanaka (Mie University) for their assistance in field and laboratory works.