


INTRODUCTION
Recognized by the World Health Organization as one of the 13 most neglected tropical diseases in the world, Chagas disease has been a scourge to humanity since antiquity and continues to be a relevant social and economic problem in many Latin American countries (Rassi et al. Reference Rassi, Rassi and Marin-Neto2009). This life-long infection, also known as American trypanosomiasis, is caused by the protozoan parasite Trypanosoma cruzi (Kinetoplastida: Trypanosomatidae) and was discovered in 1909 by the Brazilian physician Carlos Chagas (1879–1934) (Rassi et al. Reference Rassi, Rassi and Marin-Neto2009). Chagas disease can be transmitted to man by the bite of the insect vector (Hemiptera: Reduviidae) and by non-vectorial mechanisms, such as blood transfusion, vertically from mother to infant, ingestion of food or liquid contaminated with T. cruzi, and from accidents in laboratories that deal with live parasites (Moncayo and Silveira, Reference Moncayo and Silveira2009).
Treatment of chagasic patients relies on 2 drugs, Benznidazole and Nifurtimox. These two nitroheterocycles have several limitations, as they are highly toxic and rarely beneficial in the chronic phase of the disease (Urbina and Docampo, Reference Urbina and Docampo2003). These restrictions encourage the search for alternative synthetic or natural compounds effective for both the clinical treatment of Chagas disease and for chemoprophylaxis on donated blood.
Poisons and toxins found in venomous and poisonous organisms have been the focus of much research over the past 70 years, and much knowledge has been gained in terms of how venoms and their composite toxins give rise to the syndromes associated with envenoming and poisoning (Fox and Serrano, Reference Fox and Serrano2007).This has resulted in the development of toxin-based drugs that have already received US Food and Drug Administration approval for use in the United States and in other countries around the world (Fox and Serrano, Reference Fox and Serrano2007). Captopril® is an example of a successful venom-based drug for the treatment of hypertension, which inhibits angiotensin-converting enzyme (ACE), and was developed from studies of Bothrops jararaca snake venom and its bradykinin-potentiating peptides (BPPs) (Lewis and Garcia, Reference Lewis and Garcia2003).
Honeybee (Apis mellifera) venom contains at least 18 active components with a wide variety of pharmaceutical properties, including enzymes (e.g., phospholipase A2, hyaluronidase), peptides (e.g., melittin, apamin, MCD peptide), biogenic amines (e.g., histamine, epinephrine) and non-peptide components (e.g., free amino acids, lipids and carbohydrates) (Son et al. Reference Son, Lee, Lee, Song, Lee and Hong2007). However, the 2 major bioactive components are melittin, comprising 40–50% of the dry weight of the venom, and PLA2, comprising 10–12% of the dry weight (Raghuraman and Chattopadhyay, Reference Raghuraman and Chattopadhyay2007).
Bee venom PLA2 (bvPLA2) hydrolyses the 2-acyl bonds of phosphatidylcholines, phosphatidylethanolamines, phosphatidylinositols and phosphatidylserines, disrupting membrane integrity and releasing lysophospholipids and fatty acids, which themselves may further damage the membrane (Habermann, Reference Habermann1972). Secretory bvPLA2 may act synergistically with phosphatidylinositol-(3,4)-bisphosphate in affecting membrane integrity and subsequently causing renal carcinoma cell death (Putz et al. Reference Putz, Ramoner, Gander, Rahm, Bartsch and Thurnher2006, Reference Putz, Ramoner, Gander, Rahm, Bartsch, Bernardo, Ramsay and Thurnher2007). This enzyme also displays bactericidal (i.e., Gram-negative enterobacteria) and trypanocidal (i.e., Trypanosoma brucei brucei) activities in vitro (Boutrin et al. Reference Boutrin, Foster and Pentreath2008), along with anti-Plasmodium toxicity (Moreira et al. Reference Moreira, Ito, Ghosh, Devenport, Zieler, Abraham, Crisanti, Nolan, Catteruccia and Jacobs-Lorena2002; Guillaume et al. Reference Guillaume, Deregnaucourt, Clavey and Schrével2004).
Melittin is a highly basic 26-residue peptide that is almost entirely hydrophobic but with a hydrophilic sequence (Lys-Arg-Lys-Arg) near the C-terminus; it is known to damage cell membrane enzyme systems (Habermann, Reference Habermann1972). It induces membrane permeabilization and lyses prokaryotic and eukaryotic cells in a non-selective manner (Papo and Shai, Reference Papo and Shai2003). This mechanism of action is responsible for the haemolytic, anti-microbial (Blondelle and Houghten, Reference Blondelle and Houghten1991; Bechinger, Reference Bechinger1997; Diaz-Achirica et al. Reference Díaz-Achirica, Ubach, Guinea, Andreu and Rivas1998; Chicharro et al. Reference Chicharro, Granata, Lozano, Andreu and Rivas2001; Luque-Ortega et al. Reference Luque-Ortega, Saugar, Chiva, Andreu and Rivas2003; Pérez-Cordero, Reference Pérez-Cordero, Lozano, Cortés and Delgado2011) and anti-tumour (Li et al. 2006; Holle et al. Reference Holle, Song, Holle, Wei, Li, Wagner and Yu2009) activities of melittin.
Several studies have shown the promising effects of crude venom extracts and their isolated components against protozoan parasites, including Plasmodium falciparum (Zieler et al. Reference Zieler, Keister, Dvorak and Ribeiro2001), Leishmania spp. (Fernandez-Gomez et al. Reference Fernandez-Gomez, Zerrouk, Sebti, Loyens, Benslimane and Ouaissi1994; Brand et al. Reference Brand, Leite, De Sa Mandel, Mesquita, Silva, Prates, Barbosa, Vinecky, Martins, Galasso, Kuchelhaus, Sampaio, Furtado, Andrade and Bloch2006; Toyama et al. Reference Toyama, Toyama, Passero, Laurenti, Corbett, Tomokane, Fonseca, Antunes, Joazeiro, Beriam, Martins, Monteiro and Fonteles2006; Passero et al. Reference Passero, Tomokane, Corbett, Laurenti and Toyama2007; Tempone et al. Reference Tempone, Andrade, Spencer, Lourenço, Rogero and Nascimento2001) and T. cruzi (Tempone et al. Reference Tempone, Sartorelli, Mady and Fernandes2007; Gonçalves et al. Reference Gonçalves, Soares, De Souza, DaMatta and Alves2002; Ciscotto et al. Reference Ciscotto, Machado de Avila, Coelho, Oliveira, Diniz, Farías, Carvalho, Maria, Sanchez, Borges and Chávez-Olórtegui2009). More recently, our group presented Crotalus viridis viridis snake venom as a source for drug development for Chagas disease therapy, as this venom exhibited great efficacy against the intracellular form of the parasite (Adade et al. Reference Adade, Cons, Melo and Souto-Padrón2011). Following this line of research, in the present study, we have analysed the effect of A. mellifera crude venom over the entire T. cruzi cycle, investigating the possible venom targets, the effects on the parasite ultrastructure and the parasite death phenotype.
MATERIALS AND METHODS
Parasites
Y strain and CL Brener clone T. cruzi epimastigotes were maintained axenically at 28 °C in LIT medium supplemented with 10% fetal calf serum (FCS), with weekly transfers. Four-day-old culture forms, at the mid-log phase of growth, were used in all experiments. Tissue-culture trypomastigotes were obtained from the supernatant of 5- to 6-day-old infected LLC-MK2 cells maintained in RPMI-1640 medium supplemented with 2% FCS for 5–6 days at 37 °C in a 5% humidified CO2 atmosphere, as previously described (Adade et al. Reference Adade, Cons, Melo and Souto-Padrón2011). Intracellular amastigotes were obtained and cultured as described below.
Free parasite treatment
Apis mellifera crude venom was purchased from Sigma Chemical Co. (St Louis, MO, USA). A stock solution (12·5 mg/ml) was prepared in phosphate-buffered saline (PBS, pH 7·2) and stored at −20 °C until use.
Epimastigotes were re-suspended in LIT medium at 2 × 10⁶cells/ml, and an aliquot of 1 ml of the suspension was added to the same volume of A. mellifera venom, which had been previously diluted in LIT medium to twice the desired final concentration (0·1 to 200 μg/ml) in 24-well plates (Nunc Inc., Naperville, IL, USA), followed by incubation for 96 h at 28 °C. The number of parasites was determined daily by counting formalin-fixed parasites in a haemocytometer chamber. The parameter used to estimate inhibition of proliferation was the IC50, which corresponds to the drug concentration that inhibited 50% of cell growth. Parasites grown in drug-free LIT medium were used as a control. The growth experiments were carried out in triplicate, and the standard deviation of the cell densities at each time-point are given by error bars. Cell viability was verified by the detection of propidium iodide staining by flow cytometry (described below).
Tissue-culture trypomastigotes were re-suspended to a concentration of 10 × 106cells/ml in RPMI medium (Sigma) containing 10% FCS. This suspension (100 μl) was added to the same volume of the venom that had previously been diluted in RPMI medium to twice the desired final concentration (0·05–200 μg/ml) in 96-well plates (Nunc Inc.), followed by incubation at 37 °C. The parameter LD50 (50% trypomastigote lysis) was evaluated by cell counting of formalin-fixed parasites in a haemocytometer chamber after 24 h. The experiments were performed in triplicate.
Cytotoxicity to mammalian cells
Uninfected LLC-MK2 cells were seeded in 24-well plates (Nunc Inc.) containing glass cover-slips and were maintained with RPMI medium supplemented with 10% FCS and treated or not with 0·1, 0·5, 1, 5 and 10 μg/ ml of the crude venom at 37 °C for 72 h. Each day, the cytotoxic effects were examined using a Trypan blue exclusion test. Briefly, at the end of the incubation period, the glass coverslips were washed with sterile PBS (pH 7·2) and stained with a 1:1 volume dilution of trypan blue solution: RPMI for 5 min. After this period, the cells were gently washed with PBS and observed using a Zeiss Axiovert light microscope (Oberkochen, Germany). At least 500 cells per well were examined, enabling the determination of the LC50 value (i.e., the venom concentration that caused a 50% reduction in cellular viability). In addition, uninfected mouse peritoneal macrophages were seeded in 96-well plates (Nunc Inc.), maintained in RPMI medium and treated or not with 1 and 5 μg/ ml of the crude venom at 37 °C for 48 h. After this period, the cytotoxic effects were examined using a MTS (3-(4,5-dimethylthiazol-2-yl)-5-(3-carboxymethoxyphenyl)-2-(4-sulfophenyl)-2H-tetrazolium, inner salt) assay, in which the reduction of MTS in soluble formazan by mitochondrial dehydrogenase enzymes occurs only in healthy and metabolically active cells (Berridge et al. Reference Berridge, Herst and Tan2005). Briefly, at the end of the incubation period, the cells were washed with sterile PBS (pH 7·2), the wells filled with RPMI medium (without a pH indicator colour), 10 mM glucose and 20 μl of MTS/ PMS reagent (20:1), for which the stock solution was 2 mg/ml MTS and 0·92 mg/ml PMS prepared in DPBS (Promega, Madison, WI, USA). The absorbance was evaluated in a microplate reader spectrophotometer at 490 nm, after a 3-h incubation, during which the toxicity was measured. All the animal experimentation protocols were submitted to and approved by the Commission of Evaluation of the Use of Research Animals (Comissão de Avaliação do Uso de Animais em Pesquisa (CAUAP) of the Biophysics Institute Carlos Chagas Filho. Both experiments were carried out in triplicate.
Treatment over the T. cruzi intracellular cycle
To investigate the effect of A. mellifera venom on the intracellular cycle of the parasite, LLC-MK2 cells were seeded in 24-well plates containing glass coverslips, cultivated in RPMI supplemented with 10% FCS, and maintained at 37 °C in a 5% CO2 humidified atmosphere for 1 day as previously described (Adade et al. Reference Adade, Cons, Melo and Souto-Padrón2011). Thereafter, the cultures were washed and infected with tissue-culture trypomastigotes (parasite:host cell ratio 10:1). After 24 h of interaction, non-internalized parasites were removed by repeated washes with PBS, and the cells were cultivated in fresh RPMI medium containing 2% FCS with (0·025–0·4 μg/ml) or without bee venom. Media were changed every 2 days. Coverslips were collected daily up to 96 h, rinsed in PBS, fixed in Bouin's solution, stained with Giemsa and mounted on glass slides with Permount (Fisher Scientific, New Jersey, USA). Parasite infection was quantified using a Zeiss Axioplan 2 light microscope (Oberkochen, Germany) equipped with a Color View XS digital video camera. The number of intracellular amastigotes per infected cell and per 100 cells was evaluated by counting a total of 500 cells in 3 different experiments. The IC50 was estimated as the dose that reduced the number of amastigotes per infected cell by 50%.
Scanning electron microscopy
Epimastigotes treated with 0·67 μg/ml and tissue-culture trypomastigotes treated with 0·1 μg/ml of the crude bee venom for 1–24 h were washed twice with PBS and fixed for 1 h with 2·5% glutaraldehyde (GA) in 0·1 M cacodylate buffer (pH 7·2), 5 mM calcium chloride and 2% sucrose. The parasites were then washed with the same buffer and adhered to glass coverslips coated with 0·1% poly-L-lysine (M.W. 70 000, Sigma). After post-fixation for 15 min with 1% osmium tetroxide (OsO4) containing 0·8% potassium ferrocyanide and 5 mM calcium chloride in cacodylate buffer 0·1 M (pH 7·2), cells were washed, dehydrated in graded ethanol and then critical-point dried with CO2. Samples were adhered to scanning electron microscopy stubs, coated with a 20 nm-thick gold layer in a sputtering device and then observed in a JEOL JSM 5310 scanning electron microscope (Tokyo, Japan) operating at 25 kV. Digital images were acquired and stored in a computer.
Transmission electron microscopy
Epimastigotes and trypomastigotes treated with their respective IC50 and LD50 of A. mellifera venom for 24 h, and the infected LLC-MK2 cells treated with 0·125 μg/ml venom for 72 h were fixed as described above. After fixation, LLC-MK2 cells were gently scraped off with a rubber policeman and harvested by centrifugation. All samples were post-fixed in 1% osmium tetroxide (OsO4) containing 0·8% potassium ferrocyanide and 5 mM calcium chloride in 0·1 M cacodylate buffer (pH 7·2) for 1 h at room temperature, dehydrated in graded acetone, embedded in PolyBed812 (Polysciences Inc., Warrington, PA, USA), and then polymerized for 3 days at 60 °C. Ultra-thin sections obtained with a Leica (Nussloch, Germany) ultramicrotome were stained with uranyl acetate and lead citrate and observed in a FEI Morgagni F 268 (Eindhoven, The Netherlands) transmission electron microscope operating at 80 kV.
Flow cytometry analysis
Epimastigotes (maintained in LIT medium at 28 °C) and tissue-culture trypomastigotes (maintained in RPMI medium at 37 °C) were treated (at 1 × 10⁶ cells/ml) with 0·335–1·34 or 0·05–0·2 μg/ml A. mellifera venom, respectively, for 1 day. The parasites were then incubated with 15 μg/ml propidium iodide (PI) plus 10 μg/ml rhodamine 123 (Rh123) for 15 min. Changes in the Rh123 fluorescence level between treated and untreated parasites were quantified using an arbitrary index of variation (IV) obtained by the equation (MT – MC)/MC, where MT is the median of fluorescence for treated parasites and MC that of untreated parasites. Negative IV values corresponded to depolarization of the mitochondrial membrane.
Both parasite morphological forms (1 × 10⁶/ml), treated for 24 h or not, were evaluated for DNA fragmentation by the terminal deoxynucleotidyltransferase-mediate fluorescein dUTP nick end labelling technique (TUNEL) using the APO-BrdU™ TUNEL Assay Kit (Molecular Probes Inc.) to detect apoptotic cells, according to the manufacturer's specifications. Treated parasites were analysed immediately. The positive control was a fixed human lymphoma cell line that was included in the TUNEL Assay kit.
In all the performed assays, the cells were kept on ice until data acquisition and analysis with a FACSCalibur flow cytometer (Becton-Dickinson, Franklin Lakes, NJ, USA) equipped with CellQuest software (Joseph Trotter, Scripps Research Institute, San Diego, CA, USA). A total of 10 000 events were acquired in the region previously established as the region that corresponded to the parasites. All flow cytometry analyses were done in at least 3 independent experiments.
Fluorimetry
T. cruzi epimastigotes and trypomastigotes were treated with bee venom (0·335–0·67 and 0·05–1 μg/ml, respectively) or not (control cells) for 24 h, washed with PBS (pH 7·2) and incubated with 100 μM of monodansyl cadaverine (MDC) (Sigma-Aldrich) for 1 h at 28 °C (epimastigotes) or 37 °C (trypomastigotes), avoiding light incidence. After this period, the parasites were washed twice in PBS and fixed with 2% formaldehyde (FA) freshly prepared from paraformaldehyde for 20 min at room temperature. Each condition was performed in triplicate and added to different wells (100 μl final volume) of a black 96-well plate and analysed in a Molecular Devices Microplate Reader (a SpectraMax M2/M2e spectrofluorometer) using 355 and 460 nm wavelengths for excitation and emission, respectively. Suspensions of 2% FA and 2% FA plus 100 μM MDC were also made as reaction controls and were simultaneously read in the plate.
Fluorescence microscopy
The cell death analysis in intracellular amastigotes was carried out using TUNEL technique and MDC staining. For both analyses, LLC-MK2 cells were seeded in 24-well plates containing glass coverslips, cultivated and infected as cited above. The cells were cultivated for 3 days in fresh RPMI medium containing 2% FCS with 0·125 μg/ ml or without A. mellifera venom. Media were changed daily. TUNEL was performed using the same kit used for flow cytometry analysis, and a positive control was established by infected cells treated for 45 min at room temperature, with 2·5 μg/ ml DNAse I (Sigma) prior to the procedure. After this period, all the samples were washed twice with PBS, fixed for 20 min at 4 °C with 4% FA and processed according to the manufacturer's specifications. After staining, cells were further incubated with 10 μg/ ml 4,6-diamidino-2-phenylindole (DAPI), for nuclei and kinetoplast visualization. For MDC staining, all samples were washed twice with PBS, incubated for 1 h with 100 μM MDC at 37 °C and fixed for 20 min at 4 °C with 4% FA. At the end of this period, the cells were further incubated with a PI solution (10 μg/ ml) for 15 min to facilitate the nuclei and kinetoplast detection. All the samples were washed twice with PBS, mounted on glass slides with 0·2 M N-propyl gallate to reduce fading and analysed by Zeiss Axioplan 2 microscope equipped with epifluorescence. The number of parasites per infected cell, and the percentage of TUNEL- and MDC- positive parasites were scored in 300 host cells per slide.
Evaluation of intracellular amastigotes autophagy
LLC-MK2 cells were seeded in 24-well plates containing glass coverslips, cultivated and infected as cited above. Prior to the A. mellifera treatment with 0·125 μg/ ml, cell cultures were incubated or not with 10 mM 3-methyladenine (3-MA, Sigma-Aldrich). After 3 days, the coverslips were collected, rinsed in PBS, fixed in Bouin's solution, stained with Giemsa and mounted on glass slides with Permount (Fisher Scientific). The number of intracellular amastigotes per infected cell was evaluated by counting a total of 500 cells in 2 different experiments.
Statistical analysis
Mean value comparisons between the control and treated groups were performed using the Kruskal-Wallis test in the BioEstat 2.0 program for Windows. Differences with P ⩽0·05 were considered statistically significant.
RESULTS
Treatment of epimastigotes with A. mellifera venom resulted in dose-dependent growth inhibition (Table 1), with an IC50/ 1 day treatment of 0·85 ± 0·05 and 0·67 ± 0·25 μg/ ml for the Y strain and CL Brener clone, respectively. Because those results were not statistically different (P > 0·05), all other experiments with epimastigote forms were performed with CL Brener parasites and utilizing the 0·67 μg/ ml concentration for a 24-h treatment. Incubation of parasites with 12·6–200 μg/ ml A. mellifera venom led to 100% cell death soon after the first 24 h of treatment. Treatment of tissue-culture trypomastigotes also induced lysis of the parasites, with an LD50/ 1 day value of 0·10 ± 0·03 μg/ ml (Table 1).
Effect of Apis mellifera venom on the three evolutive forms of Trypanosoma cruzi (CL Brener clone)

a Days of treatment.
b IC50 venom concentration to inhibit 50% parasite growth each day.
c LD50 venom concentration that lyses 50% of trypomastigote cultures.
d IC50 venom concentration to reduce by 50% the number of intracellular amastigotes per infected cell.
e SI values, where LC50>10 μg/ml.
f LC50 venom concentration that lyses 50% of LLC-MK2 cells.
nd,Not done.
Parasites treated for 1 day with 0·67μg/ ml (epimastigotes; Fig. 1B–F) and 0·1 μg/ml (trypomastigotes; Fig. 1H, I) presented morphological alterations that were observed by scanning electron microscopy (SEM) (Fig. 1). The parasites presented loss of cell body membrane integrity (Fig. 1B–F; H, I), with the presence of variable size pores (Fig. 1B inset, F, H) and membrane shrinkage (Fig. 1F). Both parasite forms presented variable amounts and abnormal membrane blebbing in the flagellar and cell body membranes (Fig. 1C, H inset), although cell body retraction was also commonly detected in treated trypomastigotes (Fig. 1I). Only those parasites that displayed broken flagella did not present significant alterations in body shape (Fig. 1C, D).
Scanning electron microscopy of control epimastigotes (A), trypomastigotes (G) and treated epimastigotes (B–F) and trypomastigotes (H,I) displaying remarkable alterations. Loss of cell body membrane integrity with cracks (arrowhead in D), variable sized pores (arrowheads in F, H and inset in B), abnormal conformation of the cell body (asterisk in C and E, H,I), membrane shrinkage (F) and broken flagella (arrows in B–D) were the most common alterations. Abnormal membrane blebbing (asterisks) from the cell body was also detected in both parasite forms (H- inset). Scale bars: 1 μm.

Analysis of venom-treated epimastigotes by transmission electron microscopy (TEM) showed changes in the morphology of the reservosomes, characterized by the swelling of the organelle and the loss of their electron-dense matrix and internal vesicles (Fig. 2B, H). An intense swelling of the mitochondria (Fig. 2C, E), with an altered inner mitochondrial membrane forming concentric membrane structures inside the organelle, was also observed (Fig. 2B,C, E). Despite mitochondrial damage, the kDNA network preserved its typical morphology (Fig. 2C, D). One remarkable feature of epimastigote treatment was the presence of endoplasmic reticulum profiles surrounding different structures, suggesting autophagosome formation (Fig. 2D, G, H). Intense cell shape disorganization with large cell body projections was frequently observed (Fig. 2F).
Transmission electron microscopy (TEM) of untreated epimastigotes (A) and treated parasites exhibiting remarkable alterations (C–H). Control cells (A) displayed typical elongated cell bodies, flagellar pocket (FP), mitochondria (m), kinetoplast (k), reservosomes (R), and nucleus (N). The venom-treated epimastigotes (C–H) presented different alterations on mitochondria, such as swelling (C) and altered inner membranes with concentric figure formations (thin arrows in B,C, E). No altered kinetoplasts were observed (C,D). The highlighted features were the presence of endoplasmic reticulum profiles surrounding different structures (arrowheads in D, G) suggesting autophagosome (AP) formation, a remarkable autophagy-like death indication. Other detected alterations were disorganized reservosomes (white star in B) and plasma membrane projections (thick arrow in F). Scale bars: 0·5 μm.

The most striking morphological effect of A. mellifera venom treatment on trypomastigotes was mitochondrial swelling, with disorganization of the internal membranes and a retraction of mitochondrial kDNA filaments (Fig. 3B–E, G, H). Unlike what was observed in treated epimastigotes, trypomastigotes presented a remarkable kDNA network alteration characterized by the fragmentation of DNA filaments (Fig. 3B–E, G). The venom treatment also led to a strong nuclear envelope dilatation (Fig. 3G, H), increased nuclear chromatin condensation (Fig. 3G, H), detachment of the plasma membrane and the presence of blebs budding from the cell body and flagellar membranes (Fig. 3C, D and inset in G), swelling of cytoplasmic vacuoles (Fig. 3B) and altered lysosome-related organelles with loss of their contents through leaking (Fig. 3F).
Transmission electron microscopy (TEM) of untreated (A) and venom-treated trypomastigotes (B–H). Control trypomastigote (A) exhibiting normal organelles, such as full plasma membrane, nucleus (N) and kinetoplast (k). Treated trypomastigotes (B–H) exhibited membrane extensions in the cell body (arrows in D, G inset), swollen vacuoles (V) and mitochondria with strong condensation of the internal membrane (asterisk in B), concentric figures (asterisk in C) and increased swelling (asterisk in H). Additionally, the treated trypomastigotes presented a strongly altered kDNA network with an apparent retraction from the mitochondria content (black stars in C–E). They presented apoptosis-like features, such as strong nuclear envelope dilatation (arrowheads in G,H) with increased nuclear chromatin condensation (G,H) and absence of endoplasmic reticulum profiles or autophagosomes. Some treated parasites exhibited lysosome-related organelles (empty stars in F) that lost their contents due to leaking. Scale bars: 0·5 μm.

To investigate A. mellifera venom activity against the T. cruzi intracellular form, we tested the bee venom cytotoxicity to the host cells, which involved treating LLC-MK2 cells with 0·1, 0·5, 1, 5 and 10 μg/ ml for 72 h and examining treated cells with a Trypan blue cell viability test (data not shown). The positive (blue) staining indicated non-viable cells. The 0·1–5 μg/ml treatment after 24 h of incubation induced less than a 20% loss of cell viability, whereas nearly 42% of cell viability was lost with the 10 μg/ml treatment. Following treatment, the 5 μg/ml incubation increased cell damage to 32% and 40% after 48 and 72 h, respectively. Incubation in the presence of 10 μg/ ml reduced cellular viability in 61% and 86% of cells after 48 and 72 h, respectively, indicating remarkable cell damage. In parallel, to investigate the cytotoxicity of the venom in primary host cell cultures, we tested the activity of the venom in peritoneal macrophages (data not shown). The cells were treated with 1 and 5 μg/ ml for 48 h and were examined with an MTS assay. The formazan precipitate occurred through the action of mitochondrial dehydrogenase enzymes in most treated cells, with no significant reduction in absorbance (P ⩽0·05) after the 5μg/ ml treatment compared to control cells.
The effect of bee venom on intracellular amastigotes was analysed in infected LLC-MK2cells. After 24 h of infection, cells were treated with 0·025–0·4 μg/ml of A. mellifera venom for up to 96 h, and the numbers of parasites per infected cell and per 100 cells were quantified daily by light microscopy. Untreated infected cells exhibited a higher infection profile compared to treated cells, with a large number of intracellular amastigote forms present on all analysed days. In contrast, treated infected cells had reduced numbers of both amastigotes per cell and per 100 cells with the different venom concentrations and at the different treatment times. The reduction in the numbers of parasites per infected cell varied from 53% to 73% after 24 or 96 h of treatment, respectively. A greater reduction was observed in the number of parasites per 100 cells, which was approximately 95% after 24 or 96 h of treatment. The IC50 value to inhibit the proliferation of intracellular amastigotes in the presence of the venom was 0·158 ± 0·03 μg/ ml when analyed after 24 h and reached 0·117 ± 0·06 μg/ ml on the last day of treatment (Table 1). The IC50 and LD50 values allowed quantification of the selectivity index (SI) when related to the LC50. The most active treatment was against trypomastigotes, which also displayed the highest SI value (100-fold), followed by the intracellular amastigote treatment, which rose 80-fold after 72 h of incubation (Table 1).
To analyse the effect of the venom on the morphology of intracellular amastigotes, LLC-MK2cells were infected, treated for 72 h with 0·125μg/ ml and processed for light and transmission electron microscopy. In non-treated cells, the parasites that existed inside the host cell cytoplasm exhibited typical morphologies (Fig. 4A, B), such as rounded body shapes and bar-shaped kinetoplasts. Through ultrastructural analysis, it was possible to verify the aspects of other organelles, such as the nucleus, the mitochondria, and the short flagellum (Fig. 4B). The low infection index of infected and treated LLC-MK2 cells was confirmed. Some intracellular parasites with abnormal morphologies (Fig. 4E) resulted from the venom treatment. TEM confirmed that intracellular amastigotes presented with morphological alterations, such as swelling of their cell bodies and changes in lysosome-related organelles (LRO), which was characterized by swelling and by the presence of an increased number of electron-dense rod-shaped bodies (Fig. 4D, F).
Light (A, C, E) and transmission electron microscopy (B, D, F) of Trypanosoma cruzi-infected and treated LLC-MK2 cells. (A–B) Untreated cells exhibited a high number of intracellular amastigotes presenting round body shape with typical nucleus (black arrowhead) and bar-shaped kinetoplast (white arrowhead). This normal morphology was confirmed by TEM, by which intracellular parasites presented with typical nucleus (N) and kinetoplast (k). The treatment resulted in a low infection index, confirmed by the low number of normal amastigotes (C, thin arrows) detected inside treated host cells. Occasionally, detection of altered intracellular amastigotes by light (E) and electron microscopy was possible (D–F). Ultrastructural analysis revealed amastigotes exhibiting disorganized internal structures in their cell bodies (asterisks). Scale bars: A, C, E: 20 μm; B, D, F: 0·5 μm.

Because ultrastructural changes observed in all developmental forms after A. mellifera treatment were suggestive of membrane damage and loss of cell viability with distinct cell death phenotypes, we proceeded with flow cytometry analysis utilizing propidium iodide (PI) and rhodamine 123 (Rh 123) staining (Fig. 5A, B; Table 2). Parasites exhibited a high percentage of PI-labelled cells, which reached 67·2% (epimastigotes) and 79·7% (trypomastigotes) when treated with IC50 and LD50 concentrations, respectively, of bee venom. The flow cytometry data also confirmed the strong mitochondrial alterations detected by TEM, suggesting interference in the proton electrochemical potential gradient membrane in venom-treated and Rh 123-stained parasites. Treated epimastigotes and trypomastigotes exhibited gradual decreases in Rh 123 median fluorescence emission, with IV reaching −0·46 and −0·32 at IC50 and LD50 doses, respectively (Fig. 5C, D; Table 2).
Flow cytometry analysis of treated epimastigotes (A, C) and trypomastigotes (B, D) stained with propidium iodide (PI) (A, B) and rhodamine 123 (Rh 123) (C, D). The rising percentage of PI labelling indicates loss of parasite viability at different concentrations. Data are expressed as means ± standard deviation of 3 different experiments, and asterisks indicate significant differences compared to untreated parasites. The decrease in Rh 123 fluorescence emission indicates altered mitochondrial membrane potential, where histograms (thick black lines) display parasites treated with their respective IC50 (A) and LD50 (B) values (P ⩽0·05).

Flow cytometry analysis of Trypanosoma cruzi treated with Apis mellifera venom labelled with PI and Rh123
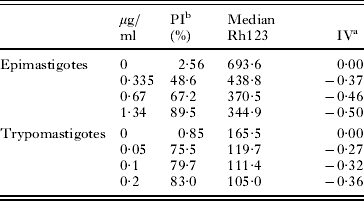
aArbitrary Index of Variation – IV = (MT-MC)/MC, where MT corresponds to the median of the fluorescence for treated parasites and MC to that of control parasites.
bPercentage of PI-positive cells.
cData represent the means ± standard deviation of at least 3 independent experiments.
As previously mentioned, after venom treatment, epimastigotes frequently presented concentric endoplasmic reticulum profiles, sometimes surrounding different structures resembling autophagosomes, which are a remarkable feature of the autophagic death phenotype. However, such structures were virtually absent in treated trypomastigotes. To confirm our suspicions, both treated T. cruzi developmental forms were incubated with MDC, a fluorescent autophagy marker, and analysed by fluorimetry (Fig. 6A, C). The MDC emission fluorescence by treated epimastigotes (0·67 μg/ ml) was significantly greater (P ⩽0·05) than those observed in untreated parasites, even when a lower venom concentration (0·335 μg/ ml) was used (Fig. 6A). However, trypomastigotes treated with 0·05 and 0·1 μg/ ml displayed low and no significant (P > 0·05) MDC fluorescence emission in relation to the untreated parasites (Fig. 6C). The fluorescence intensity observed in the venom-treated trypomastigotes at the LD50 was approximately 10 times lower than that observed in the epimastigotes at their IC50.
Fluorimetric analysis of MDC (A, C) and TUNEL (B, D) labelling in treated Trypanosoma cruzi epimastigotes (A, B) and trypomastigotes (C, D). The MDC reading was done in a microplate reader using wavelengths at 355 and 460 nm for excitation and emission, respectively. Asterisks indicate significant differences related to untreated parasites (P⩽ 0·05). Note that treated epimastigotes (A) exhibited strong MDC staining, especially at IC50 doses. The same was observed for trypomastigotes (C). The MDC fluorescence intensity is expressed as arbitrary units, where different data represent means ± standard deviation. Fragmented DNA was stained by TUNEL assay and evaluated by flow cytometry; there was insignificant labelling in treated epimastigotes (B) and a remarkable number of labelled trypomastigotes (D). The results were obtained from experiments performed in triplicate.

The remarkable ultrastructural changes of trypomastigotes after incubation with A. mellifera venom (Fig. 3B–E) included not only nuclear DNA fragmentation but also an effect on the kDNA filaments, neither of which were observed in epimastigotes. These data were confirmed by in situ labelling of DNA fragments (TUNEL assay), where it was much more evident in treated trypomastigotes (Fig. 6D) than in epimastigotes (Fig. 6B). Only 17·9% of epimastigotes treated with 0·67 μg/ ml A. mellifera venom were TUNEL-positive, compared to 70·7% of trypomastigotes treated with 0·1 μg/ml venom. Further, only 3·7% of epimastigotes treated with 0·335 μg/ml venom (half IC50) were TUNEL-positive, compared to 18% of trypomastigotes treated with 0·05 μg/ml venom (half LD50).
Since ultrastructural analysis of amastigotes did not indicate a preferential cell death pathway, we then performed analysis of venom-treated parasites using TUNEL assay (Fig. 7) and MDC staining (Fig. 8). In parallel, we decided also to perform the treatment of infected LLC-MK2 in the presence of 3-MA, a well-known autophagy-like cell death inhibitor by suppressing autophagosomes formation (Levine and Yuan, Reference Levine and Yuan2005), and quantify the number of intracellular parasites per infected cell (Fig. 8D).
Fluorescence microscopy of TUNEL labelling in Trypanosoma cruzi-infected and venom-treated LLC-MK2 cells. DAPI (B, E, blue) stained the DNA of the host cell nuclei (asterisks), and kinetoplast (arrowheads) and nuclei (arrows) of intracellular parasites. (A–C) Infected cells incubated with DNAse I, showing a large number of TUNEL-positive parasites (green). (D–F) Apis mellifera-treated cells presenting positive staining at nuclei and kinetoplast of intracellular amastigotes (green). (G,H) Inhibition of growth of intracellular amastigotes per infected cell after 3 days of treatment, and the percentage of intracellular parasites positively stained by TUNEL assay. Scale bars: 10 μm.

MDC labelling in Trypanosoma cruzi-infected and treated LLC-MK2 cells. (A–C) Fluorescence microscopy where PI (B, red) stained the DNA of the host cell nuclei (asterisks), and the kinetoplast (arrowheads) and nuclei (arrows) of intracellular parasites. (C) Positive staining (blue) exhibited by treated intracellular amastigotes. (D–E) Inhibition of growth of intracellular amastigotes per infected cell after 3 days treatment, in the presence or not of 3-MA, and percentage of intracellular parasites positively stained by MDC assay. The differences between treated parasites in the presence of the inhibitor (D) and treated parasites and non-treated MDC-positive parasites are statistically significant (P⩽ 0·05). Scale bars: 10 μm.

The TUNEL assay revealed a great number of positive parasites after A. mellifera treatment. The positive fluorescence staining exhibited by venom-treated amastigotes (Fig. 7 D–F) was very similar to that observed with DNAse-treated parasites (Fig. 7 A–C). The in situ labelling of DNA fragments was detected both at the kinetoplast and nucleus (Fig. 7F; coloured green) and the percentage of venom-treated parasites stained by TUNEL was 45·4 ± 2·1 (Fig. 7H), whereas 56·6 ± 8·1% was observed with DAPI stain after DNAse treatment. There was no statistical difference between these two samples (P > 0·05). However, some intracellular amastigotes were not stained by TUNEL reaction, even within the same host cell. Thus, we investigated the autophagy-like cell death occurrence in those intracellular parasites (Fig. 8). Venom-treated intracellular amastigotes exhibited 28·3 ± 7·8% MDC-positive staining (Fig. 8 C, E), whereas untreated parasites exhibited 7·8 ± 2·4% MDC-positive staining (Fig. 8 E). This difference was statistically significant (P ⩽0·05). Death by autophagy was also evaluated by assessing the intracellular growth of parasites (Fig. 8D). In venom-treated LLC-MK2 cells, we observed a 52% reduction in the number of intracellular parasites. When cells were incubated in the presence of A. mellifera venom plus the inhibitor 3-MA, the reduction growth was of 34%, showing that 3-MA reverses the cell death at least partially (Fig. 8D). These data are statistically different (P ⩽0·05) confirming the autophagy-like cell death phenomenon.
The data set obtained with the use of ultrastructural techniques and fluorescent markers strongly suggests that the mechanisms of cell death triggered by the venom of A. mellifera in all developmental T. cruzi forms are mostly autophagy and apoptosis, respectively.
DISCUSSION
Natural products (such as animal venom) and their derivatives represent more than 30% of pharmaceuticals currently on the market (Kirkpatrick, Reference Kirkpatrick2002) and are the major sources of innovative therapeutic agents for diseases caused by bacteria, parasites and fungi (Altmann, Reference Altmann2001). Following this approach, animal venom (mostly from snakes) has been screened as potentially useful for the treatment of neglected diseases caused by parasites, including Chagas disease (Ciscotto et al. Reference Ciscotto, Machado de Avila, Coelho, Oliveira, Diniz, Farías, Carvalho, Maria, Sanchez, Borges and Chávez-Olórtegui2009; Gonçalves et al. Reference Gonçalves, Soares, De Souza, DaMatta and Alves2002; Tempone et al. Reference Tempone, Andrade, Spencer, Lourenço, Rogero and Nascimento2001; Adade et al. Reference Adade, Cons, Melo and Souto-Padrón2011) and Leishmaniasis (Fernandez-Gomez et al. Reference Fernandez-Gomez, Zerrouk, Sebti, Loyens, Benslimane and Ouaissi1994; Brand et al. Reference Brand, Leite, De Sa Mandel, Mesquita, Silva, Prates, Barbosa, Vinecky, Martins, Galasso, Kuchelhaus, Sampaio, Furtado, Andrade and Bloch2006; Toyama et al. Reference Toyama, Toyama, Passero, Laurenti, Corbett, Tomokane, Fonseca, Antunes, Joazeiro, Beriam, Martins, Monteiro and Fonteles2006; Passero et al. Reference Passero, Tomokane, Corbett, Laurenti and Toyama2007; Tempone et al. Reference Tempone, Sartorelli, Mady and Fernandes2007).
The therapeutic application of honeybee venom for the chemotherapy of various diseases is known as bee venom therapy (Son et al. Reference Son, Lee, Lee, Song, Lee and Hong2007) and has mainly been used to treat arthritis (Park et al. Reference Park, Lee, Son, Oh, Kim, Song, Kim, Oh, Yoon and Hong2004), rheumatism (Kwon et al. Reference Kwon, Lee, Han, Mar, Kang, Yoon, Beitz and Lee2002), back pain (Chen et al. Reference Chen, Li, Li, Shang, Liu, Lu, Zhang, Ji, Gao and Chen2006) and cancerous tumours (Huh et al. Reference Huh, Baek, Lee, Choi, Park and Lee2010; Park et al. Reference Park, Choi, Kwak, Oh, Yoon do, Han, Song, Song and Hong2011). However, despite the information available about the pharmaceutical properties of A. mellifera venom, no studies had previously been performed to evaluate the effect of crude venom on parasitic protozoa. Only a few studies have tested the anti-parasitic effects of melittin (Diaz-Achirica et al. Reference Díaz-Achirica, Ubach, Guinea, Andreu and Rivas1998; Chicharro et al. Reference Chicharro, Granata, Lozano, Andreu and Rivas2001; Luque-Ortega et al. Reference Luque-Ortega, Saugar, Chiva, Andreu and Rivas2003; Alberola et al. Reference Alberola, Rodríguez, Francino, Roura, Rivas and Andreu2004; Pérez-Cordero, Reference Pérez-Cordero, Lozano, Cortés and Delgado2011) and PLA2 (Moreira et al. Reference Moreira, Ito, Ghosh, Devenport, Zieler, Abraham, Crisanti, Nolan, Catteruccia and Jacobs-Lorena2002; Guillaume et al. Reference Guillaume, Deregnaucourt, Clavey and Schrével2004, Boutrin et al. Reference Boutrin, Foster and Pentreath2008), the two main components of bee venom. Thus far, only 2 studies have shown the lytic effects of melittin on T. cruzi epimastigotes and trypomastigotes (Azambuja et al. Reference Azambuja, Mello, D'Escoffier and Garcia1989; Fieck et al. Reference Fieck, Hurwitz, Kang and Durvasula2010), and these studies did not investigate the effects on the intracellular forms of the parasites or consider the effects of melittin on host cells. Thus, the aim of this study was to evaluate bee venom as a source of compounds with potential and promising effects for Chagas disease treatment by investigating the in vitro effect of A. mellifera crude venom on all T. cruzi developmental forms, characterizing its target organelles and death phenotypes and evaluating its toxicity to the host cells.
Our results showed that all T. cruzi evolutive forms suffered remarkably from the action of the venom. Epimastigotes (i.e., the proliferative insect vector-borne stage), trypomastigotes (i.e., the infective, non-proliferative form), and intracellular amastigotes (i.e., the infective, proliferative form) were found to be sensitive to the venom. The different IC50/1 day or LD50/1 day values indicate that low doses are effective mainly against the infective forms. Additionally, all the A. mellifera venom concentrations tested that were effective against the parasite did not exhibit toxicity to the cell host, as observed by TEM and assessed by the Trypan blue exclusion test and the MTS assay.
The electron microscopy analysis of treated parasites strongly suggested that T. cruzi parasites were killed by different routes, leading to distinct death phenotypes. This suspicion was reinforced after flow cytometry, fluorimetry and fluorescence microscopy analyses, which revealed distinct staining behaviours in the different parasitic forms.
The cell death process corresponds to the cellular functions lost, originating from morphological, biochemical and/or molecular alterations and occurring through accidental (i.e., passive, with no energy expenditure) or programmed (i.e., active, with energy outlay) pathways (Sloviter, Reference Sloviter2002). Programmed cell death (PCD) is a genetically regulated process and is pivotal to the homeostasis of metazoan organisms, playing a fundamental role in morphogenesis, physiology and host defence against different pathogens, including avoiding an inflammatory response (Guimarães and Linden, Reference Guimarães and Linden2004). Based on morphological criteria and environmental conditions, PCD has been characterized into different types, such as apoptosis (I-PCD type), autophagy (II-PCD type) and programmed necrosis (III-PCD type) (Kroemer et al. Reference Kroemer, Galluzzi, Vandenabeele, Abrams, Alnemri, Baehrecke, Blagosklonny, El-Deiry, Golstein, Green, Hengartner, Knight, Kumar, Lipton, Malorni, Nuñez, Peter, Tschopp, Yuan, Piacentini, Zhivotovsky and Melino2009). Once triggered, apoptosis is mainly characterized by cytoplasmic retraction; chromatin condensation; chromosomal DNA fragmentation; mitochondrial swelling, with alterations in membrane potential and permeability; exposure of phosphatidylserine residues at the outer plasma membrane; activation of caspases; blebbing of the plasma membrane and the packing of cellular constituents into apoptotic vesicles (Guimarães and Linden, Reference Guimarães and Linden2004). In contrast, autophagy is a complex signalling pathway involving more than 30 well-conserved Atg proteins that functions to remove and/or remodel damaged cellular structures. It is morphologically characterized by autophagosome formation (i.e., double-membrane vesicles) that is responsible for the engulfment of cytoplasmic constituents, concentric membrane structures in the cytosol and surrounding organelles, and nuclear limited damage (Tsujimoto and Shimizu, Reference Tsujimoto and Shimizu2005; Meijer et al. Reference Meijer, van der Klei, Veenhuis and Kiel2007).
In unicellular eukaryotes, the occurrence and biological relevance of PCD pathways have been strongly demonstrated and debated (Arnoult et al. Reference Arnoult, Tatischeff, Estaquier, Girard, Sureau, Tissier, Grodet, Dellinger, Traincard, Kahn, Ameisen and Petit2001; Debrabant et al. Reference Debrabant and Nakhasi2003; Gordeeva et al. Reference Gordeeva, Labas and Zvyagilskaya2004). These pathways may play a role in the regulation of parasite number in biological vectors and in definitive host tissues, which can contribute to evasion from host immune defences and in the maintenance of clonality (Lüder et al. Reference Lüder, Gross and Lopes2001; Wanderley et al. Reference Wanderley, Moreira, Benjamin, Bonomo and Barcinski2006; Kaczanowski et al. Reference Kaczanowski, Sajid and Reece2011).
Here, we presented evidence that A. mellifera venom-treated parasites exhibited several morphological alterations that are consistent with the main features that characterize autophagy and apoptosis. Treated epimastigotes exhibited strong mitochondrial damage, although their kDNA networks were apparently well preserved. Additionally, the most remarkable feature detected was the endoplasmic reticulum profile surrounding different structures, suggesting autophagosome formation. Some of these alterations were confirmed by the decrease in the mitochondrial potential and the increase in monodansyl cadaverine (MDC) (evaluated by fluorimetry); further, the non-significant percentage of treated epimastigotes labelled by TUNEL staining (a DNA-nicking indicator) reinforced the suggestion of an autophagic cell death phenotype. Morphological changes observed in epimastigotes are in agreement with previous studies that described the capacity of A. mellifera venom and its components, such as PLA2 and melittin, to trigger apoptosis (caspase dependent or not) in a great range of tumour cells (Li et al. 2006; Chu et al. Reference Chu, Cheng, Huang, Chang, Chi, Su, Hsu, Wang, Chen, Liu, Lu, Huang, Ho and Jan2007; Wang et al. Reference Wang, Chen, Zhang, Yang, Li, Lü, Cao and Ling2009). However, although treated trypomastigotes also exhibited a considerable retraction of the cell body and swollen mitochondria, the most affected structures were the kDNA and the nucleus, which were characterized by profound changes in the filamentous arrays and by chromatin condensation, respectively. Flow cytometry analysis confirmed mitochondrial membrane depolarization but, unlike epimastigotes, treated trypomastigotes exhibited an increased number of cells that tested positive for TUNEL staining and low MDC fluorescence emission, strongly suggesting an apoptosis-like death phenotype. The analyses at the electron microscope of venom-treated intracellular amastigotes did not indicate any preferential kind of cellular phenotype death. The investigation with TUNEL reaction, MDC staining and 3-MA inhibitor, indicated that the treatment induced different cell death types, although apoptosis has been the most frequently observed (I-PDC type, up to 47·5% TUNEL-positive), followed by the autophagy (II-PDC type, up to 36% MDC-positive). Probably, the remaining 16·5% occurs by another cell death phenotype, such as necrosis (III-PCD type), that was not investigated in the present study. Additionally, taking into account the percentage of PI-positive cells after A. mellifera treatment, we can not disregard the fact that some of the treated epimastigotes and trypomastigotes were probably dying by necrosis. However, considering the ultrastructural observations and the use of different PCD probes analysed by fluorescence microscopy, fluorimetry and flow cytometry, treatment with the venom seemed to preferentially generate autophagy- and apoptosis-like cell death in epimastigotes and trypomastigotes, respectively.
Apoptosis-like cell death has already been reported in trypanosomatids, which have complex life cycles that involve multiple hosts, and its occurrence could influence their destiny, favouring their survival in their digenetic life cycle (Nguewa et al. Reference Nguewa, Fuertes, Valladares, Alonso and Pérez2004; Duszenko et al. Reference Duszenko, Figarella, Macleod and Welburn2006; Wanderley et al. Reference Wanderley, Pinto da Silva, Deolindo, Soong, Borges, Prates, de Souza, Barral, Balanco, do Nascimento, Saraiva and Barcinski2009). Furthermore, many anti-parasitic agents have been reported to induce apoptotic-like death in trypanosomatids (Lee et al. Reference Kwon, Lee, Han, Mar, Kang, Yoon, Beitz and Lee2002; De Souza et al. Reference De Souza, Menna-Barreto, Araújo-Jorge, Kumar, Hu, Boykin and Soeiro2006; Menna-Barreto et al. Reference Menna-Barreto, Corrêa, Cascabulho, Fernandes, Pinto, Soares and De Castro2009a,b), including animal venom such as Bothrops jararaca snake venom and its purified L-amino acid oxidase, in treated T. cruzi epimastigotes (Deolindo et al. Reference Deolindo, Teixeira-Ferreira, Melo, Arnholdt, De Souza, Alves and DaMatta2005, Reference Deolindo, Teixeira-Ferreira, DaMatta and Alves2010). This treatment caused mitochondrial swelling with an associated loss of membrane potential, kinetoplast disorganization, phosphatidylserine exposure, cytoplasmic retraction and DNA fragmentation (as determined by TUNEL staining). All these features are very similar to those of the T. cruzi trypomastigotes incubated with A. mellifera venom presented here, in addition to nuclear envelope dilatation and increased nuclear chromatin condensation, which was observed in bloodstream trypomastigotes treated with aromatic diamidines (De Souza et al. Reference De Souza, Menna-Barreto, Araújo-Jorge, Kumar, Hu, Boykin and Soeiro2006).
In a similar manner, autophagy has been described in different protozoans, including all pathogenic trypanosomatids (Kiel, Reference Kiel2010; Duszenko et al. Reference Duszenko, Ginger, Brennand, Gualdrón-López, Colombo, Coombs, Coppens, Jayabalasingham, Langsley, De Castro, Menna-Barreto, Mottram, Navarro, Rigden, Romano, Stoka, Turk and Michels2011). Because these parasites display different metabolic profiles depending on their life-cycle stage, autophagy is crucial for organelle turnover, maintaining the metabolic balance and recycling of cellular structures during normal cell growth, and its deregulation or over-stimulus leads to cell death without an inflammatory response (Besteiro et al. Reference Besteiro, Williams, Morrison, Coombs and Mottram2006; Alvarez et al. Reference Alvarez, Kosec, Sant Anna, Turk, Cazzulo and Turk2008). Different compounds have shown the capacity to induce trypanosomatid death by autophagy (Bera et al. Reference Bera, Singh, Nagaraj and Vaidya2003; Delgado et al. Reference Delgado, Anderson, Garcia-Salcedo, Caro and Gonzalez-Rey2009; Schurigt, et al. Reference Schurigt, Schad, Glowa, Baum, Thomale, Schnitzer, Schultheis, Schaschke, Schirmeister and Moll2010; Sandes et al. Reference Sandes, Borges, Junior, Silva, Carvalho, Rocha, Vasconcellos and Figueiredo2010; Monte Neto et al. Reference Monte Neto, Sousa, Dias, Barbosa Filho, Oliveira and Figueiredo2011), with the interesting finding that some drugs can promote different PCD pathways (including autophagy) in distinct morphological parasite forms, such as exhibited by naphthoimidazoles over T. cruzi epimastigotes and trypomastigotes (Menna-Barreto et al. Reference Menna-Barreto, Corrêa, Cascabulho, Fernandes, Pinto, Soares and De Castro2009a). Our results followed this pattern. In contrast to trypomastigotes, treatment of T. cruzi epimastigotes with the bee venom resulted in remarkable evidence of autophagy-like death. Other reports relate the occurrence of different PCD phenotypes caused by treatment with the same compound in Leishmania sp. (Monte-Neto et al. 2010; Schurigt et al. Reference Schurigt, Schad, Glowa, Baum, Thomale, Schnitzer, Schultheis, Schaschke, Schirmeister and Moll2010) and T. cruzi (Menna-Barreto et al. Reference Menna-Barreto, Salomão, Dantas, Santa-Rita, Soares, Barbosa and De Castro2009b; Sandes et al. Reference Sandes, Borges, Junior, Silva, Carvalho, Rocha, Vasconcellos and Figueiredo2010).
Some evidence has demonstrated that there is cross-talk and convergence between all PCD pathways in mammalian cells (Guimarães and Linden, Reference Guimarães and Linden2004). Because the different kinds of cellular death are controlled by signalling networks that frequently overlap, one stimulus can trigger apoptosis and autophagy in the same cell (Golstein and Kroemer, Reference Golstein and Kroemer2005; Levine and Yuan, Reference Levine and Yuan2005). Many model systems support the model that different cell death programmes may be triggered in distinct circumstances, such that an apoptotic death morphology can be produced without the involvement of caspases and that autophagic execution pathways may be engaged without either the involvement of caspases or morphological signs of apoptosis (Guimarães and Linden, Reference Guimarães and Linden2004). Each death phenotype can be variably expressed in different eukaryotic species and among distinct cell types within the same species and can be induced in a context-dependent fashion by identical initiating stimuli (Golstein and Kroemer, Reference Golstein and Kroemer2005). Our results can be considered in this context, in which A. mellifera venom treatment generated distinct cell death profiles in T. cruzi.
CONCLUSIONS
Chagas disease is an important neglected disease for which there is still inefficient chemotherapy and no vaccine. Furthermore, critical challenges remain, such as vectorial and oral transmission. The recent discovery of PCD occurrence in protozoan parasites encourages the investigation into the ideal drug for the treatment of chagasic patients, which must be capable of killing the T. cruzi parasite without triggering host defences. Natural products, such as A. mellifera bee venom, are available in different ecosystems around the world and are a great source for compound investigation and drug development. Our findings demonstrate that all T. cruzi developmental forms were acted upon by A. mellifera venom and displayed different PCD phenotypes. Thus, the regulation and modulation of these cell death routes requires more research to facilitate the development of specific and controlled therapeutic agents. These results are in agreement with previously published data that highlighted the potential use of animal venom as a tool for new therapeutic approaches.
ACKNOWLEDGEMENTS
We thank Edna Lúcia dos Santos Rocha, Lusinete da Rocha Bonfim and Tarcísio Corrêa for valuable technical assistance. This work was supported by Conselho Nacional de Desenvolvimento Científico e Tecnológico (CNPq-302440/2008–9 and Universal- 476564/ 2010–7) and Fundação de Amparo a Pesquisa do Estado do Rio de Janeiro (FAPERJ- E-26/ 102·581/2010, Pensa Rio- E-26/110·313/2010, Pronex- E-26/110·576/2010 and Cientista do Nosso Estado- E-26/102·299/2009).



