I. INTRODUCTION
Persistent luminescence, also known as long afterglow, is a special case of thermally stimulated luminescence. The energy stored in the material, absorbed from sunlight or lamps, is gradually released as visible light by the thermal energy available at ambience. Reference Eeckhout, Smet and Poelman1–Reference Brito, Hassinen, Hölsä, Jungner, Laamanen, Lastusaari, Malkamäki, Niittykoski, Novák and Rodrigues5 Persistent phosphors were widely used in areas, such as safety indication, emergency lighting, road signs, billboards, graphic arts, and interior decoration. Reference Zeng, Wang, Han, Chen, Li, Wang and Wen6,Reference Rodrigues, Brito, Hölsä and Lastusaari7 New applications for persistent phosphors have been extended to medical field in recent years, such as cancer photodynamic therapy, Reference Chen and Zhang8 cancer diagnoses, and in vivo imaging. Reference Wu, Wang, Chen and Yan9–Reference le Masne de Chermont, Chanéac, Seguin, Pellé, Maîtrejean, Jolivet, Gourier, Bessodes and Scherman11
The most known efficient persistent phosphors are Eu2+-activated alkaline earth aluminates, represented by SrAl2O4:Eu2+,Dy3+ (green) Reference Matsuzawa, Aoki, Takeuchi and Murayama12 and Sr2MgSi2O7:Eu2+,Dy3+ (blue). Reference Lin, Tang, Zhang, Wang and Zhang13 Other rare-earth ions are usually codoped to enhance the performance of these materials. In particular, Dy3+ and Nd3+ are often selected for this motive. The best phosphors (SrAl2O4:Eu2+,Dy3+) can continue emitting green light even in excess of 24 h in the dark. It could be extended to 15 days if infrared persistent phosphor Zn3Ga2Ge2O10:Cr3+ is included, Reference Pan, Lu and Liu14 though the costly raw materials may hinder its commercialization.
Recently, Hölsä et al. Reference Brito, Hölsä, Laamanen, Lastusaari, Malkamäki and Rodrigues2,Reference Rodrigues, Brito, Hölsä, Stefani, Felinto, Lastusaari, Laamanen and Nunes15 have developed plausible mechanisms for Eu2+- or Tb3+-activated persistent phosphors. They depicted figures to elucidate the trapping and detrapping processes of charge carriers. Nevertheless, there are many issues that still need consideration, such as, the nature of traps, the role of the codoping lanthanide ions, the concentration quenching of persistent luminescence, the energy levels of dopants with respect to host conduction/valence band (CB/VB), the point defects resulting from doping, etc.
The structure of LiBaPO4 was reported to be crystallized in a hexagonal crystal system by Boutinaud et al., Reference Boutinaud, Parent, Flem, Moine and Pedrini16,Reference Paques-Ledent17 which is isomorphic with the β-SiO2 tridymite. In the crystal lattice, every PO4 tetrahedron connects with four LiO4 tetrahedrons by corner sharing and every LiO4 tetrahedron also connects with four PO4 tetrahedrons. There are three Ba2+ sites, two 9-coordinated (CN) and one 6-CN, which can be replaced by rare earth dopants.
More recently, the syntheses and luminescent properties of rare earth–activated LiBaPO4 have been reported. Reference Sun, Zhang, Xia and Du18–Reference Zhang, Nakai, Tsuboi, Huang and Seo23 The persistent luminescent phenomena of LiBaPO4:Eu2+ have also been mentioned in Ref. Reference Zhang, Nakai, Tsuboi, Huang and Seo23. In previous works, we investigated the persistent luminescence of Eu2+-activated SrMg2(PO4)2 Reference Ju, Hu, Chen, Wang and Hung24 and Ba5(PO4)3Cl. Reference Ju, Hu, Chen and Wang25,Reference Ju, Hu, Chen, Wang and Mu26 In these phosphate persistent phosphors, we found that Y3+, La3+, Ce3+, Gd3+, Tb3+, and Lu3+ may improve the performance of Eu2+-activated phosphate persistent phosphors, while Pr3+, Nd3+, Dy3+, Ho3+, and Er3+ usually can enhance the persistent luminescence of Eu2+-activated aluminates or silicates. In the present paper, we report our studies on Eu2+-activated LiBaPO4. The luminescent properties and the mechanism of persistent luminescence of LiBaPO4:Eu2+ were systematically investigated by means of photoluminescent excitation (PLE) and emission (PL) spectra, persistent luminescence, decay curves, and thermoluminescence spectra.
II. EXPERIMENTAL
A. Synthesis
LiBaPO4:Eu2+ powders were synthesized using a high temperature solid state reaction method. Stoichiometric amounts of starting materials Li2CO3 (98.0%, Kemiou Chemical Reagent Co., Ltd., Tianjin, China), BaCO3 (99.0%, Kemiou Chemical Reagent Co. Ltd., Tianjin, China), (NH4)2HPO4 (99.0%, Regent Chemicals Co., Ltd., Tianjin, China), and Eu2O3 (99.99%, Guangdong Research Institute of Non-ferrous Metals, Guangzhou, China) were weighed and thoroughly mixed in an agate mortar. The obtained mixtures were put in corundum crucibles and prefired at 500 °C for 3 h. After regrinding, the samples were sintered at 1200 °C for another 3 h under a flowing atmosphere of forming gas (90% N2, 10% H2). We also synthesized LiBaPO4 (i.e., the host) and LiBaPO4:0.05Eu3+. The final sintering procedure of these two samples was conducted in air. After cooling in a natural way, the powders were recuperated from the crucibles and ground in a mortar for the next characterizations.
B. Measurement
Phase purity of the prepared samples was checked by powder x-ray diffraction (XRD) using a diffractometer with Cu Kα radiation (λ = 1.5406 Å) at 36 kV tube voltage and 20 mA tube current. Diffuse reflectance spectra were obtained by a UV-visible spectrophotometer (Shimadzu UV-2450, Japan) using BaSO4 as a reference. The PLE and PL spectra of the samples were recorded by a Hitachi F-7000 fluorescence spectrophotometer (Japan). The persistent luminescence spectra were also measured using the spectrophotometer by shutting off the Xe lamp. The decay curves were measured by a GFZF-2A single-photon-counter system. The thermoluminescence curves were measured with a FJ-427A1 thermoluminescence meter (China). Prior to the persistent luminescence spectra, decay curve, and glow curve measurements, the samples were excited for 1 min by a 15 W low-pressure mercury discharge lamp (254 nm). For the glow curve measurements, the heating rate was 1 °C/s. The range of the measurement is from room temperature to 250 °C. A delay of 1 min was used between the irradiation and measurement. All the measurements (except for thermoluminescence) were carried out at room temperature.
III. RESULTS AND DISCUSSION
A. XRD phase
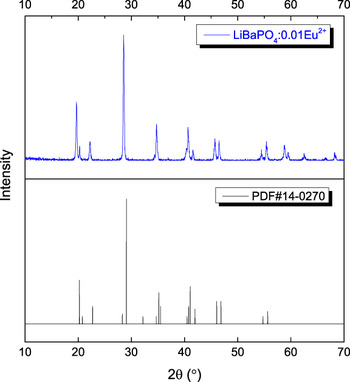
The powder XRD patterns of LiBaPO4:0.01Eu2+ are shown in Fig. 1. All of the peaks can be indexed based on hexagonal structure and match well with the PDF#14-0270, indicating that the obtained samples are of single phase and the doped Eu2+ ions do not cause any significant change in the host crystal structure. The Eu2+ ions are supposed to reside on Ba2+ sites, because they have similar ionic radii and valences.
The XRD pattern of LiBaPO4:0.01Eu2+ phosphor (upper) and that of PDF#14-0270 is given for comparison (bottom).

B. Reflectance
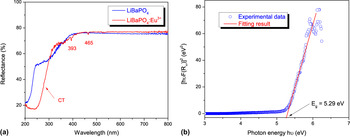
Figure 2(a) presents the diffuse reflectance spectra of LiBaPO4 and LiBaPO4:Eu3+. The spectrum of LiBaPO4 shows a platform of high reflectance in the wave length range of 380–800 nm and then starts to decrease dramatically from 380 to 200 nm. This band is due to the host absorption. The body color of LiBaPO4 is white, which agrees well with the spectrum. The near edge relation between absorption coefficient (α) and band gap E g for a direct band gap material can be described by the following equation Reference Omar27–Reference Amirtharaj, Seiler and Bass31 :
 $${\left( {{\rm{\alpha }}h{\rm{\nu }}} \right)^2} = A\left( {h{\rm{\nu }} - {E_{\rm{g}}}} \right)\quad ,$$
where A is a constant involving the properties of the bands and hν is the photon energy. According to Kubelka–Munk theory, absorption coefficient α in Eq. (1) can be substituted with Reference Simmons32–Reference Nobbs34
 $$F\left( {{R_\infty }} \right) = {{{{\left( {1 - {R_\infty }} \right)}^2}} \over {2{R_\infty }}}\quad ,$$
in which R ∞ is the reflectance of an infinitely thick material. It can be substituted with experimentally observed reflectance, because the transmittance of our samples is effectively zero. Figure 2(b) depicts the Tauc plot of LiBaPO4 that is widely used for the determination of band gap. A line is drawn in the near edge region tangent to the point of inflection on the curve, and the hν value at the point of intersection of the tangent line and the horizontal axis gives the band gap E g = 5.29 eV.
(a) Diffuse reflectance spectra of LiBaPO4 and LiBaPO4:Eu3+; (b) determination of the optical band gap (E g) using Tauc plot for LiBaPO4.

Dorenbos argued that the charge transfer (CT) energy of Eu3+ is a direct measure for the energy difference between the top of the VB and the 4f ground state of the Eu2+. Reference Dorenbos35,Reference Dorenbos36 The energy of Eu2+ excited states as well as the ground state with respect to the band states of the host is crucial to understand the trapping and detrapping processes in a persistent phosphor. Therefore, we synthesized LiBaPO4:Eu3+ and measured its diffuse reflectance spectrum. When Eu3+ ions are introduced into the host, new lines and band occur. The lines are ascribed to the intraconfigurational 4f–4f transitions of Eu3+ in the host: from 7F0 to 5L6 and 5D2 at wave lengths 393 and 465 nm, respectively. Reference Carnall, Fields and Rajnak37 The broad absorption band centered at ∼300 nm can be attributed to CT band arising from the top of VB to Eu3+ ion. The CT band overlaps the host fundamental absorption band; therefore, the absorption band in the 200–350 nm area changed. Our UV-visible spectrophotometer (Shimadzu UV-2450) was equipped with only one monochromator, and the emission of Eu3+ under CT excitation results in a false reflectance band at ∼320 nm. The 4f–4f transitions of Eu3+ are both parity and spin forbidden; therefore, these absorption/emission lines are usually weak. The diffuse reflectance spectrum of LiBaPO4:Eu2+ is not achievable due to its efficient luminescence.
C. Photoluminescence
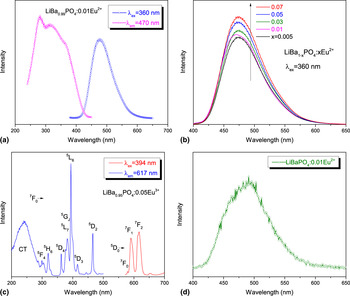
The steady-state PL and PLE spectra for the Eu2+-activated LiBaPO4 are shown in Fig. 3(a). An intense broad band centered at ∼470 nm and can be attributed to the electric-dipole-allowed 4f 65d 1 → 4f 7 (8S7/2) transition of Eu2+ was observed at ambient temperature. The emission band has a full width at half maximum (FWHM) of about 3400 cm−1 that is larger than the characteristic value for Eu2+ emission in this wavelength region. This suggests that there is more than one site for the Eu2+ ions in the host lattice, which agrees with the crystal data. Monitored by the emission at 470 nm, the PLE spectrum exhibits an unresolved broad band in the range from 250 to 450 nm, which can be assigned to the transitions from the ground state 8S7/2(4f 7) to the crystal-field-split components of the 4f 65d 1 configuration. The Stokes shift of LiBaPO4:Eu2+ was estimated to be 6000 cm−1. This is much larger than the normal value of 1000–4000 cm−1 reported by Dorenbos. Reference Dorenbos38 The cyan emission of Eu2+ in the host is mainly due to the large relaxation after the absorption of pump light.
(a) The PLE and PL spectra of LiBaPO4:Eu2+, (b) PL spectra of LiBa1−x PO4:xEu2+, (c) the PLE and PL spectra of LiBaPO4:Eu3+, and (d) persistent luminescence spectra of LiBaPO4:Eu2+.

The variation of emission intensities of LiBa1−x PO4:xEu2+ phosphors with Eu2+ concentration (x) is shown in Fig. 3(b). It is obviously seen that the PL features of Eu2+ on the peak shape and positions remain unchanged as the concentration of Eu2+ ions increases. The concentration quenching of activators requires considerable energy overlap between PLE and PL spectra as well as the concentration of activators. We did not observe concentration quenching in the experimental range.
The PLE and PL spectra of LiBaPO4:Eu3+ are shown in Fig. 3(c). The PLE spectrum by monitoring the 5D0 → 7F2 emission (617 nm) of Eu3+ ions consists of a broad band and some sharp lines in the UV and visible region. In the visible range, one observes well-separated excitation lines due to transitions from the ground state 7F0 to the levels 5DJ, 5LJ, etc. The broad excitation band centered at 240 nm corresponds to a broad 2p → 4f CT band, which gives rise to allowed electric dipole transitions. The CT band is weaker than the intraconfigurational 4f–4f transitions, even though the 4f–4f transitions are both spin and parity forbidden, which indicates that most of the CT energy lost in the host lattice is due to nonradiative transitions. Upon the excitation with 394 nm, the PL spectra of LiBaPO4:Eu3+ display 5D0 → 7FJ (J = 0–2) emission lines of the Eu3+ ions. Because of efficient multiphonon relaxation in the phosphors, no emission from higher Eu3+ excited levels was detected. The bold lines imply that the spectrum has complex structure at high resolution because of the variety of Eu3+ sites and low site symmetry.
D. Persistent luminescence
After removal of the excitation light of 254 nm (low-pressure mercury discharge lamp) at room temperature, bright persistent luminescence was observed in LiBaPO4:Eu2+. The spectral shape [Fig. 3(d)] of the persistent luminescence is in agreement with that of the PL spectrum of LiBaPO4:Eu2+. Upon 365 nm (high-pressure mercury discharge lamp) excitation, LiBaPO4:Eu2+ fluoresce efficiently; however, after ceasing the excitation, only weak persistent luminescence was observed.
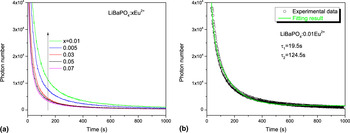
Figure 4 shows the afterglow intensity as a function of time for the different concentrations of activator after 1 min excitation (254 nm). A concentration of x = 0.01 doped Eu2+ ions gives the brightest afterglow, although we did not observe concentration quenching for fluorescence even for x = 0.07 [Fig. 3(b)]. For most persistent phosphors, the concentration dependence of persistent luminescence is different from photoluminescence in view of their different mechanisms. The fluorescence quenching is due to the energy transfer between activators, which requires considerable interaction and energy resonance between activators. Reference Blasse and Grabmaier39 On the other hand, persistent luminescence quenching results from electron transfer between traps/activators by tunneling, which requires electron cloud overlap and also energy resonance. Reference Ju, Hu, Chen, Wang and Mu40 The width of potential barrier will be reduced at high Eu2+ concentrations. Therefore, the probability of tunneling increases and the trapped electrons can easily reach activators even at room temperature. The situation could be worse for shallow traps.
(a) The persistent luminescence isothermal decay curves of LiBa1−x PO4:xEu2+ and (b) fitting results of LiBaPO4:0.01Eu2+ by I(t) = I 0 + A exp(−t/τ1) + B exp(−t/τ2).

For many Eu2+-activated persistent luminescent materials, the afterglow intensity and duration can be improved by codoping certain rare earth elements. In particular, Dy3+ and Nd3+ are often chosen for this motive to enhance the afterglow of aluminates and silicates. This enhancement is attributed to creation or modification of traps in the material by the codopant. Reference Ju, Hu, Chen, Wang and Mu26 For LiBaPO4:Eu2+, different rare earth elements (Y3+, La3+, Ce3+, Gd3+, Tb3+, Dy3+, and Lu3+) were chosen as codopant but they hardly improve the afterglow. Instead, the La3+or Ce3+ codoped samples quenched the afterglow of LiBaPO4:Eu2+.
In general, a decay process of a persistent phosphor contains a short-exponential decaying process and a long-exponential decaying one. Reference Sakai, Katsumata, Komuro and Morikawa41 The long-decaying process determines the duration of the afterglow. The decay curves of LiBaPO4:Eu2+ phosphor are well fitted with the double simple exponential function:
 $$I(t) = {I_0} + A\exp \left( { - t/{{\rm{\tau }}_1}} \right) + B\exp \left( { - t/{{\rm{\tau }}_2}} \right)\quad ,$$
where I(t) and I 0 are the persistent luminescence intensities at times t and background, respectively; A and B are constants; and τ1 and τ2 are the decay times for the short and long decay components, respectively. The decay time values were determined to be 19.5 and 124.5 s, respectively.
E. Thermoluminescence
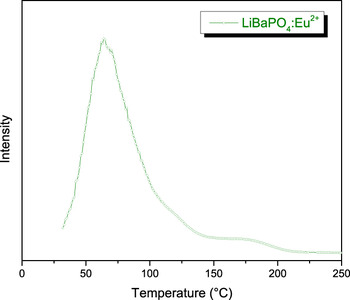
The persistent luminescence phenomenon is a special case of thermally stimulated luminescence at room temperature. Reference Rodrigues, Brito, Hölsä and Lastusaari7 Thermoluminescence measurements provide important information on the nature of the traps in the persistent phosphors. Reference McKeever4 The glow curve of LiBaPO4:Eu2+ is shown in Fig. 5. A strong thermoluminescence band with maximum at 65 °C characterizes the glow curve, along with a much weaker band at high temperature. The trap depth E T of the strong glow band can be calculated by the Urbach method, Reference McKeever4,Reference Shalgaonkar and Narlikar42
 $${E_{\rm{T}}} = {T_{\rm{m}}}{\rm{/500}}\quad {\rm{,}}$$
where T m is the peak temperature (in Kelvin). The estimated trap depth for the glow peak is 0.68 eV. According to Ref. Reference Matsuzawa, Aoki, Takeuchi and Murayama12, the optimum trap depth is in the range of 0.4–0.7 eV, which is suitable for the thermal release rate at room temperature. Apparently, the strong glow peak at ∼65 °C is mainly responsible for the persistent luminescence at room temperature.
Thermoluminescence curve of LiBaPO4:Eu2 +.

F. The energy level scheme of LiBaPO4:Eu2+
The energy of Eu2+ excited/ground states with respect to the band states of the host is crucial to understand the trapping and detrapping processes in a Eu2+-activated persistent phosphor. The ground level energy for the Eu2+ ion in the host band structure of LiBaPO4 is difficult to obtain. The CT method Reference Dorenbos35,Reference Dorenbos36 is not straightforward as it appears. Actually, if Eu3+ ion replaces a divalent ion (e.g., Ba2+ in the present case), Eu2+ and Eu3+ reside in different coordination polyhedra due to the charge-compensating defects. Reference Ju, Hu, Chen, Wang and Hung24 The energy of the end state of CT is higher than the ground state of Eu2+ resulting from the repulsion of the charge-compensating defects. Indeed, the CT energy is usually close to the bottom of CB when Eu3+ replaces a divalent ion. The excited level energy for the Eu2+ ion in the host band structure of LiBaPO4 is also difficult to obtain. Dorenbos suggested that the thermal quenching in Eu2+-activated compounds is due to the ionization of Eu2+, which is caused by the relatively small energy separation between the 5d levels of Eu2+and the bottom of the CB. Although some authors agree with this assumption, Reference Smet, Eeckhout, Bos, Kolk and Dorenbos44 thermally assisted cross-over in the configuration coordinate diagram cannot be expelled yet, especially in cases in which large Stokes shift were observed, as in LiBaPO4:Eu2+.
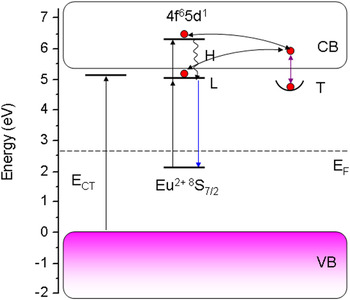
The response of our phosphors to 254 and 365 nm UV implies that pumping to higher excited states of Eu2+ redound to trap filling, so the lower 4f 65d 1 states are placed below the bottom of CB while the higher 4f 651 states are placed in the CB. Once the lowest excited state is determined, the ground level can be estimated by analyzing the PLE and PL spectra. The interaction between the 5d electron and the 4f 6 core leads to a staircase energy structure on the low-energy side with intervals close to those of the multiplet 7FJ (J = 0–6) of Eu3+. Reference Haecke, Smet and Poelman45 Using the intersection point (423 nm) of the PLE and PL curves, the lowest excited state of the 7FJ multiplet of the 4f 6 configuration (zero-phonon line) was determined to be 2.93 eV. Based on the considerations presented above, a rudimentary energy level scheme was constructed in Fig. 6.
Energy level scheme for luminescence in LiBaPO4:Eu2+, T and E F refer to traps and Fermi level, respectively. Arrows indicate electron transfer or transition.

With the scheme in Fig. 6 and the mechanism proposed by Hölsä et al., Reference Brito, Hölsä, Laamanen, Lastusaari, Malkamäki and Rodrigues2,Reference Rodrigues, Brito, Hölsä and Lastusaari7,Reference Rodrigues, Brito, Hölsä, Stefani, Felinto, Lastusaari, Laamanen and Nunes15,Reference Aitasalo, Hölsä, Jungner, Lastusaari and Niittykoski46 the trapping and detrapping processes in the material can be depicted. Under the irradiation by UV light, Eu2+ is pumped to its 4f 65d 1 states, which are partly inside the CB. LiBaPO4:Eu2+ is an efficient phosphor, so that the excited Eu2+ will mostly relax to its lowest 4f 65d 1 state and then radiatively back to its ground level. In addition to photoluminescence, small amounts of Eu2+ ions are ionized. These create free electrons in the CB and Eu3+ ions are left behind. Different research groups have recently confirmed this kind of valence-state change of europium. Reference Carlson, Hölsä, Laamanen, Lastusaari, Malkamäki, Niittykoski and Valtonen47–Reference Korthout, Eeckhout, Botterman, Nikitenko, Poelman and Smet50 The delocalized electrons are trapped by positive lattice defects from the CB. The thermal energy at ambient temperature causes the detrapping of the trapped electrons to the CB. The delocalized electrons can go back to a Eu3+ core and subsequently emission occurs. Tunneling recombination is also possible if defects are situated near the Eu3+ cores.
IV. CONCLUSIONS
In this work, persistent phosphors LiBa1−x PO4:xEu2+ were prepared and characterized. The bright persistent luminescence predominates at ∼470 nm, due to the 4f 65d 1 → 4f 7 transitions of Eu2+ at Ba2+ sites. A strong thermoluminescence band with maximum at 65 °C related to traps appeared in thermoluminescence curve. The persistence emission of our phosphors can effectively be excited by wavelengths shorter than 365 nm. A rudimentary energy level scheme was constructed based on the spectral data. We used Hölsä’s persistent luminescence mechanism to explain the trapping and detrapping processes in the materials, but the nature of the traps is still unclear. Further studies to optimize preparation conditions for the optimal intensity and duration of persistent luminescence of the phosphor are under our consideration.
ACKNOWLEDGMENT
This work is supported by the National Natural Science Foundation of China (Grant No. 21271049).