Introduction
Fascioliasis is a zoonotic parasitic disease caused by the liver flukes Fasciola hepatica and Fasciola gigantica that parasite the liver and bile ducts of ruminant animals (Mas-Coma et al. Reference Mas-Coma, Valero and Bargues2022; Vázquez et al. Reference Vázquez, Alba, Alda, Vittecoq and Hurtrez-Boussès2022). Recognized as a neglected tropical disease, fascioliasis has become a growing global concern. Fascioliasis is the most prevalent trematode infection, affecting humans and animals in over 81 countries around the globe (Lan et al. Reference Lan, Zhang, Jia, Zhang, Wang, Zhang, Gao and Wang2024; Rosas-Hostos Infantes et al. Reference Rosas-Hostos Infantes, Paredes Yataco, Ortiz-Martínez, Mayer, Terashima, Franco-Paredes, Gonzalez-Diaz, Rodriguez-Morales, Bonilla-Aldana, Vargas Barahona, Grimshaw, Chastain, Sillau, Marcos and Henao-Martínez2023). Fascioliasis is a major threat to veterinary public health. Globally, around 2.4 million people are infected, with millions more at risk, especially in areas with sheep and cattle farming (WHO 2021). In livestock, the disease causes estimated annual losses of $3.2 billion worldwide (Mehmood et al. Reference Mehmood, Zhang, Sabir, Abbas, Ijaz, Durrani, Saleem, Ur Rehman, Iqbal, Wang, Ahmad, Abbas, Hussain, Ghori, Ali, Khan and Li2017).
F. hepatica has two hosts: a definitive host (e.g., ruminants and humans) and an intermediate host, the snail Lymnaea. In the definitive host, adult flukes produce eggs that are excreted with bile into the feces. In the external environment, under favorable conditions, the eggs develop into miracidium, which infect the intermediate host, Lymnaea. Inside the snail, the parasite undergoes several stages after miracidium penetration, leading to the formation of cercariae. These cercariae leave the snail, swim in the water, and transform into the highly resistant metacercariae. Definitive hosts are infected by consuming these metacercariae, which can cause significant health problems (Houang Quang et al. Reference Hoang Quang, Levecke, Do Trung, Devleesschauwer, Vu Thi Lam, Goossens, Polman, Callens, Dorny and Dermauw2024; Mas-Coma et al. Reference Mas-Coma, Valero and Bargues2019).
Humans typically acquire the infection by ingesting contaminated water or vegetables. Symptoms in humans can range from fever and abdominal pain to diarrhea and nausea, particularly during the acute and chronic stages (Mehmood et al. Reference Mehmood, Zhang, Sabir, Abbas, Ijaz, Durrani, Saleem, Ur Rehman, Iqbal, Wang, Ahmad, Abbas, Hussain, Ghori, Ali, Khan and Li2017). Additionally, fascioliasis is associated with anemia and weight loss, particularly in children, who are especially vulnerable to devastating long-term complications, such as delayed growth and poor neurocognitive development (Caravedo and Cabada Reference Caravedo and Cabada2020). The global prevalence of human fascioliasis was estimated between 4.5% and 5%, representing a significant disease burden (Lan et al. Reference Lan, Zhang, Jia, Zhang, Wang, Zhang, Gao and Wang2024; Rosas-Hostos Infantes et al. Reference Rosas-Hostos Infantes, Paredes Yataco, Ortiz-Martínez, Mayer, Terashima, Franco-Paredes, Gonzalez-Diaz, Rodriguez-Morales, Bonilla-Aldana, Vargas Barahona, Grimshaw, Chastain, Sillau, Marcos and Henao-Martínez2023).
Livestock, particularly sheep and cattle, along with goats, equines, and camels, have played a significant role in the worldwide dissemination of this disease (Mehmood et al. Reference Mehmood, Zhang, Sabir, Abbas, Ijaz, Durrani, Saleem, Ur Rehman, Iqbal, Wang, Ahmad, Abbas, Hussain, Ghori, Ali, Khan and Li2017). In animals, fascioliasis leads to reduced growth rates, decreased fertility, lower meat and milk production, and increased mortality. Affected animals often exhibit prolonged fever, hepatomegaly, eosinophilia, anorexia, weight loss, anemia, liver damage, and even death (Taghipour et al. Reference Taghipour, Zaki, Rostami, Foroutan, Ghaffarifar and Fathi2019). Postmortem examinations reveal characteristic pathology, such as pale, firm liver tissue, fibrosis, calcified and thickened bile ducts, and the presence of both adult and immature flukes (Howell et al. Reference Howell, Baylis, Smith, Pinchbeck and Williams2015).
The disease also impacts livestock productivity, resulting in reduced growth rates, decreased fertility, lower meat and milk production, and increased mortality. Additionally, the livestock industry incurs substantial economic losses due to the costs of anti-helmintic treatments, labor, and liver condemnation during meat inspections (Taghipour et al. Reference Taghipour, Zaki, Rostami, Foroutan, Ghaffarifar and Fathi2019). Globally, the pooled prevalence of ruminant fascioliasis ranged between 13% and 17% (Lan et al. Reference Lan, Zhang, Jia, Zhang, Wang, Zhang, Gao and Wang2024).
Several risk factors contribute to the prevalence of fascioliasis in ruminants, including host and parasite biology, flock management, and the availability of the intermediate host snail (El-Tahawy et al. Reference El-Tahawy, Bazh and Khalafalla2017; Zhang et al. Reference Zhang, Feng, Ma, Zheng, Yin, Qin, Zhou, Zhao and Zhu2017). Also, environmental factors such as temperature, moisture, and seasonal changes, as well as animal health and grazing practices, influence the spread of the disease (Chakraborty and Prodhan Reference Chakraborty and Prodhan2015).
Fascioliasis represents a significant threat to livestock productivity, human health, and the global livestock industry. This systematic review and meta-analysis aim to assess the prevalence of fascioliasis and identify associated risk factors in Algeria. To the best of our knowledge, this is the first study of its kind in the country. Its findings are expected to guide targeted research efforts and support the development of effective prevention and control strategies.
Material and methods
Study design
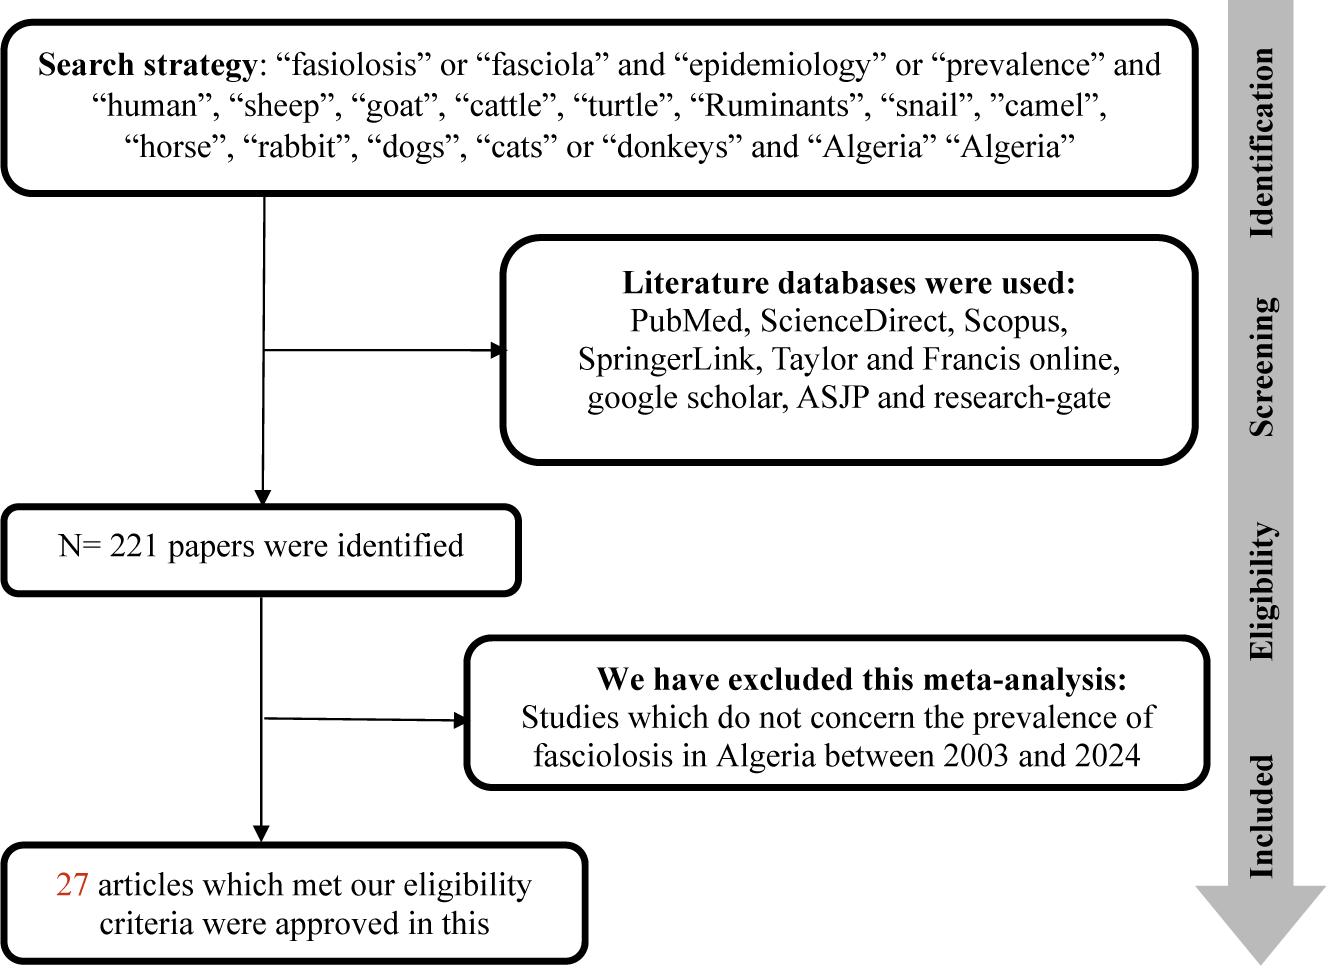
This systematic review was carried out to explore the prevalence and risk factors associated with fasciolosis in Algeria. It was carried out in accordance with the recommendations of the PRISMA (Preferred Reporting Items for Systematic Reviews and Meta-Analyses) guideline (Moher et al. Reference Moher, Liberati, Tetzlaff and Altman2009). Relevant studies were identified by consulting nine literary databases, including PubMed, ScienceDirect, Scopus, ASJP, Taylor and Francis, ClinicalKey, SpringerLink, ResearchGate, and Google Scholar.
The search criteria were defined in advance, and the search was carried out on March 3, 2024, with a last update on July 17, 2024.
The search string used was ‘fasiolosis’ or ‘Fasciola’ and ‘epidemiology’ or ‘prevalence’ and ‘sheep’, ‘goat’, ‘cattle’, ‘ruminants’, ‘human’, ‘camel’, ‘horse’, ‘rabbit”, ‘dogs’, ‘cats’ or ‘donkeys’, and ‘Algeria’ (Figure 1).
Flowchart describing the study design process.

Data collection and eligibility criteria
For this review, two investigators studied titles and the abstracts of all the articles and retrieved data. We inclusively searched all databases.
The aim of the study was to examine the prevalence of fasciolosis in Algeria. We adopted the following inclusion criteria:
-
1. The selected study should evaluate the prevalence of fasciolosis in a definitive host, excluding the intermediate host from the analysis;
-
2. The selected study should include the total number of individuals tested and the infection positivity rate.
-
3. The selected study should present a clear detection method (coproscopy, liver inspection, ELISA, grinding method, snail dissection, multiplex PCR, bile test under microscope, IEP, and data collected from abattoirs).
-
4. The selected study must be located in Algeria, mentioning the precise sampling area.
-
5. The selected studies must have been carried out between 2003 and 2024.
Articles not meeting these criteria were excluded.
The bibliographic references collected were carefully examined to eliminate duplicates, studies conducted outside Algeria, and those outside the study period.
Articles presenting epidemiological parameters of interest and reporting the prevalence of fasciolosis were included in the study (Table 1).
Prevalence (CI 95%) of Fasciola hepatica infestation according to regions, hosts, and detection methods

ELISA: Enzyme-linked immunosorbent assay. IEP: immunoelectrophoresis
The following data were extracted from the literature: first author, year of publication, animal species, prevalence rate, geographical study area, sample size, number of positive cases, diagnostic tests, risk factors, and study period (Tables 1 and 2). References to published data were also noted to extend the study and avoid missing valuable information.
Variation in the prevalence of F. hepatica infestation and the Odds Ratio (OR) based on different risk factors

Data analysis
Data were recorded in a Microsoft Excel spreadsheet and analysed by MetaXL version 4.0 software (EpiGear Int Pty Ltd., Wilston) for the meta-analyses and graphed as a forest plot and linear regression. Random-effect model analysis was used to estimate the overall prevalence of fasciolosis, and a forest plot was generated to visually assess the presence of heterogeneity, which occurred at a high level (Borenstein et al. 2010). Subgroup analysis was performed according to region, publication year, sampling method, and sample size to identify potential sources of heterogeneity.
To correct for biases related to the imperfect specificity of the ELISA test, we estimated the true prevalence by adjusting the observed test results. This compensates for the false positives and false negatives generated by the limitations of the ELISA test. This calculation was performed based on a sensitivity of 90% and a specificity of 94% for ELISA, according to Rapsch et al. (Reference Rapsch, Schweizer, Grimm, Kohler, Bauer, Deplazes, Braun and Torgerson2006).
The formula to estimate the adjusted true prevalence is as follows:
 $$ \mathrm{True}\ \mathrm{Adjusted}\ \mathrm{Prevalence}=\frac{\mathrm{Observed}\ \mathrm{prevalence}+\mathrm{Specificity}-1}{\mathrm{Sensibility}+\mathrm{Specificity}-1} $$
Data mapping
The website (http://gadm.org/) was used to upload the map of Algeria and to map the spatial distribution of F. hepatica prevalence; ArcGIS 10.3 software (http://www.esri.com) was used.
Results
During a search of nine databases between 2003 and 2024, 27 articles were deemed eligible for inclusion in this systematic review and meta-analysis (Figure 1).
The selected studies investigated the prevalence of Fasciola infestation in various animal species in different regions of Algeria. Diagnostic methods used included liver inspection in 16 studies, enzyme-linked immunosorbent assay (ELISA) in 7 studies, coproscopy in 4 studies, microscopic examination of bile in 1 study, and analysis of slaughterhouse data in 1 study. Immuno-electrophoresis (IEP) and coproscopy were used for human diagnosis in 1 study at Algiers (Table 1).
Data on the prevalence of fasciolosis in cattle were collected from 20 separate studies of which 16 used liver inspection for diagnosis, 6 used ELISA, 2 used coproscopy, 1 used abattoir data, and 1 used bile microscopy (Table 1).
Eight studies concerning fasciolosis in sheep were identified. Seven of them were based on liver inspection; two used ELISA testing, and one collected data from abattoirs (Table 1).
Four studies involving goats were identified using two diagnostic methods: liver inspection and data collection (Table 1).
One study examined the prevalence of fasciolosis in camels using coproscopy as a diagnostic method (Table 1).
A study carried out in Algiers identified only four cases of human fasciolosis between 1996 and 2005 with two diagnostic methods used: coproscopy and immunoelectrophoresis (IEP) (Table 1).
Overall, a number of 1,006,751 animals species were investigated, of which 15,868 were identified as positive cases, representing a prevalence of 1.57% (95% CI: 1.55–1.59)) Table 2).
Geographical distribution and a forest plot of F. hepatica prevalence in animals in Algeria were presented in Figure 2 and Figure 3, respectively.
Geographical distribution of Fasciola hepatica prevalence in animals in Algeria. Areas of low and high prevalence are represented by different gradient colors; the light color indicates the least affected region, and the dark color represents the most affected region.

Forest plot of Fasciola hepatica prevalence by region and hosts.

Fasciolosis was observed more frequently in the northeastern regions of Algeria (El Tarf, Annaba, Jijel) (prevalence of 15.95%) compared to other regions (northwest, north-central, inland regions, and southern Algeria) (prevalence between 0.86% and 2.95%) (p<0.0001) (Table 2, FSigure 4).
Species breakdown shows 13383/341443 cases in cattle, 2241/533995 in sheep, 163/130588 in goats, and 4/100 in camels, which gives a prevalence 3.91% (95% CI: 3.84–3.98), 0.42% (95% CI: 0.40–0.44), 0.12% (95% CI: 0.10-0.14), and 4% (95% CI: 0.16–7.84), respectively (Table 2). Among ruminants, cattle and camel have been the most prevalent (p<0.001) (Table 2, Figure 4).
Bubble diagram showing the variation in Fasciola hepatica prevalence according to different risk factors. The size of the bubble indicates the incidence.

The prevalence of Fasciola infestation ranges between 0.59% and 61.06% in cattle, 0.04% and 23.81% in sheep, and 0.12% and 0.39% in goats (Table 1). All studies have indicated that prevalence increases with age.
Over the years, a clear decrease in prevalence was observed. The highest prevalence was recorded between 2004 and 2009 (13.29%; 95% CI: 12.69–13.89), followed by a gradual decline during the periods of 2010–2019 (1.79%; 95% CI: 1.75–1.83) and 2020–2024 (1.12%; 95% CI: 1.09–1.15) (p<0.0001) (Table 2, Figure 4).
Table 3 compares the observed and true adjusted prevalence of a disease in cattle and sheep, accounting for biases in the ELISA diagnostic test, which has imperfect specificity. The observed prevalence in cattle ranges from 0.59% to 55.75%, with the true adjusted prevalence consistently lower due to corrections for false positives and negatives. For example, in Chaouadi et al. (Reference Chaouadi, Harhoura, Aissi, Zait, Zenia and Tazerouti2019), the observed prevalence of 28.64% dropped to 26.90% after adjustment. Similarly, Djemai et al. (Reference Djemai, Ayadi, Boubezari, Djafar and Mekroud2024) reported an observed prevalence of 55.75%, which was slightly adjusted to 54.46%. In sheep, observed prevalence values range from 0.46% to 23.81%, with the adjusted prevalence showing a similar reduction. For instance, Mekroud et al. (Reference Mekroud, Benakhla, Vignoles, Rondelaud and Dreyfuss2004) observed a prevalence of 23.81%, which adjusted to 21.98%. When combining cattle and sheep, the overall true adjusted prevalence decreases from 16.40% (observed) to 12.38% (adjusted). These values had no impact on the significant differences reported above.
The adjusted true prevalence of fasciolosis in ruminants

The ELISA technique proved to be the most sensitive method for detecting infestations by F. hepatica. Indeed, the overall prevalence revealed using ELISA was the highest (16.40%; 95% CI: 15.23–17.57) (true adjusted prevalence is 12.38%) compared to other diagnostic methods, such as liver inspection at slaughterhouses (1.83%; 95% CI: 1.80–1.86), coproscopy (1.04%; 95% CI: 0.58–1.50), or data analysis (1.10%; 95% CI: 1.07–1.13) (p<0.0001) (Table 2, Figure 4).
Discussion
To the best of our knowledge, this study is the first meta-analysis conducted in Algeria on fascioliasis, both in animals and humans, covering a 20-year period. By analyzing the available epidemiological data from the past two decades, this research aims to provide a comprehensive overview of the prevalence, risk factors, and trends of F. hepatica infection in Algeria. Through this exhaustive analysis, we hope not only to fill a significant gap in the Algerian scientific literature but also to contribute to a better understanding of the impact of this zoonosis in the local context.
This systematic review and meta-analysis, conducted on studies published between 2004 and 2024, concerned 27 eligible studies, including data on over one million animals, which offer valuable insights into the epidemiology of fasciolosis in Algeria.
The overall prevalence of fasciolosis in animals was found to be 1.57% (95% CI: 1.55–1.59), which is relatively low but significant enough to warrant attention, particularly in certain regions. Notably, the highest prevalence was observed in the northeastern regions of Algeria, such as El Tarf, Annaba, and Jijel, where the prevalence reached 15.95%. This gradient can be attributed to environmental and climatic factors that favor the transmission of F. hepatica, including a humid climate, abundant vegetation, and the presence of clayey soils that are conducive to the development of intermediate host mollusks of F. hepatica. These observations align with the findings of Medeiros et al. (Reference Medeiros, Scholte, D’ávila, Caldeira and Carvalho Odos2014), Howell et al. (Reference Howell, Baylis, Smith, Pinchbeck and Williams2015), and Mas-Coma et al. (Reference Mas-Coma, Bargues and Valero2005), who showed that wetlands, grazing in marshy areas, and clayey soils are major hotspots for the transmission of fasciolosis due to the presence of intermediate hosts such as mollusks.
In contrast, southern and inland regions showed much lower prevalence rates, ranging between 0.9% and 2.95%. The variation in prevalence between regions highlights the importance of localized interventions and targeted control measures.
Livestock – particularly sheep, cattle, goats, and camels – play a significant role in the global spread of fasciolosis (Mehmood et al. Reference Mehmood, Zhang, Sabir, Abbas, Ijaz, Durrani, Saleem, Ur Rehman, Iqbal, Wang, Ahmad, Abbas, Hussain, Ghori, Ali, Khan and Li2017). This disease is prevalent in ruminant farming regions worldwide and is associated with considerable morbidity and mortality rates (Fürst et al. Reference Fürst, Duthaler, Sripa, Utzinger and Keiser2012). Moreover, fasciolosis negatively impacts the quality of products derived from infected animals, leading to reduced yields of meat, milk, and other animal-based products (Lan et al. Reference Lan, Zhang, Jia, Zhang, Wang, Zhang, Gao and Wang2024). In this study, the prevalence of Fasciola infestation in cattle varies widely, ranging from 0.59% to 61.06%. Similar patterns have been reported in African countries, with prevalence rates between 4.9% and 74.9% (Abunna et al. Reference Abunna, Asfaw, Megersa and Regassa2010; Elelu et al. Reference Elelu, Ambali, Coles and Eisler2016), and in Malaysia, where rates range from 7.5% (Fazly-Ann et al. Reference Fazly-Ann, Muhamad-Syamsul-Naim, Wan-Normaziah, Geethamalar and Mohd-Iswadi2015) to 78.0% (Khadijah et al. Reference Khadijah, Ariff, Nurlaili, Sakiinah, Izzudin, Mursyidah, Rita and Nur-Aida2017). On a global scale, the average prevalence worldwide in cattle spans from 12.02% to 96.67% (Lan et al. Reference Lan, Zhang, Jia, Zhang, Wang, Zhang, Gao and Wang2024). Regional variability in the occurrence of bovine fasciolosis is influenced by a range of factors, including climate, environmental conditions, diagnostic techniques, and the diversity of final hosts (Che-Kamaruddin et al. Reference Che-Kamaruddin, Hamid, Idris, Yusuff, Ashaari, Yahaya, Sahimin and Isa2024).
The prevalence in sheep revealed herein varied between 0.04% and 23.81% and seems in line with other African countries (0.19%–16.78%) (Hammami et al. Reference Hammami, Amdouni, Romdhane, Sassi, Farhat, Rekik and Gharbi2024; Mbaya et al. Reference Mbaya, Shingu and Luka2011; Mohamed Reference Mohamed2013; Mungube et al. Reference Mungube, Bauni, Tenhagen, Wamae, Nginyi and Mugambi2006). The overall prevalences in Western Europe did not exceed 16% (Rinaldi et al. Reference Rinaldi, Biggeri, Musella, de Waal, Hertzberg, Mavrot, Torgerson, Selemetas, Coll, Bosco, Grisotto, Cringoli and Catelan2015). In Asia and America, however, infection rates were higher, reaching 40% (Acici et al. Reference Acici, Buyuktanir, Bolukbas, Pekmezci, Gurler and Umur2017; Aghayan et al. Reference Aghayan, Gevorgian, Ebi, Atoyan, Addy, Mackenstedt, Romig and Wassermann2019; Arbabi et al. Reference Arbabi, Nezami, Hooshyar and Delavari2018; Carmona and Tort Reference Carmona and Tort2017). These differences in F. hepatica prevalence rates can be attributed to geographical and climatic factors such as temperature, humidity, rainfall, and many other factors that influence the growth of intermediate hosts (Hammami et al. Reference Hammami, Amdouni, Romdhane, Sassi, Farhat, Rekik and Gharbi2024; Qin et al. Reference Qin, Gao, Wang and Xiao2016; Selemetas et al. Reference Selemetas, Ducheyne, Phelan, O’Kiely, Hendrickx and de Waal2015).
In this study, fasciolosis was infrequently detected in goats, with prevalence ranging from 0.12% to 0.39%. These results align with the findings of Mickiewicz et al. (Reference Mickiewicz, Nowek, Czopowicz, Moroz-Fik, Biernacka, Potărniche, Szaluś-Jordanow, Górski, Nalbert, Buczek, Mālniece, Markowska-Daniel and Kaba2024), who observed a prevalence of 1.2% in Poland. The seroprevalence observed in our study likely provides a more accurate representation of the actual exposure of goats to F. hepatica in Algeria. The level of exposure to F. hepatica in goats is undoubtedly much lower than that seen in cattle and sheep (Mickiewicz et al. Reference Mickiewicz, Nowek, Czopowicz, Moroz-Fik, Biernacka, Potărniche, Szaluś-Jordanow, Górski, Nalbert, Buczek, Mālniece, Markowska-Daniel and Kaba2024). The risk of fasciolosis is mainly determined by the presence and abundance of infected mollusks (Roldán et al. Reference Roldán, Begovoeva, López-Olvera, Velarde, Cabezón, Molinar Min, Pizzato, Pasquetti, Fernández Aguilar, Mentaberre, Serrano, Puig Ribas, Espunyes, Castillo-Contreras, Estruch and Rossi2021). However, these gastropods can only thrive in humid environments, while goats generally avoid wet and marshy pastures (Mickiewicz et al. Reference Mickiewicz, Nowek, Czopowicz, Moroz-Fik, Biernacka, Potărniche, Szaluś-Jordanow, Górski, Nalbert, Buczek, Mālniece, Markowska-Daniel and Kaba2024). Additionally, goats tend to browse rather than graze, which leads to frequent changes in feeding sites and reduces the chances of ingesting large amounts of metacercariae, even on pastures heavily contaminated with the parasite (Smith Reference Smith and Sherman2023).
Fasciolosis mainly affected cattle (3.91%), while sheep (0.42%) and goats (0.12%) had a lower prevalence. These differences may reflect the different feeding habits and habitats of the various species. Livestock grazing in humid areas and other factors were associated with high prevalences (Lan et al. Reference Lan, Zhang, Jia, Zhang, Wang, Zhang, Gao and Wang2024), which is in line with our results. In fact, cattle are concentrated mainly in northern Algeria, which has a humid climate. Sheep and goats, on the other hand, are mainly found in the steppic and southern regions of the country, where the climate is more arid. This explains the high prevalence observed herein in cattle compared with sheep and goats.
The high prevalence observed in dromedaries (4%) in our survey is due to the low number of examined animals (100) and only in one study by Saidi et al. (Reference Saidi, Mimoune, Chaibi, Abdelouahed, Khelef and Kaidi2021) in Laghouat. This result does not reflect the overall situation of camel fasciolosis in Algeria.
Humans can contract fasciolosis by consuming contaminated salads and raw vegetables. The disease has been reported in over 81 countries worldwide (Mas-Coma et al. Reference Mas-Coma, Valero and Bargues2022). The World Health Organization (WHO) has recognized fasciolosis as a neglected tropical disease (Webb and Cabada Reference Webb and Cabada2018). However, in this study, human fasciolosis seems very rare in Algeria, having been observed in only 4 patients (Zait and Hamrioui Reference Zait and Hamrioui2005). Lan et al. (Reference Lan, Zhang, Jia, Zhang, Wang, Zhang, Gao and Wang2024) revealed a worldwide human prevalence of 5%.
The results of this survey showed that prevalence increases with the age of the animals, which is in agreement with the observations of Lan et al. (Reference Lan, Zhang, Jia, Zhang, Wang, Zhang, Gao and Wang2024) worldwide, Che-Kamaruddin et al. (Reference Che-Kamaruddin, Hamid, Idris, Yusuff, Ashaari, Yahaya, Sahimin and Isa2024) in Malaysia, and Zewde et al. (Reference Zewde, Bayu and Wondimu2019) in Ethiopia. This is attributed to older animals experiencing prolonged exposure to Fasciola-contaminated grazing areas (Che-Kamaruddin et al. Reference Che-Kamaruddin, Hamid, Idris, Yusuff, Ashaari, Yahaya, Sahimin and Isa2024). In addition, the immunity of older animals tends to weaken (Lan et al. Reference Lan, Zhang, Jia, Zhang, Wang, Zhang, Gao and Wang2024). In older animals, the parasitic burden of Fasciola lasts longer, facilitating continuous egg excretion and maintaining infection. Unlike younger animals, which are kept indoors and provided with specific feed that reduces exposure to Fasciola metacercariae, older animals have access to contaminated pastures. However, a study conducted in farms without age-based management showed no significant link between age and fascioliasis, as animals of all ages were equally exposed to the infection (Shinggu et al. Reference Shinggu, Olufemi, Nwuku, Baba-Onoja and Iyawa2019).
The ELISA technique demonstrated the highest sensitivity for detecting infestations, with a prevalence of 16.40% (95% CI: 15.23–17.57) (true adjusted prevalence of 12.38%), compared to other methods such as liver inspection (1.83%), coproscopy (1.04%), and slaughterhouse data analysis (1.10%). The higher sensitivity of ELISA may be due to its ability to detect antibodies or antigens even in the early stages of infection (Vashist and Luong Reference Vashist, Luong, Vashist and Luong2018), which may not be identifiable through traditional methods such as liver inspection or coproscopy. These findings underscore the importance of using sensitive diagnostic tools in surveillance efforts to better capture the true extent of Fasciola infections in both animals and humans. These findings corroborate the study of Aftab et al. (Reference Aftab, Raina, Maxton and Masih2024), who emphasized the effectiveness of ELISA for early diagnosis and its ability to detect subclinical cases, particularly in environments with low prevalence.
The decrease in prevalence over two decades (13.29% in 2004–2009 to 1.12% in 2020–2024, p<0.0001) could be attributed to improved veterinary practices, better pasture management, and awareness campaigns in Algeria. The data also suggest an effect of climate change on the dynamics of intermediate hosts, as highlighted by the investigation of Dube et al. (Reference Dube, Kalinda, Manyangadze, Mindu and Chimbari2023) and Fox et al. (Reference Fox, White, McClean, Marion, Evans and Hutchings2011), who show a correlation between climate changes and a reduction in habitats favorable to lymnae. However, while the decline is encouraging, the persistence of the parasite at lower levels suggests that continued surveillance and control strategies remain essential, particularly in high-risk regions.
Conclusion
This study provides a comprehensive analysis of the epidemiology of F. hepatica in Algeria, shedding light on the regional variation in prevalence, the influence of host species, and the diagnostic methods used. Despite the decline in prevalence over the years, Fasciola continues to be a significant concern, particularly in high-risk regions. The findings highlight the importance of continued surveillance and the use of sensitive diagnostic tools like ELISA to monitor and control fasciolosis in both animals and humans.
Financial support
No financial support was obtained.
Competing interest
None.
Ethical standard
This study did not require an ethical approval, as it was based on information/data retrieved from published studies already available in the veterinary public domain.